Get More Information on Cassava Bags Market - Request Sample Report
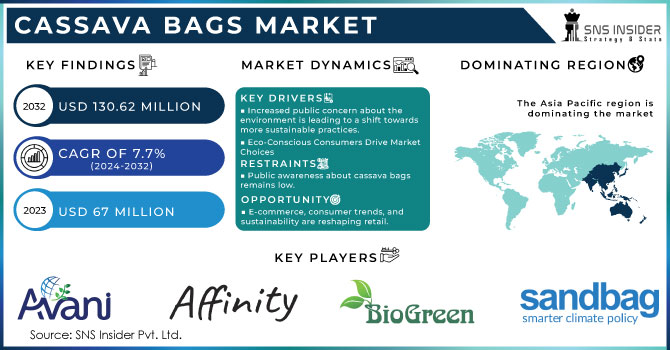
The Cassava Bags Market Size was valued at USD 67 million in 2023 and is projected to reach USD 130.62 million by 2032 and grow at a CAGR of 7.7% over the forecast periods 2024 -2032.
The cassava bag market is projected for significant growth driven by several factors. Rising environmental awareness, particularly concerning plastic pollution in the food and beverage industry due to online delivery, is fueling demand for biodegradable alternatives.
Cassava bags' biodegradability, safety for marine life, and lower carbon footprint compared to traditional plastics are key selling points. Additionally, government regulations aimed at reducing plastic use are creating opportunities.
The food and beverage industry is a key area for cassava bags, driven by the surge in online food delivery and the resulting mountain of plastic takeout containers and bags. A Zomato report highlights this trend, projecting Indian food delivery platforms to reach a staggering 80 million monthly active users , with ambitions to double that number in the coming years. This explosive growth in online food delivery is expected to significantly benefit the cassava bag market. However, the market faces challenges such as complex manufacturing processes requiring expensive equipment, potential methane production in landfills, and the need for specific weather conditions for proper decomposition. L'Oreal's partnership with EcoNest PH for sustainable packaging highlights the potential of cassava bags in the cosmetics industry as well. Overall, the market presents promising opportunities for growth due to its eco-friendly nature and increasing consumer preference for sustainable solutions.
MARKET DYNAMICS
KEY DRIVERS:
Increased public concern about the environment is leading to a shift towards more sustainable practices.
Fueled by growing concerns about plastic pollution's harm to our environment and health, consumers are increasingly seeking eco-friendly alternatives like cassava bags. This shift towards sustainability reflects a rising public consciousness about the impact of packaging choices.
Consumers, driven by a growing desire for a healthier planet, are increasingly making conscious choices
RESTRAINTS:
Public awareness about cassava bags remains low.
Switching to cassava bags is initially costlier due to R&D and supply chain adjustments.
Several factors contribute to the higher initial cost of switching to cassava bags. These include ongoing research and development (R&D) to optimize production processes and material science. Additionally, establishing a new supply chain for cassava-based materials requires infrastructure investment and navigating new logistics compared to established plastic production.
OPPORTUNITY:
Cassava bags are improving in affordability, versatility, and availability thanks to ongoing R&D in materials, processing, and design.
E-commerce, consumer trends, and sustainability are reshaping retail.
The retail industry's growing focus on sustainability is driving a shift towards eco-friendly packaging like cassava bags. This trend pushes manufacturers and suppliers to adapt and offer greener options to meet retailers' evolving needs.
CHALLENGES:
Cassava bag production faces challenges due to limited cassava crop availability and a lack of processing infrastructure.
Cassava bag production involves a more intricate process compared to the simpler methods used for regular plastics.
Regular plastic manufacturing typically relies on a well-established, high-volume production line, whereas cassava bags often involve additional steps such as sourcing the cassava starch, purifying it, and combining it with other bio-based materials. This can make cassava bag production less scalable at present.
IMPACT OF RUSSIA UKRAINE WAR
The war has caused significant increases in energy and fertilizer prices. Cassava cultivation likely wouldn't be exempt from these cost hikes. This could lead to increased cassava bag production costs, making them potentially less competitive compared to other packaging options. With concerns about global food security and potentially higher import costs, some countries, particularly those dependent on wheat imports like Nigeria, might prioritize boosting domestic production of alternative food sources like cassava. This could lead to increased demand for cassava, potentially benefiting the cassava bag market as a byproduct.
IMPACT OF ECONOMIC SLOWDOWN
During an economic slowdown or recession, rising food prices can disproportionately affect the cassava bag market, particularly in developing economies like those in Africa. As food becomes more expensive, especially staples like cassava, people in poverty may prioritize buying the food itself over pricier packaging options like cassava bags. This could lead to a decrease in demand for these bags, particularly for non-essential uses like shopping bags for discretionary purchases. The price competitiveness of cassava bags compared to traditional plastics will be a significant factor influencing consumer behavior. However, in the long term, the focus on food security could lead to increased cassava production, potentially benefiting the cassava bag market as a byproduct. Additionally, if cassava remains a staple food source during a recession, the market could see a rebound in demand once economic conditions improve.
KEY MARKET SEGMENTS
By Type
Grip-Hole
T-Shirt
Garbage
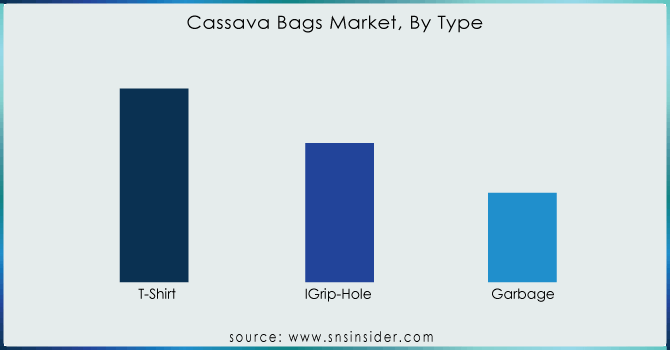
T-shirt bags dominates in the cassava bag market, capturing a around 57% of market revenue. This dominance reflects the preference of eco-conscious consumers and companies seeking to promote sustainability. For these companies, choosing cassava-based materials for T-shirt bags, boosting their brand image while aligning with evolving consumer preferences.
Need any customization research on Cassava Bags Market - Enquiry Now
By Category
Organic
Conventional
The organic segment leads the cassava bag market at 60% share, appealing to both eco-conscious brands and health-focused consumers. Brands promoting sustainability can leverage this segment's focus on responsible sourcing and minimal chemical use, potentially driving further growth across various markets.
By End User
Food & Beverages
Animal Feed
Food and beverages dominating with 61% market share in cassava bag usage. These bags are popular for packaging fresh produce, snacks, and ready-to-eat meals due to their excellent moisture resistance, which helps maintain food freshness and quality.
REGIONAL ANALYSIS
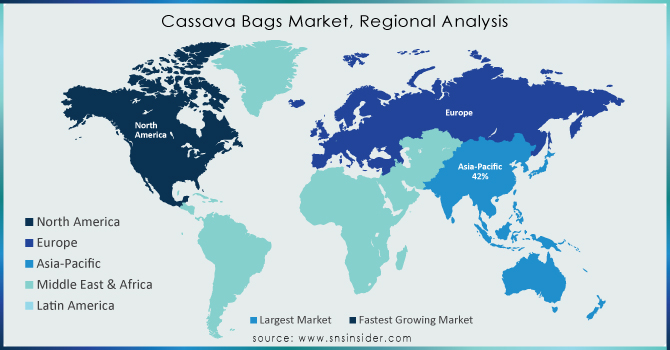
The Asia Pacific region dominates the cassava bag market with share of 42% due to a confluence of factors such as a large population with rising disposable income, growing environmental awareness about plastic pollution, and increasing consumption of processed foods. This booming market benefits from being located in major cassava-producing countries like Thailand, Indonesia, China, and Vietnam. These countries not only manufacture cassava bags but have also developed lightweight varieties for export. Additionally, China's use of cassava extract for biofuel production further promotes sustainability in the region by reducing greenhouse gas emissions and reliance on imported fuels. Moreover, the textile industry's adoption of cassava to enhance thread quality contributes to the overall improvement of cassava bags in the Asia Pacific.
North America is projected for solid cassava bag growth due to rising environmental awareness and high packaged food consumption. Additionally, Brazil's production capacity and growing beauty and hospitality industries in the Americas will contribute to market expansion. South Africa aims to cultivate cassava with NGO support (SHA) since 2016. In Nigeria, Bakeries are adopting cassava flour for bread production due to lower costs and simpler ingredients.
REGIONAL COVERAGE:
North America
US
Canada
Mexico
Europe
Eastern Europe
Poland
Romania
Hungary
Turkey
Rest of Eastern Europe
Western Europe
Germany
France
UK
Italy
Spain
Netherlands
Switzerland
Austria
Rest of Western Europe
Asia Pacific
China
India
Japan
South Korea
Vietnam
Singapore
Australia
Rest of Asia Pacific
Middle East & Africa
Middle East
UAE
Egypt
Saudi Arabia
Qatar
Rest of Middle East
Africa
Nigeria
South Africa
Rest of Africa
Latin America
Brazil
Argentina
Colombia
Rest of Latin America
Key players
Some the major players in Cassava Bags Market are Avani Eco Affinity Supply Co, Biopac India Co. Ltd., Envigreen Biotech India Pvt. Ltd, Affinity Supply Co., Biogreen Bags Co. Ltd, SainBag No Plastic International Pty Ltd, SandBag, IMillionotplasticbag, Baolai Packaging Co., Ltd., Urban Plastik Indonesia, Baolai Packaging Co., Ltd., Tipa, Henan Baolai Packaging Co., Ltd. And Others Players.
RECENT DEVELOPMENT
Cassava Bags Australia won a global sustainability competition in May 2023, beating out hundreds of other eco-friendly startups. This win highlights their dedication to environmentally friendly practices.
DRDO, along with Acharya Nagarjuna University and Ecolastic, developed and launched plant-based, food-safe biodegradable packaging solutions in July 2021.
ALPLA Group partnered with Slovak bioplastics leader Panara in July 2021, acquiring a minority stake to advance biodegradable packaging solutions, including bags.
Report Attributes | Details |
---|---|
Market Size in 2023 | US$ 67 Mn |
Market Size by 2032 | US$ 130.62 Mn |
CAGR | CAGR of 7.7% From 2024 to 2032 |
Base Year | 2023 |
Forecast Period | 2024-2032 |
Historical Data | 2020-2022 |
Report Scope & Coverage | Market Size, Segments Analysis, Competitive Landscape, Regional Analysis, DROC & SWOT Analysis, Forecast Outlook |
Key Segments | • By Type (Grip-Hole, T-Shirt, Garbage), By Category (Organic, Conventional) • By End User (Food & Beverages, Animal Feed) |
Regional Analysis/Coverage | North America (US, Canada, Mexico), Europe (Eastern Europe [Poland, Romania, Hungary, Turkey, Rest of Eastern Europe] Western Europe] Germany, France, UK, Italy, Spain, Netherlands, Switzerland, Austria, Rest of Western Europe]), Asia Pacific (China, India, Japan, South Korea, Vietnam, Singapore, Australia, Rest of Asia Pacific), Middle East & Africa (Middle East [UAE, Egypt, Saudi Arabia, Qatar, Rest of Middle East], Africa [Nigeria, South Africa, Rest of Africa], Latin America (Brazil, Argentina, Colombia Rest of Latin America) |
Company Profiles | Avani Eco Affinity Supply Co, Biopac India Co. Ltd., Envigreen Biotech India Pvt. Ltd, Affinity Supply Co., Biogreen Bags Co. Ltd, SainBag No Plastic International Pty Ltd, SandBag, IMillionotplasticbag, Baolai Packaging Co., Ltd., Urban Plastik Indonesia, Baolai Packaging Co., Ltd., Tipa, Henan Baolai Packaging Co., Ltd. |
Key Drivers | • Increased public concern about the environment is leading to a shift towards more sustainable practices. • Consumers, driven by a growing desire for a healthier planet, are increasingly making conscious choices |
Key Restraints | • Public awareness about cassava bags remains low. • Switching to cassava bags is initially costlier due to R&D and supply chain adjustments. |
Ans: The Cassava Bags Market is expected to grow at a CAGR of 7.7%.
Ans: Cassava Bags Market size was USD 67 million in 2023 and is expected to Reach USD 130.62 million by 2032.
Ans: Increased public concern about the environment is leading to a shift towards more sustainable practices.
Ans: Switching to cassava bags is initially costlier due to R&D and supply chain adjustments.
Ans: Asia-Pacific holds the dominant position with the market share of 42%.
TABLE OF CONTENTS
1. Introduction
1.1 Market Definition
1.2 Scope
1.3 Research Assumptions
2. Industry Flowchart
3. Research Methodology
4. Market Dynamics
4.1 Drivers
4.2 Restraints
4.3 Opportunities
4.4 Challenges
5. Impact Analysis
5.1 Impact of Russia-Ukraine Crisis
5.2 Impact of Economic Slowdown on Major Countries
5.2.1 Introduction
5.2.2 United States
5.2.3 Canada
5.2.4 Germany
5.2.5 France
5.2.6 UK
5.2.7 China
5.2.8 Japan
5.2.9 South Korea
5.2.10 India
6. Value Chain Analysis
7. Porter’s 5 Forces Model
8. Pest Analysis
9. Cassava Bags Market Segmentation, By Type
9.1 Introduction
9.2 Trend Analysis
9.3 Grip-Hole
9.4 T-Shirt
9.5 Garbage
10. Cassava Bags Market Segmentation, By Category
10.1 Introduction
10.2 Trend Analysis
10.3 Organic
10.4 Conventional
11. Cassava Bags Market Segmentation, By End User
11.1 Introduction
11.2 Trend Analysis
11.3 Food & Beverages
11.4 Animal Feed
12. Regional Analysis
12.1 Introduction
12.2 North America
12.2.1 Trend Analysis
12.2.2 North America Cassava Bags Market by Country
12.2.3 North America Cassava Bags Market By Type
12.2.4 North America Cassava Bags Market By Category
12.2.5 North America Cassava Bags Market By End User
12.2.6 USA
12.2.6.1 USA Cassava Bags Market By Type
12.2.6.2 USA Cassava Bags Market By Category
12.2.6.3 USA Cassava Bags Market By End User
12.2.7 Canada
12.2.7.1 Canada Cassava Bags Market By Type
12.2.7.2 Canada Cassava Bags Market By Category
12.2.7.3 Canada Cassava Bags Market By End User
12.2.8 Mexico
12.2.8.1 Mexico Cassava Bags Market By Type
12.2.8.2 Mexico Cassava Bags Market By Category
12.2.8.3 Mexico Cassava Bags Market By End User
12.3 Europe
12.3.1 Trend Analysis
12.3.2 Eastern Europe
12.3.2.1 Eastern Europe Cassava Bags Market by Country
12.3.2.2 Eastern Europe Cassava Bags Market By Type
12.3.2.3 Eastern Europe Cassava Bags Market By Category
12.3.2.4 Eastern Europe Cassava Bags Market By End User
12.3.2.5 Poland
12.3.2.5.1 Poland Cassava Bags Market By Type
12.3.2.5.2 Poland Cassava Bags Market By Category
12.3.2.5.3 Poland Cassava Bags Market By End User
12.3.2.6 Romania
12.3.2.6.1 Romania Cassava Bags Market By Type
12.3.2.6.2 Romania Cassava Bags Market By Category
12.3.2.6.4 Romania Cassava Bags Market By End User
12.3.2.7 Hungary
12.3.2.7.1 Hungary Cassava Bags Market By Type
12.3.2.7.2 Hungary Cassava Bags Market By Category
12.3.2.7.3 Hungary Cassava Bags Market By End User
12.3.2.8 Turkey
12.3.2.8.1 Turkey Cassava Bags Market By Type
12.3.2.8.2 Turkey Cassava Bags Market By Category
12.3.2.8.3 Turkey Cassava Bags Market By End User
12.3.2.9 Rest of Eastern Europe
12.3.2.9.1 Rest of Eastern Europe Cassava Bags Market By Type
12.3.2.9.2 Rest of Eastern Europe Cassava Bags Market By Category
12.3.2.9.3 Rest of Eastern Europe Cassava Bags Market By End User
12.3.3 Western Europe
12.3.3.1 Western Europe Cassava Bags Market by Country
12.3.3.2 Western Europe Cassava Bags Market By Type
12.3.3.3 Western Europe Cassava Bags Market By Category
12.3.3.4 Western Europe Cassava Bags Market By End User
12.3.3.5 Germany
12.3.3.5.1 Germany Cassava Bags Market By Type
12.3.3.5.2 Germany Cassava Bags Market By Category
12.3.3.5.3 Germany Cassava Bags Market By End User
12.3.3.6 France
12.3.3.6.1 France Cassava Bags Market By Type
12.3.3.6.2 France Cassava Bags Market By Category
12.3.3.6.3 France Cassava Bags Market By End User
12.3.3.7 UK
12.3.3.7.1 UK Cassava Bags Market By Type
12.3.3.7.2 UK Cassava Bags Market By Category
12.3.3.7.3 UK Cassava Bags Market By End User
12.3.3.8 Italy
12.3.3.8.1 Italy Cassava Bags Market By Type
12.3.3.8.2 Italy Cassava Bags Market By Category
12.3.3.8.3 Italy Cassava Bags Market By End User
12.3.3.9 Spain
12.3.3.9.1 Spain Cassava Bags Market By Type
12.3.3.9.2 Spain Cassava Bags Market By Category
12.3.3.9.3 Spain Cassava Bags Market By End User
12.3.3.10 Netherlands
12.3.3.10.1 Netherlands Cassava Bags Market By Type
12.3.3.10.2 Netherlands Cassava Bags Market By Category
12.3.3.10.3 Netherlands Cassava Bags Market By End User
12.3.3.11 Switzerland
12.3.3.11.1 Switzerland Cassava Bags Market By Type
12.3.3.11.2 Switzerland Cassava Bags Market By Category
12.3.3.11.3 Switzerland Cassava Bags Market By End User
12.3.3.1.12 Austria
12.3.3.12.1 Austria Cassava Bags Market By Type
12.3.3.12.2 Austria Cassava Bags Market By Category
12.3.3.12.3 Austria Cassava Bags Market By End User
12.3.3.13 Rest of Western Europe
12.3.3.13.1 Rest of Western Europe Cassava Bags Market By Type
12.3.3.13.2 Rest of Western Europe Cassava Bags Market By Category
12.3.3.13.3 Rest of Western Europe Cassava Bags Market By End User
12.4 Asia-Pacific
12.4.1 Trend Analysis
12.4.2 Asia-Pacific Cassava Bags Market by Country
12.4.3 Asia-Pacific Cassava Bags Market By Type
12.4.4 Asia-Pacific Cassava Bags Market By Category
12.4.5 Asia-Pacific Cassava Bags Market By End User
12.4.6 China
12.4.6.1 China Cassava Bags Market By Type
12.4.6.2 China Cassava Bags Market By Category
12.4.6.3 China Cassava Bags Market By End User
12.4.7 India
12.4.7.1 India Cassava Bags Market By Type
12.4.7.2 India Cassava Bags Market By Category
12.4.7.3 India Cassava Bags Market By End User
12.4.8 Japan
12.4.8.1 Japan Cassava Bags Market By Type
12.4.8.2 Japan Cassava Bags Market By Category
12.4.8.3 Japan Cassava Bags Market By End User
12.4.9 South Korea
12.4.9.1 South Korea Cassava Bags Market By Type
12.4.9.2 South Korea Cassava Bags Market By Category
12.4.9.3 South Korea Cassava Bags Market By End User
12.4.10 Vietnam
12.4.10.1 Vietnam Cassava Bags Market By Type
12.4.10.2 Vietnam Cassava Bags Market By Category
12.4.10.3 Vietnam Cassava Bags Market By End User
12.4.11 Singapore
12.4.11.1 Singapore Cassava Bags Market By Type
12.4.11.2 Singapore Cassava Bags Market By Category
12.4.11.3 Singapore Cassava Bags Market By End User
12.4.12 Australia
12.4.12.1 Australia Cassava Bags Market By Type
12.4.12.2 Australia Cassava Bags Market By Category
12.4.12.3 Australia Cassava Bags Market By End User
12.4.13 Rest of Asia-Pacific
12.4.13.1 Rest of Asia-Pacific Cassava Bags Market By Type
12.4.13.2 Rest of Asia-Pacific Cassava Bags Market By Category
12.4.13.3 Rest of Asia-Pacific Cassava Bags Market By End User
12.5 Middle East & Africa
12.5.1 Trend Analysis
12.5.2 Middle East
12.5.2.1 Middle East Cassava Bags Market by Country
12.5.2.2 Middle East Cassava Bags Market By Type
12.5.2.3 Middle East Cassava Bags Market By Category
12.5.2.4 Middle East Cassava Bags Market By End User
12.5.2.5 UAE
12.5.2.5.1 UAE Cassava Bags Market By Type
12.5.2.5.2 UAE Cassava Bags Market By Category
12.5.2.5.3 UAE Cassava Bags Market By End User
12.5.2.6 Egypt
12.5.2.6.1 Egypt Cassava Bags Market By Type
12.5.2.6.2 Egypt Cassava Bags Market By Category
12.5.2.6.3 Egypt Cassava Bags Market By End User
12.5.2.7 Saudi Arabia
12.5.2.7.1 Saudi Arabia Cassava Bags Market By Type
12.5.2.7.2 Saudi Arabia Cassava Bags Market By Category
12.5.2.7.3 Saudi Arabia Cassava Bags Market By End User
12.5.2.8 Qatar
12.5.2.8.1 Qatar Cassava Bags Market By Type
12.5.2.8.2 Qatar Cassava Bags Market By Category
12.5.2.8.3 Qatar Cassava Bags Market By End User
12.5.2.9 Rest of Middle East
12.5.2.9.1 Rest of Middle East Cassava Bags Market By Type
12.5.2.9.2 Rest of Middle East Cassava Bags Market By Category
12.5.2.9.3 Rest of Middle East Cassava Bags Market By End User
12.5.3 Africa
12.5.3.1 Africa Cassava Bags Market by Country
12.5.3.2 Africa Cassava Bags Market By Type
12.5.3.3 Africa Cassava Bags Market By Category
12.5.3.4 Africa Cassava Bags Market By End User
12.5.3.5 Nigeria
12.5.3.5.1 Nigeria Cassava Bags Market By Type
12.5.3.5.2 Nigeria Cassava Bags Market By Category
12.5.3.5.3 Nigeria Cassava Bags Market By End User
12.5.3.6 South Africa
12.5.3.6.1 South Africa Cassava Bags Market By Type
12.5.3.6.2 South Africa Cassava Bags Market By Category
12.5.3.6.3 South Africa Cassava Bags Market By End User
12.5.3.7 Rest of Africa
12.5.3.7.1 Rest of Africa Cassava Bags Market By Type
12.5.3.7.2 Rest of Africa Cassava Bags Market By Category
12.5.3.7.3 Rest of Africa Cassava Bags Market By End User
12.6 Latin America
12.6.1 Trend Analysis
12.6.2 Latin America Cassava Bags Market by country
12.6.3 Latin America Cassava Bags Market By Type
12.6.4 Latin America Cassava Bags Market By Category
12.6.5 Latin America Cassava Bags Market By End User
12.6.6 Brazil
12.6.6.1 Brazil Cassava Bags Market By Type
12.6.6.2 Brazil Cassava Bags Market By Category
12.6.6.3 Brazil Cassava Bags Market By End User
12.6.7 Argentina
12.6.7.1 Argentina Cassava Bags Market By Type
12.6.7.2 Argentina Cassava Bags Market By Category
12.6.7.3 Argentina Cassava Bags Market By End User
12.6.8 Colombia
12.6.8.1 Colombia Cassava Bags Market By Type
12.6.8.2 Colombia Cassava Bags Market By Category
12.6.8.3 Colombia Cassava Bags Market By End User
12.6.9 Rest of Latin America
12.6.9.1 Rest of Latin America Cassava Bags Market By Type
12.6.9.2 Rest of Latin America Cassava Bags Market By Category
12.6.9.3 Rest of Latin America Cassava Bags Market By End User
13. Company Profiles
13.1 Avani Eco Affinity Supply Co
13.1.1 Company Overview
13.1.2 Financial
13.1.3 Products/ Services Offered
13.1.4 SWOT Analysis
13.1.5 The SNS View
13.2 Biopac India Co. Ltd.
13.2.1 Company Overview
13.2.2 Financial
13.2.3 Products/ Services Offered
13.2.4 SWOT Analysis
13.2.5 The SNS View
13.3 Envigreen Biotech India Pvt. Ltd
13.3.1 Company Overview
13.3.2 Financial
13.3.3 Products/ Services Offered
13.3.4 SWOT Analysis
13.3.5 The SNS View
13.4 Affinity Supply Co.
13.4.1 Company Overview
13.4.2 Financial
13.4.3 Products/ Services Offered
13.4.4 SWOT Analysis
13.4.5 The SNS View
13.5 Biogreen Bags Co. Ltd
13.5.1 Company Overview
13.5.2 Financial
13.5.3 Products/ Services Offered
13.5.4 SWOT Analysis
13.5.5 The SNS View
13.6 SainBag No Plastic International Pty Ltd
13.6.1 Company Overview
13.6.2 Financial
13.6.3 Products/ Services Offered
13.6.4 SWOT Analysis
13.6.5 The SNS View
13.7 SandBag
13.7.1 Company Overview
13.7.2 Financial
13.7.3 Products/ Services Offered
13.7.4 SWOT Analysis
13.7.5 The SNS View
13.8 IMillionotplasticbag
13.8.1 Company Overview
13.8.2 Financial
13.8.3 Products/ Services Offered
13.8.4 SWOT Analysis
13.8.5 The SNS View
13.9 Baolai Packaging Co., Ltd.
13.9.1 Company Overview
13.9.2 Financial
13.9.3 Products/ Services Offered
13.9.4 SWOT Analysis
13.9.5 The SNS View
13.10 Urban Plastik Indonesia
13.10.1 Company Overview
13.10.2 Financial
13.10.3 Products/ Services Offered
13.10.4 SWOT Analysis
13.10.5 The SNS View
13.11 Baolai Packaging Co., Ltd.
13.11.1 Company Overview
13.11.2 Financial
13.11.3 Products/ Services Offered
13.11.4 SWOT Analysis
13.11.5 The SNS View
13.12 Tipa
13.12.1 Company Overview
13.12.2 Financial
13.12.3 Products/ Services Offered
13.12.4 SWOT Analysis
13.12.5 The SNS View
13.13 Henan Baolai Packaging Co., Ltd.
13.13.1 Company Overview
13.13.2 Financial
13.13.3 Products/ Services Offered
13.13.4 SWOT Analysis
13.13.5 The SNS View
14. Competitive Landscape
14.1 Competitive Benchmarking
14.2 Market Share Analysis
14.3 Recent Developments
14.3.1 Industry News
14.3.2 Company News
14.3.3 Mergers & Acquisitions
15. Use Case and Best Practices
16. Conclusion
An accurate research report requires proper strategizing as well as implementation. There are multiple factors involved in the completion of good and accurate research report and selecting the best methodology to compete the research is the toughest part. Since the research reports we provide play a crucial role in any company’s decision-making process, therefore we at SNS Insider always believe that we should choose the best method which gives us results closer to reality. This allows us to reach at a stage wherein we can provide our clients best and accurate investment to output ratio.
Each report that we prepare takes a timeframe of 350-400 business hours for production. Starting from the selection of titles through a couple of in-depth brain storming session to the final QC process before uploading our titles on our website we dedicate around 350 working hours. The titles are selected based on their current market cap and the foreseen CAGR and growth.
The 5 steps process:
Step 1: Secondary Research:
Secondary Research or Desk Research is as the name suggests is a research process wherein, we collect data through the readily available information. In this process we use various paid and unpaid databases which our team has access to and gather data through the same. This includes examining of listed companies’ annual reports, Journals, SEC filling etc. Apart from this our team has access to various associations across the globe across different industries. Lastly, we have exchange relationships with various university as well as individual libraries.
Step 2: Primary Research
When we talk about primary research, it is a type of study in which the researchers collect relevant data samples directly, rather than relying on previously collected data. This type of research is focused on gaining content specific facts that can be sued to solve specific problems. Since the collected data is fresh and first hand therefore it makes the study more accurate and genuine.
We at SNS Insider have divided Primary Research into 2 parts.
Part 1 wherein we interview the KOLs of major players as well as the upcoming ones across various geographic regions. This allows us to have their view over the market scenario and acts as an important tool to come closer to the accurate market numbers. As many as 45 paid and unpaid primary interviews are taken from both the demand and supply side of the industry to make sure we land at an accurate judgement and analysis of the market.
This step involves the triangulation of data wherein our team analyses the interview transcripts, online survey responses and observation of on filed participants. The below mentioned chart should give a better understanding of the part 1 of the primary interview.
Part 2: In this part of primary research the data collected via secondary research and the part 1 of the primary research is validated with the interviews from individual consultants and subject matter experts.
Consultants are those set of people who have at least 12 years of experience and expertise within the industry whereas Subject Matter Experts are those with at least 15 years of experience behind their back within the same space. The data with the help of two main processes i.e., FGDs (Focused Group Discussions) and IDs (Individual Discussions). This gives us a 3rd party nonbiased primary view of the market scenario making it a more dependable one while collation of the data pointers.
Step 3: Data Bank Validation
Once all the information is collected via primary and secondary sources, we run that information for data validation. At our intelligence centre our research heads track a lot of information related to the market which includes the quarterly reports, the daily stock prices, and other relevant information. Our data bank server gets updated every fortnight and that is how the information which we collected using our primary and secondary information is revalidated in real time.
Step 4: QA/QC Process
After all the data collection and validation our team does a final level of quality check and quality assurance to get rid of any unwanted or undesired mistakes. This might include but not limited to getting rid of the any typos, duplication of numbers or missing of any important information. The people involved in this process include technical content writers, research heads and graphics people. Once this process is completed the title gets uploader on our platform for our clients to read it.
Step 5: Final QC/QA Process:
This is the last process and comes when the client has ordered the study. In this process a final QA/QC is done before the study is emailed to the client. Since we believe in giving our clients a good experience of our research studies, therefore, to make sure that we do not lack at our end in any way humanly possible we do a final round of quality check and then dispatch the study to the client.
The Fresh Food Packaging Market size was valued at USD 135.5 billion in 2023 and is expected to Reach USD 198 billion by 2031 and grow at a CAGR of 4.8% over the forecast period of 2024-2031.
The Frozen Seafood Packaging Market Size was valued at USD 16.23 billion in 2023 and is projected to reach USD 26.06 billion by 2031 and grow at a CAGR of 6.1% over the forecast periods 2024 -2031.
The Jerry Cans Market size was USD 2.34 billion in 2023 and is expected to Reach USD 3.51 billion by 2031 and grow at a CAGR of 4.64 % over the forecast period of 2024-2031.
The market for Variable Data Printing Market in 2023 was estimated at USD 13.21 billion, and by 2031 it is projected to reach USD 36.15 billion with a CAGR of 13.4% over the period from 2024 to 2031.
The Smart Transportation Market size was valued at USD 121.33 billion in 2023 and is expected to grow to USD 355.87 billion by 2032, achieving a compound annual growth rate (CAGR) of 13.02% during the forecast period of 2024-2032.
The Brick Carton Packaging Market size was USD 11.54 Billion in 2023 and will reach USD 17.60 Billion by 2032 and grow at a CAGR of 4.81% by 2024-2032.
Hi! Click one of our member below to chat on Phone