The Category Management Software Market size was valued at USD 2.17 billion in 2024 and is projected to reach USD 4.89 billion by 2032, growing at a CAGR of 10.7% from 2025 to 2032.
Retailers and small box retailers adopt category management software to use data-driven category-specific tools to plan assortment, optimize shelf, and collaborate with suppliers. Features like real-time analytics, automated reporting, and AI integration boost operational efficiency and customer experience. The growing popularity of cloud solutions, particularly among small- and medium-sized enterprises that prefer their scalability and cost-effectiveness, along with the trend for large enterprises to use a central, integrated platform. The market is large in North America and growing rapidly in Asia Pacific, driven by retail digitalization. Top category management software market companies such as Oracle, DotActiv, and GEP are constantly working on innovations that will ensure businesses remain competitive in the era of technology while quickly responding to consumer demand trends.
According to research, over 60% of category management platforms will be AI-enabled by 2024, with 45% of them across in-store and online channels, unlocking revenue gains, stock optimization, and sustainability adoption by 28% of users.
The U.S Category Management Software Market was valued at USD 0.57 billion in 2024 and is projected to reach USD 1.25 billion by 2032 with a CAGR of 11.71% during the forecast period of 2025-2032.
This growth is attributed to the presence of a highly developed retail infrastructure, the early technological adoption of AI-based technologies, and the presence of major market players such as Oracle and Epicor in the U.S. Driving factors are the rising need for real-time analytics, customization of product assortment, and integration of omnichannel retail efforts. Furthermore, the growing cloud-based deployments among large enterprises as well as SMEs will also spur the market uptake. The quick growth of this market in the country is further accelerated by support for the digital transformation of regulatory bodies and high expectations of consumers.
Drivers:
Rising Need for Data-Driven Retail Optimization to Improve Profitability and Consumer Experience.
Increased use of data analytics among the retail and consumer packaged goods industries is the key driver for adopting category management software. Enterprises are using better tools for forecasting demand, planning assortment, and pricing more to maximize shelf productivity and customer engagement. Some of the trends in recent times involve the inclusion of artificial intelligence and machine learning algorithms in category management systems for enabling real-time decision-making and predictive analytics. Additionally, the advent of omnichannel models of retail and one-to-one marketing further indicates the importance of automated and fact-driven solutions.
Restraints:
High Implementation Costs and Integration Complexities Across Existing Retail Ecosystems Hamper Software Adoption.
One of the key constraints is the substantial up-front investment needed for category management software adoption, especially by small and mid-sized companies. Integrating these applications with existing enterprise resource planning, customer relationship management, and supply chain systems is operationally challenging. The need for change management, specialized training exacerbates deployment resistance. One of these very important factors is the fear of downtime when transitioning from legacy systems, along with data migration. This hesitancy is primarily prevalent in emerging economies, where heavy budgets and a lack of digital infrastructure are still slowing down the adoption cycle.
Opportunities:
Expanding Digital Retail Infrastructure and E-Commerce Penetration in Emerging Markets Presents Lucrative Growth Prospects.
The accelerated digitalization of retail infrastructure and e-commerce mania in emerging markets present huge opportunities for category management software solution providers. Asia Pacific, Latin America, and the Middle East markets are experiencing investments in cloud-based retail solutions in a bid to leverage operational efficiency and customer interactions. Some of the latest category management software market trends have been the use of mobile-based retail analytics, localized software solutions, and government-sponsored digital transformation programs. Players specializing in low-cost, scalable, and location-focused platforms are likely to gain from this upsurge.
Challenges:
Inconsistent Data Quality and Lack of Standardization Across Retail Channels Challenge Software Accuracy and Effectiveness.
The greatest challenge category management software faces in its success is the disaggregation and diversity of the retail data streams by channel of sale. Variations in product categorization across companies, variations in inventory form (pallets vs pieces), and added variability in how consumers tend to treat them make the prospect of simple and actionable insights throughout the system difficult. Such standardization impacts the accuracy of demand forecasts, assortment plans, and performance measurements.
By Component
In 2024, the solution segment holds the largest revenue share of 63.48% of the market, owing to rising demand for AI-based tools to support assortment planning, price optimization, and shelf management. Oracle, DotActiv Board International have expanded the reach of analytics and accelerated real-time decisions. Growth in data-driven category strategies, particularly in retail and CPG businesses, remains driving adoption. With companies looking for scalable, integrated platforms, solution-based solutions remain at the forefront of digital retail transformation, significantly driving the maturity and strategic value of the market.
For example, DotActiv introduced improved planogram automation capabilities specifically for grocery chains.
The service segment is expected to grow at the fastest CAGR of 12.92%, due to the rise in demand for implementation, consulting, and training services. These services turn out to be very useful for organizations, especially for SMEs to deploy complex implementations. For instance, GEP and Softvision are a few vendors who have expanded their service portfolio with cloud migration assistance and real-time analytics customization. The increasing demand for continuous support and optimization of software environments is a major driver.
In addition, the demand for customized retailing and performance benchmarking is boosting the value of customized service offerings, directly fueling market growth by business size and geography.
By Deployment
The cloud segment leads the market with 61.39% revenue share. As the demand for scalable, cost-efficient, and easily deployable cloud solutions continues to grow, the retail sector is increasingly embracing these technologies. With cloud-based solutions from providers like Aptos and JAGGAER, you can collaborate from anywhere, access updates in real time, and upgrade seamlessly. JAGGAER revamped its SaaS model to support predictive assortment planning for fast-moving retail chains. Cloud deployment gained tremendous success amongst companies that want to adjust themselves to the market variation and customer behaviour, and at the same time reduce the cost of infrastructure.
The on-premise segment will have a CAGR of 12.83%, due to the presence of enterprises with stringent data governance, compliance, and customization needs. Corporate enterprises, particularly those in regulated spaces, still invest in secure on-premises solutions. This segment is also being fueled due to the requirement for internal governance, consistent performance, and custom integration with legacy or on-premise systems.
For example, Epicor announced improved on-premise functionality with upgraded reporting for global retailers.
By Organization Size
In 2024, large enterprises will have the maximum category management software market share of 68.13% because they can spend on modern software ecosystems and integrate them with the digital infrastructure, which has already been adopted. Enterprises such as Oracle and Epicor target this segment, where support for AI-enabled category planning and supplier collaboration has a regional focus. The driving force here is not the mobile revolution or third-party services, but the enterprise-level demand for scalable, integrated platforms that support omnichannel retailing and advanced analytics.
SMEs segment is estimated to grow at the highest CAGR of 12.33% during the forecast period, owing to cost-effective and cloud-based solutions that require low IT infrastructure. Some of these platforms, like 42 Technologies and DotActiv are focusing on minimalist dashboards and SaaS solutions that target small businesses. One of the main drivers is the fact that data is being made available to all, and category planning tools have become available via subscription. In 2024, 42 Technologies introduced a retail analytics suite tailored for SMEs, featuring automated reporting and localized language support.
According to research, the adoption of cloud-based category management software among SMEs has risen by 42%, largely due to its cost-efficiency and scalability advantages.
By Application
Retail heads the application segment with 53.11% revenue share in 2024, fuelled by the category management software industry's focus on shelf management, consumer trends, and forecasted demand. Solutions from entities such as DotActiv and INTERACTIVE EDGE have integrated retail intelligence, planogram automation, and price simulation functionality. In addition to the heatmaps, DotActiv also broadened the retail platform to some cross-merchandising opportunities as well. The impetus is increased omnichannel complexity and a need for a unified consumer experience.
The consumer-packaged goods industry is expected to attain the fastest CAGR at 13.02%, owing to the need for seamless collaboration with retailers, optimization of shelf placement, and understanding consumer behaviour. Companies like Board International and GEP are providing solution-driven joint business planning, real-time data sharing, and SKU rationalization. Board International introduced a CPG analytics module with integrated supply chain data in 2024. One of the main drivers is the increasing need for agility and efficiency in product selection in response to changes in consumption.
North America captures a 38.39% share of the market in 2024 due to its high level of digital adoption, strong retail architecture, and abundance of global software vendors in the region. Retailers have seen massive adoption of AI-based solutions, the promise of personalised assortment planning and omnichannel optimisation making it the fastest-growing solution space in the region.
The United States is the undisputed leader, driven by state-of-the-art IT infrastructure, early adoption of the software, and retail chains that make strong investments, especially in analytics-driven category management.
Europe remains a stable category management software market growth due to higher spending on digital transformation by retail segments, aligning data regulations in applications, and a higher inclination towards sustainability and local assortment planning. Local retailers are adopting integrated platforms to improve supply chains and develop cross-border category strategies.
Germany comes at the top of the region, attributed to the established retail base, robust capital goods manufacturing base, and rising trend of using retail analytics to improve in-store and online performance.
The Asia Pacific market is expected to grow the fastest at 13.11% CAGR. As China, India, and Southeast Asia race to digitize their retail sectors, increased e-commerce penetration and IT investments among SMEs and regional players have been priming the pump for software uptake.
China leads the regional pack, supported by its sizable retail ecosystem, government initiatives to drive digital, and strong intelligence retail demands in tier-1 and tier-2 cities, respectively.
Middle East & Africa and Latin America are also experiencing a moderate yet positive growth which can be majorly attributed to retail modernization, smart city initiatives, growing cloud adoption, and more investments in digital tools in every sector, with UAE growing to be the larger market in the Middle East & Africa and Brazil growing to be the larger market in Latin America, respectively.
The major key players of category management software market are Oracle Corp., Aptos, LLC, Board International S.A., INTERACTIVE EDGE, 42 Technologies, Inc., Epicor Software Corp., Softvision, GEP, JAGGAER, DotActiv (Pty) Ltd., and others.
In Dec 2024, the company unveiled JAGGAER One version 24.3, which implements several artificial intelligence-driven features to streamline the procurement lifecycle. The BOM costing and supplier development tools stand out as updates for category management to be smarter and more effective.
In Dec 2023, DotActiv launched its new cloud-based category management software, helping retailers gain new levels of data analytics and planogram automation. This initiative intends to help retailers maximize shelf space and drive category success.
| Report Attributes | Details |
|---|---|
| Market Size in 2024 | USD 2.17 Billion |
| Market Size by 2032 | USD 4.89 Billion |
| CAGR | CAGR of 10.7% From 2025 to 2032 |
| Base Year | 2024 |
| Forecast Period | 2025-2032 |
| Historical Data | 2021-2023 |
| Report Scope & Coverage | Market Size, Segments Analysis, Competitive Landscape, Regional Analysis, DROC & SWOT Analysis, Forecast Outlook |
| Key Segments | •By Component (Solution, Service) •By Deployment (Cloud, On-premise) •By Organization Size (Large Enterprises, SMEs) •By Application (Retail, Distribution, Consumer Packaged Goods) |
| Regional Analysis/Coverage | North America (US, Canada, Mexico), Europe (Germany, France, UK, Italy, Spain, Poland, Turkey, Rest of Europe), Asia Pacific (China, India, Japan, South Korea, Singapore, Australia, Rest of Asia Pacific), Middle East & Africa (UAE, Saudi Arabia, Qatar, South Africa, Rest of Middle East & Africa), Latin America (Brazil, Argentina, Rest of Latin America) |
| Company Profiles | Oracle Corp., Aptos, LLC, Board International S.A., INTERACTIVE EDGE, 42 Technologies, Inc., Epicor Software Corp., Softvision, GEP, JAGGAER, DotActiv (Pty) Ltd. |
Ans: The Category Management Software Market is expected to grow at a CAGR of 10.7% from 2025 to 2032.
Ans: The Category Management Software Market was valued at USD 2.17 billion in 2024.
Ans: The major growth factor is the rising need for data-driven retail optimization to improve profitability and enhance the consumer experience.
Ans: The Solution segment dominated the Category Management Software Market by type in 2024, holding a 63.48% revenue share.
Ans: North America dominated the Category Management Software Market in 2024, capturing a 38.39% market share. This dominance is attributed to the region's advanced digital infrastructure, early adoption of AI-based solutions, and the strong presence of global software vendors.
Table Of Content
1. Introduction
1.1 Market Definition
1.2 Scope (Inclusion and Exclusions)
1.3 Research Assumptions
2. Executive Summary
2.1 Market Overview
2.2 Regional Synopsis
2.3 Competitive Summary
3. Research Methodology
3.1 Top-Down Approach
3.2 Bottom-up Approach
3.3. Data Validation
3.4 Primary Interviews
4. Market Dynamics Impact Analysis
4.1 Market Driving Factors Analysis
4.1.1 Drivers
4.1.2 Restraints
4.1.3 Opportunities
4.1.4 Challenges
4.2 PESTLE Analysis
4.3 Porter’s Five Forces Model
5. Statistical Insights and Trends Reporting
5.1 Time-to-Value (TTV) Metrics
5.2 AI & Automation Utilization Rate
5.3 Carbon or Waste Reduction Metrics
5.4 Training & Adoption Curve
6. Competitive Landscape
6.1 List of Major Companies By Region
6.2 Market Share Analysis By Region
6.3 Product Benchmarking
6.3.1 Product specifications and features
6.3.2 Pricing
6.4 Strategic Initiatives
6.4.1 Marketing and promotional activities
6.4.2 Distribution and Supply Chain Strategies
6.4.3 Expansion plans and new product launches
6.4.4 Strategic partnerships and collaborations
6.5 Technological Advancements
6.6 Market Positioning and Branding
7. Category Management Software Market Segmentation By Component
7.1 Chapter Overview
7.2 Solution
7.2.1 Solution Market Trends Analysis (2020-2032)
7.2.2 Solution Market Size Estimates and Forecasts to 2032 (USD Billion)
7.3 Service
7.3.1 Service Market Trends Analysis (2020-2032)
7.3.2 Service Market Size Estimates and Forecasts to 2032 (USD Billion)
8. Category Management Software Market Segmentation By Deployment
8.1 Chapter Overview
8.2 Cloud
8.2.1 Cloud Market Trends Analysis (2020-2032)
8.2.2 Cloud Market Size Estimates and Forecasts to 2032 (USD Billion)
8.3 On-premise
8.3.1 On-premise Market Trends Analysis (2020-2032)
8.3.2 On-premise Market Size Estimates and Forecasts to 2032 (USD Billion)
9. Category Management Software Market Segmentation By Organization Size
9.1 Chapter Overview
9.2 Large Enterprises
9.2.1 Large Enterprises Market Trends Analysis (2020-2032)
9.2.2 Large Enterprises Market Size Estimates and Forecasts to 2032 (USD Billion)
9.3 SMEs
9.3.1 SMEs Market Trends Analysis (2020-2032)
9.3.2 SMEs Market Size Estimates and Forecasts to 2032 (USD Billion)
10. Category Management Software Market Segmentation By Application
10.1 Chapter Overview
10.2 Retail
10.2.1 Retail Market Trends Analysis (2020-2032)
10.2.2 Retail Market Size Estimates and Forecasts to 2032 (USD Billion)
10.3 Distribution
10.3.1 Distribution Market Trend Analysis (2020-2032)
10.3.2 Distribution Market Size Estimates and Forecasts to 2032 (USD Billion)
10.4 Consumer Packaged Goods
10.4.1 Consumer Packaged Goods Market Trends Analysis (2020-2032)
10.4.2 Consumer Packaged Goods Market Size Estimates and Forecasts to 2032 (USD Billion)
11. Regional Analysis
11.1 Chapter Overview
11.2 North America
11.2.1 Trend Analysis
11.2.2 North America Category Management Software Market Estimates and Forecasts by Country (2020-2032) (USD Billion)
11.2.3 North America Category Management Software Market Estimates and Forecasts By Component (2020-2032) (USD Billion)
11.2.4 North America Category Management Software Market Estimates and Forecasts By Deployment (2020-2032) (USD Billion)
11.2.5 North America Category Management Software Market Estimates and Forecasts By Organization Size (2020-2032) (USD Billion)
11.2.6 North America Category Management Software Market Estimates and Forecasts By Application (2020-2032) (USD Billion)
11.2.7 USA
11.2.7.1 USA Category Management Software Market Estimates and Forecasts By Component (2020-2032) (USD Billion)
11.2.7.2 USA Category Management Software Market Estimates and Forecasts By Deployment (2020-2032) (USD Billion)
11.2.7.3 USA Category Management Software Market Estimates and Forecasts By Organization Size (2020-2032) (USD Billion)
11.2.7.4 USA Category Management Software Market Estimates and Forecasts By Application (2020-2032) (USD Billion)
11.2.8 Canada
11.2.8.1 Canada Category Management Software Market Estimates and Forecasts By Component (2020-2032) (USD Billion)
11.2.8.2 Canada Category Management Software Market Estimates and Forecasts By Deployment (2020-2032) (USD Billion)
11.2.8.3 Canada Category Management Software Market Estimates and Forecasts By Organization Size (2020-2032) (USD Billion)
11.2.8.4 Canada Category Management Software Market Estimates and Forecasts By Application (2020-2032) (USD Billion)
11.2.9 Mexico
11.2.9.1 Mexico Category Management Software Market Estimates and Forecasts By Component (2020-2032) (USD Billion)
11.2.9.2 Mexico Category Management Software Market Estimates and Forecasts By Deployment (2020-2032) (USD Billion)
11.2.9.3 Mexico Category Management Software Market Estimates and Forecasts By Organization Size (2020-2032) (USD Billion)
11.2.9.4 Mexico Category Management Software Market Estimates and Forecasts By Application (2020-2032) (USD Billion)
11.3 Europe
11.3.1 Trend Analysis
11.3.2 Europe Category Management Software Market Estimates and Forecasts by Country (2020-2032) (USD Billion)
11.3.3 Europe Category Management Software Market Estimates and Forecasts By Component (2020-2032) (USD Billion)
11.3.4 Europe Category Management Software Market Estimates and Forecasts By Deployment (2020-2032) (USD Billion)
11.3.5 Europe Category Management Software Market Estimates and Forecasts By Organization Size (2020-2032) (USD Billion)
11.3.6 Europe Category Management Software Market Estimates and Forecasts By Application (2020-2032) (USD Billion)
11.3.7 Germany
11.3.7.1 Germany Category Management Software Market Estimates and Forecasts By Component (2020-2032) (USD Billion)
11.3.7.2 Germany Category Management Software Market Estimates and Forecasts By Deployment (2020-2032) (USD Billion)
11.3.7.3 Germany Category Management Software Market Estimates and Forecasts By Organization Size (2020-2032) (USD Billion)
11.3.7.4 Germany Category Management Software Market Estimates and Forecasts By Application (2020-2032) (USD Billion)
11.3.8 France
11.3.8.1 France Category Management Software Market Estimates and Forecasts By Component (2020-2032) (USD Billion)
11.3.8.2 France Category Management Software Market Estimates and Forecasts By Deployment (2020-2032) (USD Billion)
11.3.8.3 France Category Management Software Market Estimates and Forecasts By Organization Size (2020-2032) (USD Billion)
11.3.8.4 France Category Management Software Market Estimates and Forecasts By Application (2020-2032) (USD Billion)
11.3.9 UK
11.3.9.1 UK Category Management Software Market Estimates and Forecasts By Component (2020-2032) (USD Billion)
11.3.9.2 UK Category Management Software Market Estimates and Forecasts By Deployment (2020-2032) (USD Billion)
11.3.9.3 UK Category Management Software Market Estimates and Forecasts By Organization Size (2020-2032) (USD Billion)
11.3.9.4 UK Category Management Software Market Estimates and Forecasts By Application (2020-2032) (USD Billion)
11.3.10 Italy
11.3.10.1 Italy Category Management Software Market Estimates and Forecasts By Component (2020-2032) (USD Billion)
11.3.10.2 Italy Category Management Software Market Estimates and Forecasts By Deployment (2020-2032) (USD Billion)
11.3.10.3 Italy Category Management Software Market Estimates and Forecasts By Organization Size (2020-2032) (USD Billion)
11.3.10.4 Italy Category Management Software Market Estimates and Forecasts By Application (2020-2032) (USD Billion)
11.3.11 Spain
11.3.11.1 Spain Category Management Software Market Estimates and Forecasts By Component (2020-2032) (USD Billion)
11.3.11.2 Spain Category Management Software Market Estimates and Forecasts By Deployment (2020-2032) (USD Billion)
11.3.11.3 Spain Category Management Software Market Estimates and Forecasts By Organization Size (2020-2032) (USD Billion)
11.3.11.4 Spain Category Management Software Market Estimates and Forecasts By Application (2020-2032) (USD Billion)
11.3.12 Poland
11.3.12.1 Poland Category Management Software Market Estimates and Forecasts By Component (2020-2032) (USD Billion)
11.3.12.2 Poland Category Management Software Market Estimates and Forecasts By Deployment (2020-2032) (USD Billion)
11.3.12.3 Poland Category Management Software Market Estimates and Forecasts By Organization Size (2020-2032) (USD Billion)
11.3.12.4 Poland Category Management Software Market Estimates and Forecasts By Application (2020-2032) (USD Billion)
11.3.13 Turkey
11.3.13.1 Turkey Category Management Software Market Estimates and Forecasts By Component (2020-2032) (USD Billion)
11.3.13.2 Turkey Category Management Software Market Estimates and Forecasts By Deployment (2020-2032) (USD Billion)
11.3.13.3 Turkey Category Management Software Market Estimates and Forecasts By Organization Size (2020-2032) (USD Billion)
11.3.13.4 Turkey Category Management Software Market Estimates and Forecasts By Application (2020-2032) (USD Billion)
11.3.14 Rest of Europe
11.3.14.1 Rest of Europe Category Management Software Market Estimates and Forecasts By Component (2020-2032) (USD Billion)
11.3.14.2 Rest of Europe Category Management Software Market Estimates and Forecasts By Deployment (2020-2032) (USD Billion)
11.3.14.3 Rest of Europe Category Management Software Market Estimates and Forecasts By Organization Size (2020-2032) (USD Billion)
11.3.14.4 Rest of Europe Category Management Software Market Estimates and Forecasts By Application (2020-2032) (USD Billion)
11.4 Asia Pacific
11.4.1 Trend Analysis
11.4.2 Asia Pacific Category Management Software Market Estimates and Forecasts by Country (2020-2032) (USD Billion)
11.4.3 Asia Pacific Category Management Software Market Estimates and Forecasts By Component (2020-2032) (USD Billion)
11.4.4 Asia Pacific Category Management Software Market Estimates and Forecasts By Deployment (2020-2032) (USD Billion)
11.4.5 Asia Pacific Category Management Software Market Estimates and Forecasts By Organization Size (2020-2032) (USD Billion)
11.4.6 Asia Pacific Category Management Software Market Estimates and Forecasts By Application (2020-2032) (USD Billion)
11.4.7 China
11.4.7.1 China Category Management Software Market Estimates and Forecasts By Component (2020-2032) (USD Billion)
11.4.7.2 China Category Management Software Market Estimates and Forecasts By Deployment (2020-2032) (USD Billion)
11.4.7.3 China Category Management Software Market Estimates and Forecasts By Organization Size (2020-2032) (USD Billion)
11.4.7.4 China Category Management Software Market Estimates and Forecasts By Application (2020-2032) (USD Billion)
11.4.8 India
11.4.8.1 India Category Management Software Market Estimates and Forecasts By Component (2020-2032) (USD Billion)
11.4.8.2 India Category Management Software Market Estimates and Forecasts By Deployment (2020-2032) (USD Billion)
11.4.8.3 India Category Management Software Market Estimates and Forecasts By Organization Size (2020-2032) (USD Billion)
11.4.8.4 India Category Management Software Market Estimates and Forecasts By Application (2020-2032) (USD Billion)
11.4.9 Japan
11.4.9.1 Japan Category Management Software Market Estimates and Forecasts By Component (2020-2032) (USD Billion)
11.4.9.2 Japan Category Management Software Market Estimates and Forecasts By Deployment (2020-2032) (USD Billion)
11.4.9.3 Japan Category Management Software Market Estimates and Forecasts By Organization Size (2020-2032) (USD Billion)
11.4.9.4 Japan Category Management Software Market Estimates and Forecasts By Application (2020-2032) (USD Billion)
11.4.10 South Korea
11.4.10.1 South Korea Category Management Software Market Estimates and Forecasts By Component (2020-2032) (USD Billion)
11.4.10.2 South Korea Category Management Software Market Estimates and Forecasts By Deployment (2020-2032) (USD Billion)
11.4.10.3 South Korea Category Management Software Market Estimates and Forecasts By Organization Size (2020-2032) (USD Billion)
11.4.10.4 South Korea Category Management Software Market Estimates and Forecasts By Application (2020-2032) (USD Billion)
11.4.11 Singapore
11.4.11.1 Singapore Category Management Software Market Estimates and Forecasts By Component (2020-2032) (USD Billion)
11.4.11.2 Singapore Category Management Software Market Estimates and Forecasts By Deployment (2020-2032) (USD Billion)
11.4.11.3 Singapore Category Management Software Market Estimates and Forecasts By Organization Size (2020-2032) (USD Billion)
11.4.11.4 Singapore Category Management Software Market Estimates and Forecasts By Application (2020-2032) (USD Billion)
11.4.12 Australia
11.4.12.1 Australia Category Management Software Market Estimates and Forecasts By Component (2020-2032) (USD Billion)
11.4.12.2 Australia Category Management Software Market Estimates and Forecasts By Deployment (2020-2032) (USD Billion)
11.4.12.3 Australia Category Management Software Market Estimates and Forecasts By Organization Size (2020-2032) (USD Billion)
11.4.12.4 Australia Category Management Software Market Estimates and Forecasts By Application (2020-2032) (USD Billion)
11.4.13 Rest of Asia Pacific
11.4.13.1 Rest of Asia Pacific Category Management Software Market Estimates and Forecasts By Component (2020-2032) (USD Billion)
11.4.13.2 Rest of Asia Pacific Category Management Software Market Estimates and Forecasts By Deployment (2020-2032) (USD Billion)
11.4.13.3 Rest of Asia Pacific Category Management Software Market Estimates and Forecasts By Organization Size (2020-2032) (USD Billion)
11.4.13.4 Rest of Asia Pacific Category Management Software Market Estimates and Forecasts By Application (2020-2032) (USD Billion)
11.5 Middle East and Africa
11.5.1 Trend Analysis
11.5.2 Middle East and Africa Category Management Software Market Estimates and Forecasts by Country (2020-2032) (USD Billion)
11.5.3 Middle East and Africa Category Management Software Market Estimates and Forecasts By Component (2020-2032) (USD Billion)
11.5.4 Middle East and Africa Category Management Software Market Estimates and Forecasts By Deployment (2020-2032) (USD Billion)
11.5.5 Middle East and Africa Category Management Software Market Estimates and Forecasts By Organization Size (2020-2032) (USD Billion)
11.5.6 Middle East and Africa Category Management Software Market Estimates and Forecasts By Application (2020-2032) (USD Billion)
11.5.7 UAE
11.5.7.1 UAE Category Management Software Market Estimates and Forecasts By Component (2020-2032) (USD Billion)
11.5.7.2 UAE Category Management Software Market Estimates and Forecasts By Deployment (2020-2032) (USD Billion)
11.5.7.3 UAE Category Management Software Market Estimates and Forecasts By Organization Size (2020-2032) (USD Billion)
11.5.7.4 UAE Category Management Software Market Estimates and Forecasts By Application (2020-2032) (USD Billion)
11.5.8 Saudi Arabia
11.5.8.1 Saudi Arabia Category Management Software Market Estimates and Forecasts By Component (2020-2032) (USD Billion)
11.5.8.2 Saudi Arabia Category Management Software Market Estimates and Forecasts By Deployment (2020-2032) (USD Billion)
11.5.8.3 Saudi Arabia Category Management Software Market Estimates and Forecasts By Organization Size (2020-2032) (USD Billion)
11.5.8.4 Saudi Arabia Category Management Software Market Estimates and Forecasts By Application (2020-2032) (USD Billion)
11.5.1.9 Qatar
11.5.9.1 Qatar Category Management Software Market Estimates and Forecasts By Component (2020-2032) (USD Billion)
11.5.9.2 Qatar Category Management Software Market Estimates and Forecasts By Deployment (2020-2032) (USD Billion)
11.5.9.3 Qatar Category Management Software Market Estimates and Forecasts By Organization Size (2020-2032) (USD Billion)
11.5.1.9.4 Qatar Category Management Software Market Estimates and Forecasts By Application (2020-2032) (USD Billion)
11.5.10 South Africa
11.5.10.1 South Africa Category Management Software Market Estimates and Forecasts By Component (2020-2032) (USD Billion)
11.5.10.2 South Africa Category Management Software Market Estimates and Forecasts By Deployment (2020-2032) (USD Billion)
11.5.10.3 South Africa Category Management Software Market Estimates and Forecasts By Organization Size (2020-2032) (USD Billion)
11.5.10.4 South Africa Category Management Software Market Estimates and Forecasts By Application (2020-2032) (USD Billion)
11.5.11 Rest of Middle East & Africa
11.5.11.1 Rest of Middle East & Africa Category Management Software Market Estimates and Forecasts By Component (2020-2032) (USD Billion)
11.5.11.2 Rest of Middle East & Africa Category Management Software Market Estimates and Forecasts By Deployment (2020-2032) (USD Billion)
11.5.11.3 Rest of Middle East & Africa Category Management Software Market Estimates and Forecasts By Organization Size (2020-2032) (USD Billion)
11.5.11.4 Rest of Middle East & Africa Category Management Software Market Estimates and Forecasts By Application (2020-2032) (USD Billion)
11.6 Latin America
11.6.1 Trend Analysis
11.6.2 Latin America Category Management Software Market Estimates and Forecasts by Country (2020-2032) (USD Billion)
11.6.3 Latin America Category Management Software Market Estimates and Forecasts By Component (2020-2032) (USD Billion)
11.6.4 Latin America Category Management Software Market Estimates and Forecasts By Deployment (2020-2032) (USD Billion)
11.6.5 Latin America Category Management Software Market Estimates and Forecasts By Organization Size (2020-2032) (USD Billion)
11.6.6 Latin America Category Management Software Market Estimates and Forecasts By Application (2020-2032) (USD Billion)
11.6.7 Brazil
11.6.7.1 Brazil Category Management Software Market Estimates and Forecasts By Component (2020-2032) (USD Billion)
11.6.7.2 Brazil Category Management Software Market Estimates and Forecasts By Deployment (2020-2032) (USD Billion)
11.6.7.3 Brazil Category Management Software Market Estimates and Forecasts By Organization Size (2020-2032) (USD Billion)
11.6.7.4 Brazil Category Management Software Market Estimates and Forecasts By Application (2020-2032) (USD Billion)
11.6.8 Argentina
11.6.8.1 Argentina Category Management Software Market Estimates and Forecasts By Component (2020-2032) (USD Billion)
11.6.8.2 Argentina Category Management Software Market Estimates and Forecasts By Deployment (2020-2032) (USD Billion)
11.6.8.3 Argentina Category Management Software Market Estimates and Forecasts By Organization Size (2020-2032) (USD Billion)
11.6.8.4 Argentina Category Management Software Market Estimates and Forecasts By Application (2020-2032) (USD Billion)
11.6.9 Rest of Latin America
11.6.9.1 Rest of Latin America Category Management Software Market Estimates and Forecasts By Component (2020-2032) (USD Billion)
11.6.9.2 Rest of Latin America Category Management Software Market Estimates and Forecasts By Deployment (2020-2032) (USD Billion)
11.6.9.3 Rest of Latin America Category Management Software Market Estimates and Forecasts By Organization Size (2020-2032) (USD Billion)
11.6.9.4 Rest of Latin America Category Management Software Market Estimates and Forecasts By Application (2020-2032) (USD Billion)
12. Company Profiles
12.1 Oracle Corp.
12.1.1 Company Overview
12.1.2 Financial
12.1.3 Products/ Services Offered
12.1.4 SWOT Analysis
12.2 Aptos, LLC
12.2.1 Company Overview
12.2.2 Financial
12.2.3 Products/ Services Offered
12.2.4 SWOT Analysis
12.3 Board International S.A.
12.3.1 Company Overview
12.3.2 Financial
12.3.3 Products/ Services Offered
12.3.4 SWOT Analysis
12.4 INTERACTIVE EDGE
12.4.1 Company Overview
12.4.2 Financial
12.4.3 Products/ Services Offered
12.4.4 SWOT Analysis
12.5 42 Technologies, Inc.
12.5.1 Company Overview
12.5.2 Financial
12.5.3 Products/ Services Offered
12.5.4 SWOT Analysis
12.6 Epicor Software Corp.
12.6.1 Company Overview
12.6.2 Financial
12.6.3 Products/ Services Offered
12.6.4 SWOT Analysis
12.7 Softvision
12.7.1 Company Overview
12.7.2 Financial
12.7.3 Products/ Services Offered
12.7.4 SWOT Analysis
12.8 GEP
12.8.1 Company Overview
12.8.2 Financial
12.8.3 Products/ Services Offered
12.8.4 SWOT Analysis
12.9 JAGGAER
12.9.1 Company Overview
12.9.2 Financial
12.9.3 Products/ Services Offered
12.9.4 SWOT Analysis
12.10 DotActiv (Pty) Ltd.
12.10.1 Company Overview
12.10.2 Financial
12.10.3 Products/ Services Offered
12.10.4 SWOT Analysis
13. Use Cases and Best Practices
14. Conclusion
An accurate research report requires proper strategizing as well as implementation. There are multiple factors involved in the completion of good and accurate research report and selecting the best methodology to compete the research is the toughest part. Since the research reports we provide play a crucial role in any company’s decision-making process, therefore we at SNS Insider always believe that we should choose the best method which gives us results closer to reality. This allows us to reach at a stage wherein we can provide our clients best and accurate investment to output ratio.
Each report that we prepare takes a timeframe of 350-400 business hours for production. Starting from the selection of titles through a couple of in-depth brain storming session to the final QC process before uploading our titles on our website we dedicate around 350 working hours. The titles are selected based on their current market cap and the foreseen CAGR and growth.
The 5 steps process:
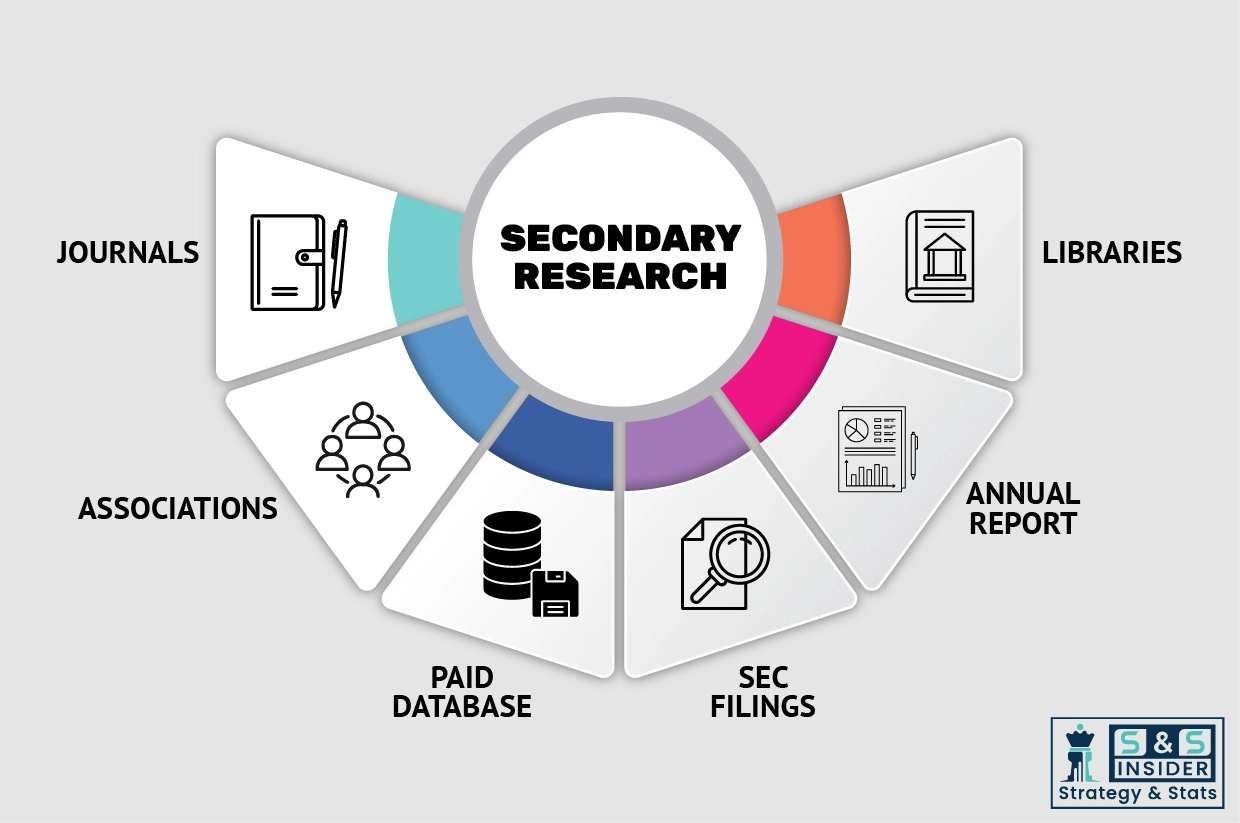
Step 1: Secondary Research:
Secondary Research or Desk Research is as the name suggests is a research process wherein, we collect data through the readily available information. In this process we use various paid and unpaid databases which our team has access to and gather data through the same. This includes examining of listed companies’ annual reports, Journals, SEC filling etc. Apart from this our team has access to various associations across the globe across different industries. Lastly, we have exchange relationships with various university as well as individual libraries.
Step 2: Primary Research
When we talk about primary research, it is a type of study in which the researchers collect relevant data samples directly, rather than relying on previously collected data. This type of research is focused on gaining content specific facts that can be sued to solve specific problems. Since the collected data is fresh and first hand therefore it makes the study more accurate and genuine.
We at SNS Insider have divided Primary Research into 2 parts.
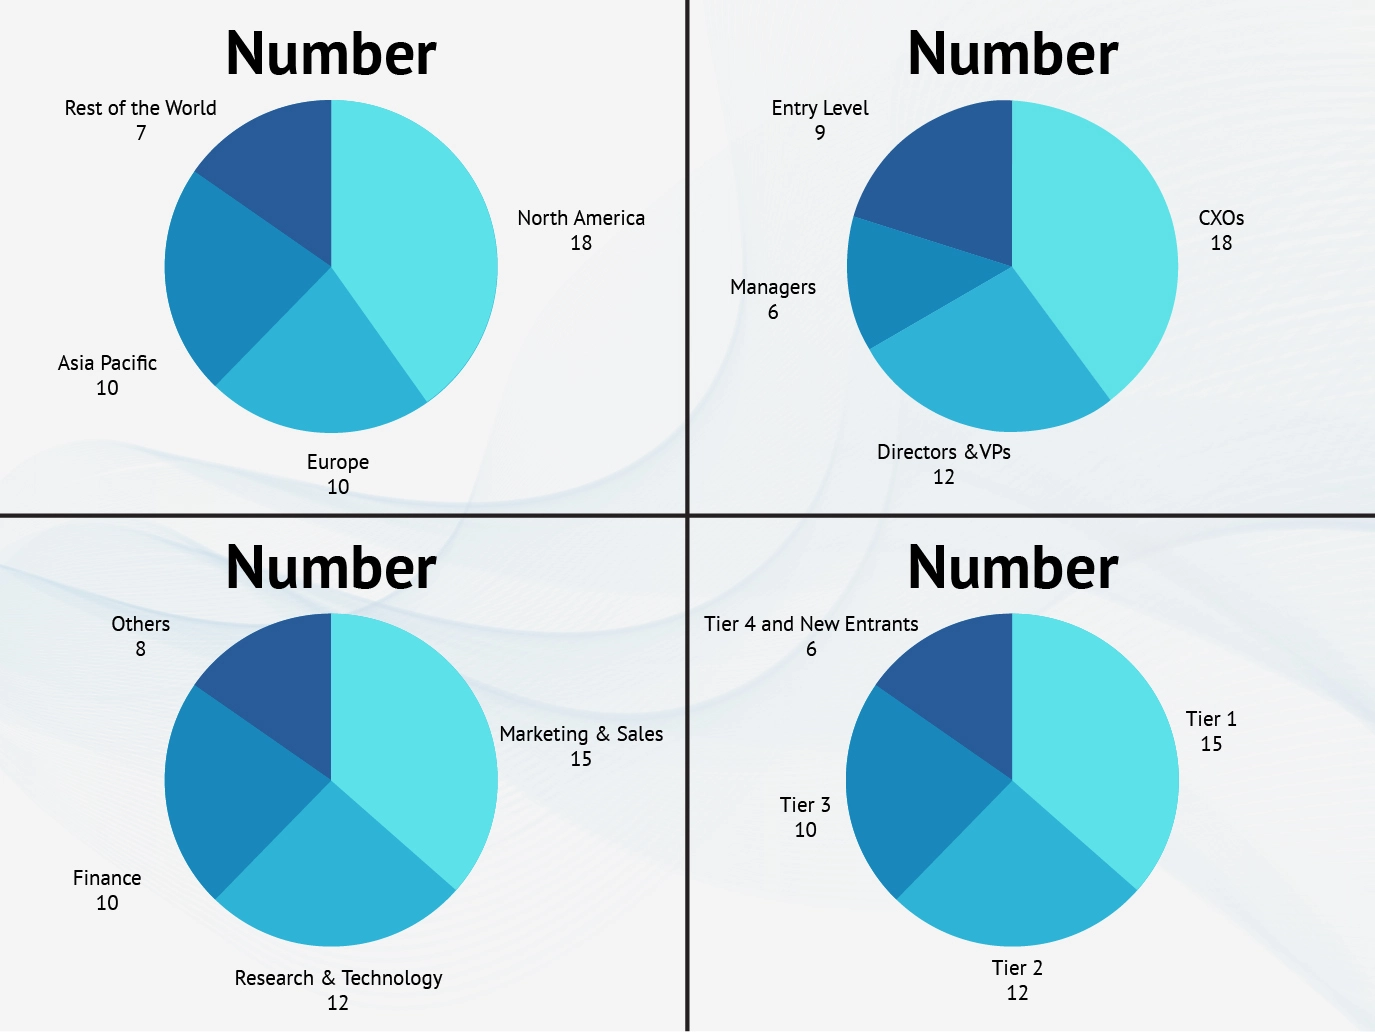
Part 1 wherein we interview the KOLs of major players as well as the upcoming ones across various geographic regions. This allows us to have their view over the market scenario and acts as an important tool to come closer to the accurate market numbers. As many as 45 paid and unpaid primary interviews are taken from both the demand and supply side of the industry to make sure we land at an accurate judgement and analysis of the market.
This step involves the triangulation of data wherein our team analyses the interview transcripts, online survey responses and observation of on filed participants. The below mentioned chart should give a better understanding of the part 1 of the primary interview.
Part 2: In this part of primary research the data collected via secondary research and the part 1 of the primary research is validated with the interviews from individual consultants and subject matter experts.
Consultants are those set of people who have at least 12 years of experience and expertise within the industry whereas Subject Matter Experts are those with at least 15 years of experience behind their back within the same space. The data with the help of two main processes i.e., FGDs (Focused Group Discussions) and IDs (Individual Discussions). This gives us a 3rd party nonbiased primary view of the market scenario making it a more dependable one while collation of the data pointers.
Step 3: Data Bank Validation
Once all the information is collected via primary and secondary sources, we run that information for data validation. At our intelligence centre our research heads track a lot of information related to the market which includes the quarterly reports, the daily stock prices, and other relevant information. Our data bank server gets updated every fortnight and that is how the information which we collected using our primary and secondary information is revalidated in real time.

Step 4: QA/QC Process
After all the data collection and validation our team does a final level of quality check and quality assurance to get rid of any unwanted or undesired mistakes. This might include but not limited to getting rid of the any typos, duplication of numbers or missing of any important information. The people involved in this process include technical content writers, research heads and graphics people. Once this process is completed the title gets uploader on our platform for our clients to read it.
Step 5: Final QC/QA Process:
This is the last process and comes when the client has ordered the study. In this process a final QA/QC is done before the study is emailed to the client. Since we believe in giving our clients a good experience of our research studies, therefore, to make sure that we do not lack at our end in any way humanly possible we do a final round of quality check and then dispatch the study to the client.
Key Segments:
By Component
Solution
Service
By Deployment
Cloud
On-premise
By Organization Size
Large Enterprises
SMEs
By Application
Retail
Distribution
Consumer Packaged Goods
Request for Segment Customization as per your Business Requirement: Segment Customization Request
Regional Coverage:
North America
US
Canada
Mexico
Europe
Germany
France
UK
Italy
Spain
Poland
Turkey
Rest of Europe
Asia Pacific
China
India
Japan
South Korea
Singapore
Australia
Rest of Asia Pacific
Middle East & Africa
UAE
Saudi Arabia
Qatar
South Africa
Rest of Middle East & Africa
Latin America
Brazil
Argentina
Rest of Latin America
Request for Country Level Research Report: Country Level Customization Request
Available Customization
With the given market data, SNS Insider offers customization as per the company’s specific needs. The following customization options are available for the report:
Detailed Volume Analysis
Criss-Cross segment analysis (e.g. Product X Application)
Competitive Product Benchmarking
Geographic Analysis
Additional countries in any of the regions
Customized Data Representation
Detailed analysis and profiling of additional market players