Digital Map Market Size & Overview:
To Get More Information on Digital Map Market - Request Sample Report
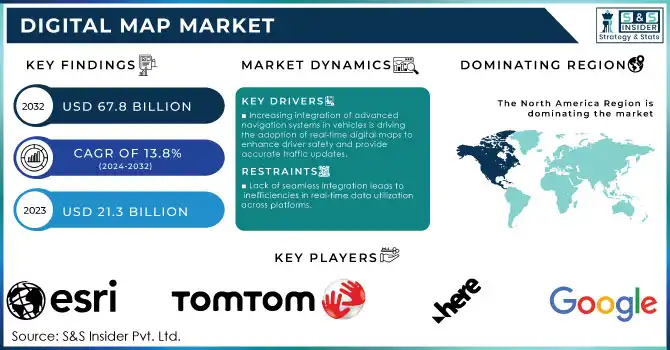
The Digital Map Market was valued at USD 21.3 billion in 2023 and is expected to reach USD 67.8 billion by 2032, growing at a CAGR of 13.8% over the forecast period 2024-2032.
The digital map market is driven by the rapid adoption of geospatial technologies and government initiatives for smart infrastructure development. According to the United Nations Geospatial Information Section (UN-GGIM), over 85% of the world’s nations have prioritized geospatial data in their development strategies as of 2023. The European Union reported that its 2023 allocation of €8 billion for the Copernicus Earth Observation Programme emphasizes the significance of geospatial intelligence for climate monitoring and urban planning. In the U.S., the Department of Transportation’s 2023 budget allocated $1.5 billion for integrating Geographic Information Systems (GIS) in route optimization and infrastructure monitoring. Additionally, global urbanization trends fuel demand for digital mapping technologies, with urban areas accounting for 56% of the global population in 2023, per UN estimates. The Asia-Pacific region, led by China and India, has embraced digital maps for urban expansion, with India launching the National Mapping Policy in 2023 to encourage private-sector participation. These government-backed measures, coupled with advancements in AI-driven map analytics, underline the growing reliance on digital mapping solutions across industries.
The digital map industry is rapidly integrating geomatics systems like GPS and imagery, with major players focusing on developing multi-platform applications. The automotive sector has been a key driver, utilizing digital mapping for self-driving cars, logistics control, fleet management, and Advanced Driver Assistance Systems (ADAS). Initiatives like the OneMap Alliance by HERE Technologies and its Asia-Pacific partners aim to create a unified global mapping system. Digital maps offer greater accuracy and update flexibility compared to printed maps, forming the backbone of geospatial technologies like GPS, GIS, geofencing, and geocoding. Digital map development involves significant investment in sensors and data collection technologies, and niche application providers leveraging innovative techniques are thriving. Companies are focusing on strategic alliances and technological advancements to enhance their offerings. For instance, in January 2023, HERE Technologies launched UniMap, an automated mapping system that integrates SD, ADAS, and HD maps into a unified digital format, improving map quality, coverage, and data processing efficiency. These developments are accelerating the growth of the digital map market.
Market dynamics
Drivers
-
Increasing integration of advanced navigation systems in vehicles is driving the adoption of real-time digital maps to enhance driver safety and provide accurate traffic updates.
-
Autonomous driving technologies rely heavily on high-definition maps, accelerating the demand for precise and dynamic mapping solutions.
-
The growing use of Internet of Things (IoT) devices has increased the need for geospatial data, supporting real-time tracking and monitoring solutions.
-
Connected devices such as smartphones and wearables are fostering demand for indoor and outdoor mapping services, aiding location-based applications.
The rapid adoption of advanced navigation systems in the automotive industry has been one of the key factors contributing the growth of the digital map market. Modern navigation technologies have evolved to encompass far more than just basic directions they incorporate live traffic data, lane-level accuracy, and predictive routes. This has become a necessity as automotive companies continue to deliver connected and autonomous vehicles (CAVs).
For example, autonomous driving needs HD (high-definition) maps, with very high-precision road networks, traffic patterns, and infrastructure data. As highlighted by the latest Industry Insights, high-definition (HD) maps are an indispensable tool for companies like Tesla and Waymo, leveraging HD maps for performing functionality like autopilot or full self-driving. Also, partnerships between automakers and firms that specialize in digital mapping, say BMW with HERE Technologies, is making real-time map updates based on IoT sensors embedded into vehicles more efficient. Governments are also supporting connected vehicle initiatives in parts of Europe and North America, indirectly aiding the growth of real-time digital mapping. According to a recent report, more than 60% of 2023 new vehicles sold in these markets were sold with connected navigation systems integrated into the vehicle, using high-definition maps in many of them to function properly. Also, growing interest in EVs (electric vehicles) has increased the requirement for maps tailored to EV route planning. These navigation systems provide options for drivers by adding features such as EV charging station locators and dynamic range estimations. This trend is expected to expand as global EV adoption continues to rise.
Restraints
-
Challenges in merging traditional mapping systems with modern Geographic Information System (GIS) technologies create compatibility issues.
-
Lack of seamless integration leads to inefficiencies in real-time data utilization across platforms.
-
Increasing use of location-based services raises privacy concerns, particularly with unauthorized data access and surveillance risks.
The integration of conventional mapping with advanced Geographic Information System (GIS) technologies is one major constraint in the digital mapping market. However, traditional mapping formats are static and real-time unfit for modern applications such as autonomous vehicles and advanced navigation systems. Addressing this gap necessitates major technology modifications, from data normalization to interoperability improvements, which often require significant investment and time.
Furthermore, inconsistencies in data formats and legacy systems hinder seamless adoption across industries. For instance, integrating traditional cartographic maps into real-time GIS platforms can result in reduced accuracy or data redundancy, impacting decision-making processes. These challenges can slow down the deployment of innovative mapping solutions, particularly in industries reliant on high-precision data such as transportation and logistics. Addressing these issues demands a concerted effort to develop interoperable platforms and industry standards, but progress has been slow due to diverse technological ecosystems.
Segment Analysis
By Services:
The digital map market was dominated by development and integration services, accounting for more than 68% of the total market in 2023, owing to the increasing need for tailored mapping solutions for transportation, logistics, and urban planning processes. To meet the needs of diverse regions, governments have fast-tracked creating bespoke mapping tools. As an example, the Indian Space Research Organization (ISRO) indicated in 2023 that 40% of maps based on its satellites relate to specific agricultural and environmental management needs necessitating tailored integration.
According to the 2023 Digital Economy Report prepared by the U.S. Department of Commerce,70% of digital map projects featured integration with IoT devices and artificial intelligence-based analytic tools. These integration services are important in connecting the geospatial data with the transportation management systems so that they can be updated in real-time terms. Also, Europe highlighted the urgent need for its integrated map systems for cross-border logistics in its new Digital Decade Initiative, dedicating €1.2 billion in 2023 to optimize supply chains within the region. These government-driven initiatives also constitute the basis for the growing momentum around development and integration services.
By Type:
Geographic Information Systems (GIS), which captured 38% of the market, in 2023, as they are widely used in urban planning, resource management, and disaster response. Around the world, governments are using GIS for the sustainable development goals (SDGs). GIS tools helped to discover more than 15,000 ecosystems at risk around the world, as highlighted in 2023 by the United Nations Environment Programme (UNEP).
In 2023 the U.S. Federal Emergency Management Agency (FEMA) used $2 billion for GIS-fuelled flood risk mapping reducing disaster response time by 40%. GIS is the backbone of the European Green Deal where €3 billion is allocated for mapping biodiversity in the year 2023. GIS is also being adopted by emerging economies such as Brazil and Indonesia for tracking deforestation and planning reforestation. These efforts showcase the impact of GIS for environmental sustainability and planning purposes.
By Application
Routing and navigation is the largest application segment of the digital map market with a 49% share in 2023 owing to the increasing adoption of mobility services and autonomous vehicle navigation. According to the European Commission's report for the year 2023, 85% of all logistics companies in the EU depend on real-time navigational systems with electronic maps. In the U.S., GPS-enabled navigation cut delivery times by 25% and saved $10 billion in logistics costs in 2023 according to the Bureau of Transportation Statistics.
Government initiatives for smart cities further support this trend. China's latest 2023 Smart City Pilot Program leveraged routing solutions in public transportation systems across 100 cities, serving more than 200 million daily commuters. For instance, the increasing adoption of electric vehicles (EVs) is demanding an enhanced navigation system to find charging stations, which is propelling the growth of the segment.
By End Use:
The automotive sector held a 39% market share in the digital map market in 2023, driven by innovations in connected and autonomous vehicles. According to the International Energy Agency (IEA), more than 14 million EVs were sold in 2023 of which 70% are integrated with digital mapping systems for navigation and traffic control.
Digital Mapping is a top priority in automotive strategies among governments around the globe as an example, Germany's 2023 Automotive Digital Transformation Initiative committed €5 billion to the inclusion of HD maps in cars. Japan also announced a $2 billion program in 2023 to use digital mapping to improve road safety and have self-driving cars. All of these efforts underline the importance of digital maps for automotive innovation.
Regional Analysis:
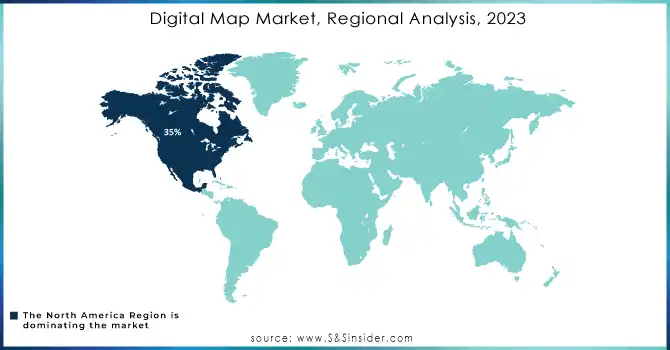
North America dominated the digital map market and held 35% of the global digital map market in 2023. This dominance is a result of the high adoption of Geographic Information Systems (GIS) and sophisticated navigation technology in several sectors. However, a large share of this growth was spurred by the U.S. government through its $10 billion investment in smart infrastructure development projects throughout 2023. As a supplement, these initiatives facilitated the adoption of digital mapping solutions taking root in transportation networks, urban planning, and disaster management systems, thereby establishing a strong infrastructure for the adoption of disruptive technologies. Additionally, Canada’s focus on environmental monitoring and resource management further fueled the demand for digital mapping applications in the region.
In contrast, the Asia-Pacific region growing with the fastest CAGR in the digital map market. The growth comes primarily on the back of rapid developments in urban areas, growing transportation connections, and government policies favourable to this growth. China has dedicated $15 billion in its 14th Five-Year Plan to geospatial technology advancement, emphasizing public infrastructure modernization and smart city solutions. Likewise, the National Mapping Policy released in India in 2023 encourages participation from the private sector and supports the use of complex mapping technologies in the fields of – agriculture, logistics, and urban development. It held a 28 percent share of the global market in 2023 and is estimated to gain substantial growth on the back of rising investment in smart infrastructure and increasing demand for location-based services in various sectors across the region.
Do You Need any Customization Research on Digital Map Market - Enquire Now
Key Players
Service Providers / Manufacturers:
-
Google LLC (Google Maps, Street View)
-
HERE Technologies (HERE WeGo, HERE HD Live Map)
-
TomTom International BV (TomTom GO, TomTom AmiGO)
-
Esri (ArcGIS Online, ArcGIS Pro)
-
Mapbox (Mapbox Studio, Mapbox Navigation SDK)
-
Maxar Technologies (Vivid Standard, Precision3D)
-
Digital Map Products, Inc. (LandVision, GovClarity)
-
OpenStreetMap Foundation (OSM Editor Tools, OSM Data Platform)
-
Lepton Software (SmartMaps, Mapytics)
-
ThinkGeo LLC (Map Suite, ThinkGeo Cloud)
Key Users
-
Uber Technologies Inc.
-
Lyft, Inc.
-
Apple Inc.
-
Amazon.com, Inc.
-
Microsoft Corporation
-
Tesla, Inc.
-
DHL International GmbH
-
FedEx Corporation
-
Airbnb, Inc.
-
Baidu, Inc.
Recent Developments:
-
In April 2024, TomTom collaborated with Microsoft to integrate its mapping expertise into Azure Maps, enhancing location-based services and geospatial analytics with accurate and real-time data. This partnership supports TomTom’s expansion into cloud computing and enterprise solutions.
-
January 2024: The European Commission launched the Digital Mapping for Climate Resilience Initiative, investing €1.5 billion to monitor climate-related risks using GIS.
| Report Attributes | Details |
| Market Size in 2023 | USD 21.3 billion |
| Market Size by 2032 | USD 67.8 billion |
| CAGR | CAGR of 13.8 % From 2024 to 2032 |
| Base Year | 2023 |
| Forecast Period | 2024-2032 |
| Historical Data | 2020-2022 |
| Report Scope & Coverage | Market Size, Segments Analysis, Competitive Landscape, Regional Analysis, DROC & SWOT Analysis, Forecast Outlook |
| Key Segments | • By Type (Geographic Information System (GIS), LiDAR, Digital Orthophotography, Aerial Photography, Global Positioning System (GPS)) • By Mapping Type (Indoor, Outdoor, Metaverse) • By Service (Consulting, Development & Integration, Support & maintenance) • By Application (Asset Tracking, Geo-positioning and Geocoding, Routing and Navigation, Others) • By End-use (Automotive, Military & Defense, Mobile Devices, Enterprise Solutions, Logistics, Travel, and Transportation, Infrastructure Development and Construction, Others) |
| Regional Analysis/Coverage | North America (US, Canada, Mexico), Europe (Eastern Europe [Poland, Romania, Hungary, Turkey, Rest of Eastern Europe] Western Europe] Germany, France, UK, Italy, Spain, Netherlands, Switzerland, Austria, Rest of Western Europe]), Asia Pacific (China, India, Japan, South Korea, Vietnam, Singapore, Australia, Rest of Asia Pacific), Middle East & Africa (Middle East [UAE, Egypt, Saudi Arabia, Qatar, Rest of Middle East], Africa [Nigeria, South Africa, Rest of Africa], Latin America (Brazil, Argentina, Colombia Rest of Latin America) |
| Company Profiles |
Google LLC, HERE Technologies, TomTom International BV, Esri, Mapbox, Maxar Technologies, Digital Map Products, Inc., OpenStreetMap Foundation, Lepton Software, ThinkGeo LLC. |
| Key Drivers | •Increasing integration of advanced navigation systems in vehicles is driving the adoption of real-time digital maps to enhance driver safety and provide accurate traffic updates. •Autonomous driving technologies rely heavily on high-definition maps, accelerating the demand for precise and dynamic mapping solutions. •The growing use of Internet of Things (IoT) devices has increased the need for geospatial data, supporting real-time tracking and monitoring solutions. •Connected devices such as smartphones and wearables are fostering demand for indoor and outdoor mapping services, aiding location-based applications. |
| Market Restraints | •Challenges in merging traditional mapping systems with modern Geographic Information System (GIS) technologies create compatibility issues. •Lack of seamless integration leads to inefficiencies in real-time data utilization across platforms. •Increasing use of location-based services raises privacy concerns, particularly with unauthorized data access and surveillance risks. |
Frequently Asked Questions
Ans: The Asia Pacific region is expected to experience the highest growth in the Digital Map Market during the forecast period
Ans: The market is expected to grow to USD 67.8 billion by the forecast period of 2032.
Ans: Yes, you can buy reports in bulk quantity as per your requirements. Check Here for more details.
Ans. The CAGR of the Digital Map Market for the forecast period 2024-2032 is 13.8%.
Ans. The major players are Google LLC, HERE Technologies, TomTom International BV, Esri, Mapbox, Maxar Technologies, Digital Map Products, Inc., OpenStreetMap Foundation, Lepton Software, ThinkGeo LLC.
Get in Touch
