Chatbot Market Key Insights:
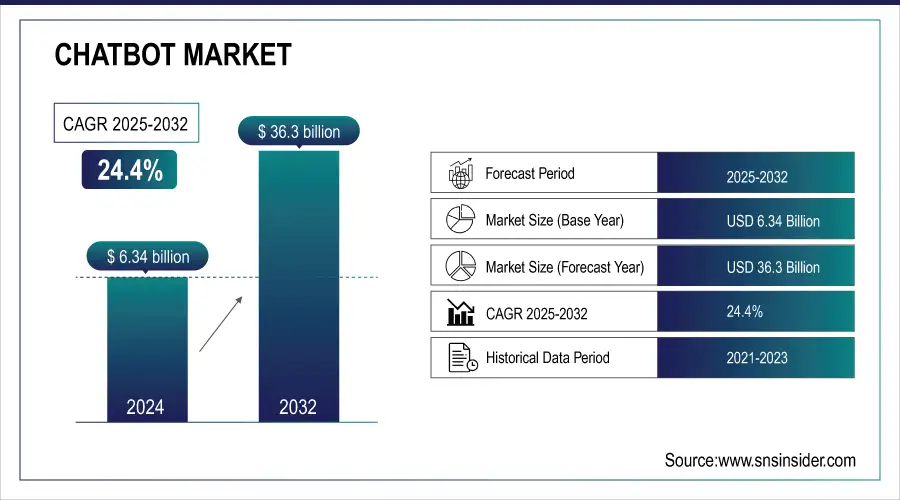
The Chatbot Market Size was valued at USD 6.34 billion in 2024 and is expected to reach USD 36.3 billion by 2032 and grow at a CAGR of 24.4% over the forecast period 2025-2032.
The Chatbot Market has experienced tremendous changes with the rapid development of artificial intelligence and machine learning technologies. The technology now provides a platform for even more complex and sophisticated human-computer conversations, thus easier to use. It changes customer service, enhances user experience, and improves efficiency within industries. Demand for chatbots increased as businesses are seeking innovative solutions to manage customer inquiries and support in a society moving towards automation in customer engagement.
Get more information about Chatbot Market - Request Sample Report
Another significant factor here is the shift in consumer demand for real-time communication and constant availability that calls for businesses to deploy AI-based models to remain the game player. The advanced NLP has also positively influenced the market, allowing chatbots to accurately understand and reply to user questions, therefore becoming less dependent on chance.
Key Trends of the Chatbot Market:
-
Rapid market growth fueled by AI advancements and automation in customer service
-
Generative AI enabling context-aware, natural, and hyper-personalized chatbot conversations
-
Increasing adoption of multimodal chatbots supporting text, voice, and image interactions
-
Rising demand for emotionally intelligent chatbots with sentiment and tone recognition
-
Voice-first chatbot interfaces expanding for hands-free, real-time interactions
-
Seamless AI-to-human handoff improving customer experience for complex queries
-
Growing multilingual chatbot adoption is breaking communication barriers globally
-
Ethical AI driving privacy, compliance, and fairness in chatbot design
-
Predictive analytics enabling personalized and proactive conversational experiences
The finance sector also employs chatbot technology to facilitate user interactions and to improve their workflows. In October 2024, the Devexperts reported that their AI-based chatbot, Devexa, would be integrated into Discord, a popular communication service. Integration with a widely used social media application will give the users financial services directly, making financial advice and services more accessible and user-friendly. In terms of strategy, it reaches out to where the customers engage daily, understanding the preferences of a modern consumer for today and tomorrow. Combining the versatility of the chatbots with social platform deployment will give the way forward to even greater user engagement and satisfaction.
-
In October 2024, a congressional candidate in Virginia used an AI chatbot as a surrogate stand-in in a live debate with the incumbent opponent, according to Reuters. Such use of technology becomes a prime example of how, while chatbots amplify customer service, they are also finding their places in such critical public engagement fields. Similar developments in the medical field have led to AI chatbots being used to make medical diagnoses more accurate.
Chatbot Market Drivers:
-
Growing Demand for Personalized Customer Interactions Drives the Chatbot Market Expansion
The principal driver of the chatbot market is the rising demand for personalized customer interactions. With ever-increasing requirements for customized experiences and treatment, consumers are expecting offers and services tailored to their specific needs and preferences. Chatbots with AI capabilities can process high volumes of data and offer tailor-made recommendations and support to users. This personalization benefits user satisfaction along with loyalty as clients feel more valued while getting relevant answers to their queries. Industry sectors like retail, finance, and healthcare are implementing chatbots to meet such personalized needs. Companies may ensure that interactions will not only be efficient but meaningful by integrating chatbots into their customer service strategy. The level of competency of the chatbot is becoming increasingly sophisticated as it now employs machine learning and natural language processing to further its knowledge of intent and context. The evolving capability enables it to mingle with humans in more normal conversations, further convincing such solutions a necessity in this increasingly competitive market.
-
Advancements in Artificial Intelligence and Natural Language Processing Fuel Chatbot Innovations
The rapidly growing AI and NLP technologies are leading to significant growth in innovations in the market of chatbots. Developments in these areas are constantly making chatbots capable of understanding complex queries, as well as responding more accurately. An AI-based chatbot can learn from previous interactions, adapt responses according to user feedback, and continuously improvise on them. The outcome is better communication between businesses and their clients, thus improving the overall user experience. Organizations are heavily investing in AI and NLP technologies with the hope that they eventually can create a suitable chatbot, that can have meaningful conversations, resolve issues quickly, and allow the natural flow of dialogue. Other technologies have also become mat; meanwhile, the integration of chatbots with other platforms such as social media and messaging applications, it makes possible to reach broader audiences. Again, the significant applications of AI and NLP in chatbots translate to the expansion of the market for the simple reason that business companies are designed to utilize these technologies to excel in a fast-emerging digital world.
Chatbot Market Restraint:
-
Data Privacy Concerns May Hinder Chatbot Market Growth
While the market for chatbots is expected to still grow, data privacy concerns remain one of the major restrictions in growth. For instance, since there has been an increase in demand for the use of chatbots in customer interactions, so also the sensitive information being shared raises questions regarding data security since there would be more awareness of what information is being collected, stored, and used. Unless there are sound data protection mechanisms in place, the loss of reputation and loss of confidence from customers might be destined for an organization; however, complexities are added to regimes such as the General Data Protection Regulation over Europe by outlining stricter procedures for handling personal data. Now businesses need to tread with caution in the face of lawsuits while keeping the focus of their chatbot system oriented to privacy at all times. The level of security and transparent policies about privacy will present a huge challenge for companies in the adoption of chatbots. Concerns about personal data will make consumers very careful about what they expose online. Failure to address such issues will limit the market's growth toward higher adoption rates for chatbots.
Chatbot Market Opportunities:
-
Expanding Application Areas Present New Opportunities for Chatbot Adoption
Expanding fields of chatbots across various industries present interesting opportunities for growth in the market. Organizations are becoming more aware of potential benefits that may be derived from using chatbots, but finding new ways to assimilate these technologies into operations is the high point of the curve. The application of chatbots is not merely being developed to improve customer service but, rather has also been applied in fields such as healthcare and patient engagement, education for supporting students, and finance for managing personal finance. This versatility means that business entrepreneurs will be untethered to use chatbots for different purposes other than lead generation and appointment setting to further complete data collection. Because various industries are gaining acceptance of the adoption of the said utility, more demand is expected to take off towards specific solutions for several needs in operations. Companies that can produce and launch chatbots with the ability to address a wide range of requirements will have a leg up. More importantly, the advancement in technologies of AI and NLP is expected to further advance the abilities of chatbots and push their acceptance into different fields. This business can take advantage of opportunities to ensure efficiency, lower operational costs, and enhance customer satisfaction.
Chatbot Market Challenges:
-
Integration Challenges with Existing Systems Pose Risks to Chatbot Implementation
The main challenge to the large-scale deployment of chatbots in most organizations has been integration with current systems. Most businesses have complex IT structures, which have been built up over the years. It is cumbersome to integrate a new chatbot solution. Substantial effort and resources are applied to ensure that chatbots work well in conjunction with existing systems like CRM, databases, or any communication platform. Incompatibility may lead to disruptions, reduced efficiency, and poor user experience. Training to operate effectively within the specific context of business operations may also be very resource intensive with the chatbots needing continuous adjustments and updates. Organizations may face workers' resistance to using them for fear that the work will be taken over by the chatbots rather than being supported. Therefore, businesses have to face all these challenges by planning very carefully while implementing a chatbot and having a clear strategy where they are integrating their system and training their staff. Successful integration will ensure that the chatbots work effectively but will increase user acceptance, making eventual transitions to automation easier.
Market Segmentation Analysis
-
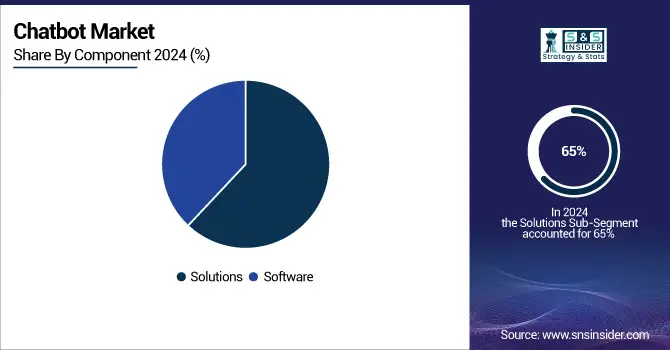
By Component, Solutions dominate the market, while Services are emerging as the fastest-growing segment.
The solutions segment dominated the Chatbot Market in 2024, with an estimated market share of around 65%. In this, the Software sub-segment captured a significant share, contributing to nearly 40% of the total market. The reason for Solutions segment dominance is the high demand for chatbot applications in various industries. It calls for better customer engagement and support. For instance, solutions like Zendesk and Intercom offer strong software features through the inherent presence of AI capabilities, thereby allowing organizations to simplify customer interactions seamlessly. Dominance in the performance of the Software segment is a reflection of its core role since most businesses need a scalable, customizable chatbot solution that satisfies the specific requirements of a company. Additionally, as digital transformation programs take the forefront for most organizations, the integration of advanced chatbot software becomes essential in achieving optimal business operations and engagement with customers.
-
By Type, AI-based chatbots dominate the market, while Rule-based chatbots are gradually declining in preference.
In 2024, the AI-based segment dominated the chatbot market, with an approximate market share of around 70%. This is primarily because preference has now shifted towards advanced, conversational AI systems offering better user experiences compared to rule-based chatbots. These AI chatbots use natural language processing and machine learning to understand and respond to user queries more humanly, thus making them more capable of more complex communication. For example, Google Dialogflow and the Microsoft Bot Framework are platforms that leverage the power of AI-based algorithms hence allowing businesses to develop smart chatbots that learn from their interaction with users and continue improving on responses over time. Growth in this regard could be mainly attributed to the growing requirement of companies in terms of engagement with their customers and increasing operational efficiency. Since the trend emerged, AI-based solutions have helped solidify market dominance over this segment.
-
By Deployment Mode, Cloud dominates the market, while On-premise is gaining traction in security-sensitive sectors.
In 2024, the cloud segment dominated the Chatbot Market, with an estimated market share of around 75%. The primary reason why organizations are increasingly opting for the adoption of cloud-based solutions is due to their easily scalable and cost-effective nature. Moreover, they easily integrate with other existing systems, which makes them highly preferable for businesses of all sizes. Cloud chatbots are easily accessible and updated, thus allowing organizations to deploy new features and enhancements without investing much in IT infrastructure. For instance, AWS Lex and Google Cloud's Dialogflow enable developers to create, build, and administrate cloud-based chatbots, meaning it provides them with flexibility and rapid deployment capabilities. In addition, the cloud model enables real-time analysis of data and machine learning, allowing such chatbots to improve their performance over time by learning from user interactions. With companies rapidly embracing digital transformation, the benefits from cloud deployment modes made this mode the most adopted one in the market for chatbots.
-
By Organization Size, Large Enterprises dominate the market, while SMEs are emerging as the fastest-growing adopters.
In 2024, the Large Enterprises segment dominated and accounted for the largest share of around 60% of the Chatbot Market in 2024. This is mainly because large organizations command greater resources and technological capabilities that allow for the full-scale deployment of sophisticated chatbot solutions. Apart from commanding resources and having the capacity to deploy large-scale sophisticated chatbot solutions, such enterprises also typically possess extended customer bases that require efficient mechanisms for customer service to handle large volumes of inquiries. For example, large companies like Bank of America and Amazon could incorporate AI-based chatbots in their systems to complement the management of their activities involving relations with customers and improve their service delivery. Through the intervention of these chatbots, the engagement will be seamless, and issues from the customers will be addressed instantly. More than that, large companies can design and scale up their systems to fit each different operational need within that company, thus being an important factor that increased this group's interest in such tools. This will keep the focus on customer engagement and operational efficiency squarely in place as large enterprises continue their digital transformation.
-
By End-user, Customer Service dominates the market, while E-commerce & Retail are expanding at the fastest pace.
In 2024, the customer service segment dominated and accounted for a market share of about 45%. The need to improve processes in customer support and communication processes among businesses is a major reason. Regarding this area of application, customer service chatbots are developed to address customer inquiries immediately or assist clients in solving problems and complicated processes to reduce response times and enhance customer satisfaction. For example, businesses like Starbucks and H&M were able to integrate AI-powered chatbots in their consumer service operations so that customers could place orders, track shipments, or seek direct assistance. Companies can then free up their staff from mundane questions while they attend to more complex issues that need human interaction. The expectation for quick and efficient service is constantly increasing among customers, as is the use of Customer Service in the chatbot market.
Chatbot Market Regional Analysis:
-
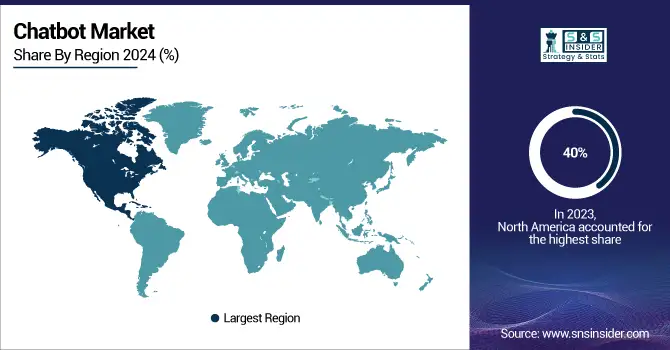
North America Chatbot Market Insights
In 2024, North America dominates the Chatbot Market with an estimated share of 40%, driven by advanced AI adoption, strong enterprise automation initiatives, and robust demand for conversational solutions in customer service. The region benefits from a mature digital ecosystem, widespread use of cloud services, and integration of AI-driven chatbots across industries such as BFSI, retail, and healthcare. These advancements reinforce North America’s leadership in chatbot adoption and deployment.
Need any customization research on Chatbot Market - Enquiry Now
-
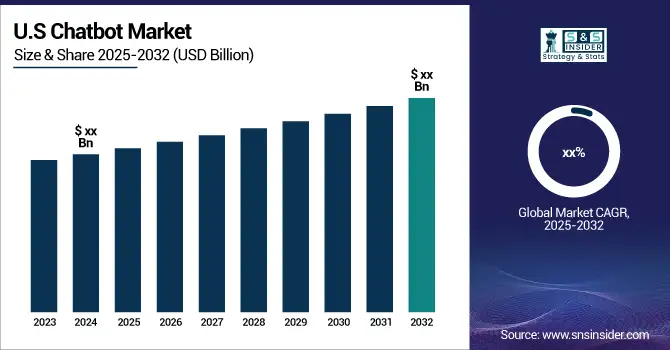
United States Leads Chatbot Market in North America
The U.S. dominates with the largest market share, supported by leading AI innovation, high digital consumer engagement, and enterprise investment in automation. Companies such as Amazon, Google, and IBM are at the forefront of developing intelligent chatbot platforms, enabling businesses to streamline customer support and improve engagement. Strong adoption in banking, retail, and healthcare ensures the U.S. maintains its position as the regional leader in chatbot technology.
-
Asia Pacific Chatbot Market Insights
Asia Pacific is the fastest-growing region with an estimated CAGR of 11.5% in 2024, fueled by rapid digital transformation, mobile-first economies, and booming e-commerce. Businesses across the region are deploying chatbots to handle high customer volumes, streamline communication, and support multilingual engagement. Increased smartphone penetration and AI investments accelerate the region’s chatbot adoption, making Asia Pacific the key growth hub for global chatbot deployments.
-
China Leads Chatbot Market Growth in Asia Pacific
China dominates the Asia Pacific market due to its vast digital consumer base, government support for AI innovation, and integration of chatbots into platforms like WeChat. Chinese enterprises are leveraging conversational AI in retail, BFSI, and healthcare to improve customer experience and reduce costs. With rapid advancements in AI capabilities and a thriving e-commerce ecosystem, China continues to lead the region in chatbot adoption and innovation.
-
Europe Chatbot Market Insights
In 2024, Europe holds a significant share in the Chatbot Market, supported by enterprise automation, multilingual chatbot demand, and strong regulatory frameworks favoring digital transformation. Industries like banking, telecom, and retail are adopting AI-powered chatbots to improve efficiency, comply with GDPR standards, and enhance customer satisfaction. Continuous development in conversational AI ensures steady growth in chatbot deployment across the European market.
-
Germany Dominates Europe’s Chatbot Market
Germany leads the European market with strong adoption of AI-driven customer support tools across manufacturing, automotive, and BFSI. The country’s focus on efficiency, compliance, and innovation in digital solutions reinforces chatbot adoption. German enterprises prioritize data security and automation, making chatbots a core component of their digital strategies. This positions Germany as the leading force in Europe’s chatbot market.
-
Latin America and Middle East & Africa Chatbot Market Insights
The Chatbot Market in Latin America and MEA is witnessing steady growth in 2024, driven by expanding e-commerce, growing mobile usage, and rising adoption of digital banking and customer service automation. Enterprises across these regions are embracing chatbots to improve service delivery, enhance customer engagement, and reduce operational costs.
-
Regional Leaders in Latin America and MEA
Brazil leads Latin America, supported by rapid expansion in e-commerce, fintech growth, and consumer demand for fast, AI-enabled customer support. In MEA, the UAE dominates the market, driven by government-led smart city initiatives, rising demand for AI-powered solutions in hospitality and finance, and luxury service industries prioritizing customer engagement.
Competitive Landscape of Chatbot Market:
IBM
IBM Corporation, headquartered in Armonk, New York, is a global leader in technology, cloud computing, and artificial intelligence solutions. Known for its innovation in enterprise IT, IBM focuses on hybrid cloud infrastructure, data analytics, and advanced AI applications through its WatsonX platform. In the chatbot market, IBM plays a critical role by offering AI-driven conversational solutions such as WatsonX Assistant, which empowers businesses to automate customer support, streamline workflows, and provide personalized digital experiences. By integrating natural language processing and machine learning, IBM’s chatbot solutions enhance enterprise productivity, improve customer engagement, and reduce operational costs across multiple industries.
-
In June 2024, IBM Corporation introduced several AI assistant innovations, including Watsonx Assistant for Z, designed to support mainframe teams with generative AI and automation. Enhancements across watsonx Orchestrate, watsonx Assistant, and watsonx Code Assistant for Z aim to boost enterprise productivity by streamlining workflows and enabling conversational search capabilities.
-
In January 2024, IBM Corporation partnered with European software company SAP to co-develop generative AI solutions, including AI-powered chatbots, targeting supply chain, finance, and sales operations in the consumer-packaged goods and retail sectors. These solutions focus on optimizing store assortments, enhancing transportation planning, and automating order settlements to increase efficiency and reduce costs.
Meta
Meta Platforms, Inc., formerly Facebook, is a leading global technology company based in Menlo Park, California, focusing on social networking, digital communication, and the metaverse. Its ecosystem includes Facebook, Instagram, WhatsApp, and Messenger, serving billions of users worldwide. In the chatbot market, Meta has significantly advanced conversational AI through Messenger bots and WhatsApp Business APIs, enabling businesses to deliver instant customer service, marketing, and transactional support. Chatbots on Meta’s platforms empower brands to engage directly with consumers, automate communication, and scale personalized experiences. This integration strengthens Meta’s role as a key driver of global chatbot adoption and digital customer engagement.
-
In October 2024, Meta released its AI chatbot in the UK on Facebook and Instagram, taking user interaction and engagement with the services to a new level. It was said that the chatbot would answer a variety of questions it received from users, meeting the personal needs of individuals.
Chatbot Market Companies:
-
IBM Corporation
-
Microsoft Corporation
-
Google LLC
-
Amazon Web Services (AWS)
-
Meta Platforms, Inc.
-
Oracle Corporation
-
SAP SE
-
Salesforce, Inc.
-
Drift.com, Inc.
-
Nuance Communications
-
Kore.ai
-
Tars Technologies
-
Inbenta Technologies
-
Clinc, Inc.
-
Yellow.ai
-
SnatchBot
| Report Attributes | Details |
|---|---|
| Market Size in 2024 | US$ 6.34 Billion |
| Market Size by 2032 | US$ 36.3 Billion |
| CAGR | CAGR of 24.4% From 2025 to 2032 |
| Base Year | 2024 |
| Forecast Period | 2025-2032 |
| Historical Data | 2021-2023 |
| Report Scope & Coverage | Market Size, Segments Analysis, Competitive Landscape, Regional Analysis, DROC & SWOT Analysis, Forecast Outlook |
| Key Segments | •By Component (Solutions [Software, Platform], Services [Managed Services, Professional Services {Consulting, System Integration and Implementation, Support and Maintenance}]) •By Type (Rule Based, AI Based) •By Deployment Mode (On-premises, Cloud) •By Organization Size (Large Enterprises, Small and Medium-sized Enterprises (SMEs)) •By Application (Customer Service, Personal Assistant, Branding and Advertisement, Customer Engagement and Retention, Data Privacy and Compliance, Employee Engagement and On Boarding, Payment Processing, Others) •By End-use Vertical (BFSI, IT and Telecom, Retail and Ecommerce, Healthcare and Life Sciences, Transportation and Logistics, Government, Travel and Hospitality, Media and Entertainment, Others) |
| Regional Analysis/Coverage | North America (US, Canada, Mexico), Europe (Eastern Europe [Poland, Romania, Hungary, Turkey, Rest of Eastern Europe] Western Europe] Germany, France, UK, Italy, Spain, Netherlands, Switzerland, Austria, Rest of Western Europe]), Asia Pacific (China, India, Japan, South Korea, Vietnam, Singapore, Australia, Rest of Asia Pacific), Middle East & Africa (Middle East [UAE, Egypt, Saudi Arabia, Qatar, Rest of Middle East], Africa [Nigeria, South Africa, Rest of Africa], Latin America (Brazil, Argentina, Colombia, Rest of Latin America) |
| Company Profiles |
IBM, Microsoft, Google, AWS, Meta, Oracle, SAP, Salesforce, Zendesk, Intercom, Drift, LivePerson, Nuance, Kore.ai, Landbot, Tars, Inbenta, Clinc, Yellow.ai, SnatchBot, and other key players. |
Frequently Asked Questions
The North American region dominated the Chatbot market holding the largest market share of about 40% during the forecast period.
Integration challenges with existing systems pose risks to chatbot implementation
Expanding application areas present new opportunities for chatbot adoption
The Chatbot Market Size was valued at USD 6.34 billion in 2024 and is expected to reach USD 36.3 billion by 2032.
The Chatbot Market is expected to grow at a CAGR of 24.4%
Get in Touch
