Chemoinformatics Market Report Scope & Overview:
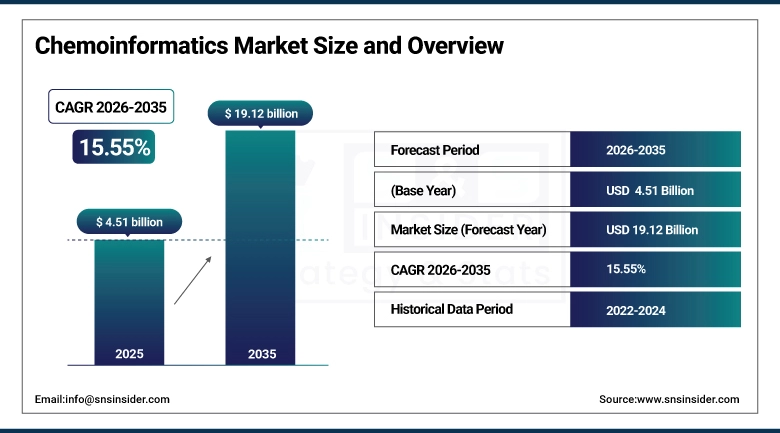
The Chemoinformatics Market size was valued at USD 4.51 billion in 2025 and is expected to reach USD 19.12 billion by 2035, growing at a CAGR of 15.55% over the forecast period of 2026-2035.
The global chemoinformatics market is growing at an accelerated rate due to the integration of artificial intelligence, machine learning, and advanced molecular modeling technologies with the process of drug discovery and chemical research in the pharmaceutical industry. Chemoinformatics, which includes the process of computer-aided management of chemical data, QSAR studies, molecular fingerprinting, virtual screening, and structure-based design, has become imperative in the pharmaceutical industry and in the fields of biotechnology, agrochemicals, and materials science. The increasing use of cloud-based cheminformatics platforms, the rising popularity of large-scale chemical databases such as PubChem, and the integration of generative AI in molecular design processes are significantly changing the market’s competitive and business environment. The rising R&D investments of leading pharmaceutical firms worldwide in their pursuit of reducing drug discovery times and costs, and the rising trend of collaboration in computational chemistry, are further fueling the market’s growth in all geographical regions.
For instance, in April 2024, a multi-institutional analysis estimated that AI-assisted chemoinformatics tools reduced average hit-to-lead optimization timelines by approximately 34% in early-stage drug discovery programs, translating to cost savings of up to USD 180 million per drug candidate across participating pharmaceutical firms in North America and Europe.
Chemoinformatics Market Size and Forecast:
-
Market Size in 2025: USD 4.51 billion
-
Market Size by 2035: USD 19.12 billion
-
CAGR: 15.55% from 2026 to 2035
-
Base Year: 2025
-
Forecast Period: 2026–2035
-
Historical Data: 2022–2024
To Get more information on Chemoinformatics Market - Request Free Sample Report
Chemoinformatics Market Trends
-
Rapid integration of generative AI and deep learning frameworks, including graph neural networks and transformer-based molecular property predictors, into commercial cheminformatics platforms is enabling de novo drug design with unprecedented speed and chemical diversity coverage.
-
Expansion of open-access chemical databases and interoperable data exchange standards, including SMILES, InChI, and FHIR-aligned chemical ontologies, is lowering barriers to adoption for academic institutions and small biotech firms globally.
-
Growing deployment of cloud-native chemoinformatics software-as-a-service (SaaS) platforms is enabling scalable, collaborative molecular modeling workflows across geographically distributed drug discovery teams without requiring high-performance on-premise computing infrastructure.
-
Increasing application of QSAR and quantitative structure-property relationship (QSPR) modeling in environmental risk assessment and green chemistry initiatives is expanding chemoinformatics use cases beyond pharmaceutical drug discovery into regulatory toxicology and agrochemical sectors.
-
Strategic acquisitions and platform consolidation among leading computational chemistry vendors are creating integrated end-to-end cheminformatics ecosystems that combine chemical database management, molecular simulation, and AI-driven lead optimization in unified software environments.
-
Rising investment in quantum computing-compatible molecular simulation tools is positioning next-generation chemoinformatics platforms to deliver substantially improved accuracy in binding affinity prediction, protein-ligand interaction modeling, and reaction pathway analysis.
-
Growing regulatory acceptance of in-silico drug validation data by the FDA, EMA, and ICH within new drug application submissions is significantly increasing the strategic value of chemoinformatics outputs in pharmaceutical regulatory affairs and market approval workflows.
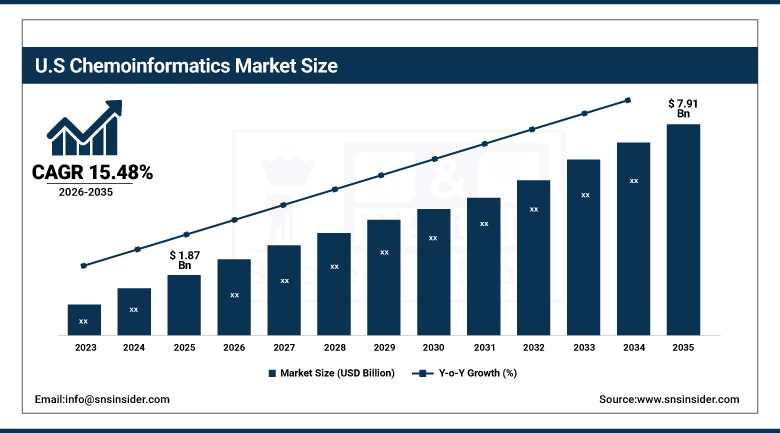
The U.S. Chemoinformatics Market was valued at USD 1.87 billion in 2025 and is expected to reach USD 7.91 billion by 2035, growing at a CAGR of 15.48% from 2026-2035. The U.S. has the largest market share in the global Chemoinformatics Market, supported by the presence of the largest pharmaceutical R&D ecosystem in the world, the presence of the leading computational chemistry software vendors, and the availability of significant government funding through the NIH, DARPA, and NSF for AI-based drug discovery initiatives. The increasing adoption of model-informed drug development techniques by the FDA, along with the commercial success of the homegrown cheminformatics solutions developed by Schrödinger, Inc. and Certara, Inc., has further supported the U.S. Chemoinformatics Market. Strong research activities undertaken at esteemed universities such as MIT, Stanford University, and the Scripps Research Institute continue to deliver proprietary cheminformatics methodologies that are accelerating the commercialization of the technology.
Chemoinformatics Market Growth Drivers:
-
Accelerating AI Integration in Drug Discovery Pipelines is Driving Chemoinformatics Market Growth
The integration of artificial intelligence, machine learning, and deep learning algorithms into pharmaceutical drug discovery represents the most transformative and high-impact growth driver for the chemoinformatics market. AI-powered chemoinformatics tools are enabling pharmaceutical scientists to screen virtual compound libraries of over one billion molecules in silico, predict ADMET (absorption, distribution, metabolism, excretion, toxicity) properties with greater accuracy, and prioritize lead candidates for experimental synthesis with significantly reduced attrition rates. The commercial adoption of generative molecular design platforms, reinforcement learning-based scaffold optimization tools, and large-scale molecular property prediction models is accelerating across both large pharmaceutical corporations and emerging biotech firms, directly driving software subscription revenues, licensing fees, and professional service revenues across the global chemoinformatics market.
For instance, in August 2024, Schrödinger, Inc. reported that its AI-driven FEP+ (Free Energy Perturbation) platform had been used by over 1,400 pharmaceutical scientists globally, contributing to active drug discovery collaborations with 17 of the top 20 global pharmaceutical companies and demonstrating strong institutional entrenchment of advanced chemoinformatics solutions in mainstream drug development workflows.
Chemoinformatics Market Restraints:
-
High Software Licensing Costs and Specialized Workforce Scarcity are Hampering Chemoinformatics Market Growth
Despite robust market fundamentals, the high acquisition and annual licensing costs associated with premium chemoinformatics platforms, which frequently exceed USD 50,000 per seat annually for enterprise-grade molecular modeling suites, present a substantive barrier for small and mid-sized pharmaceutical companies, academic research groups, and emerging market institutions seeking to adopt sophisticated in-silico drug discovery tools. The concurrent shortage of professionals with interdisciplinary expertise spanning computational chemistry, data science, and pharmaceutical sciences further constrains market penetration, as organizations frequently lack the internal capacity to fully operationalize advanced QSAR modeling, molecular docking, and AI-driven virtual screening capabilities. These combined barriers of cost and talent availability are slowing adoption rates, particularly across Latin American, South Asian, and Sub-Saharan African research markets where chemoinformatics infrastructure investment remains nascent.
Chemoinformatics Market Opportunities:
-
Expansion into Agrochemical, Materials Science, and Environmental Toxicology Verticals Creates Significant Growth Opportunities for the Chemoinformatics Market
Beyond pharmaceutical drug development, the use of chemoinformatics techniques in agrochemical compound design, advanced materials compound development, material property prediction, and environmental toxicology risk assessment represents an emerging, underserved market opportunity for market players to pursue. With the U.S. Environmental Protection Agency, the European Chemicals Agency, and other governing bodies requiring in silico toxicity testing for REACH and Toxic Substances Control Act regulations, there is a significant surge in demand for QSAR/chemoinformatics software to meet the regulatory requirements. The fusion of materials informatics with cheminformatics in battery electrolyte compound design, specialty polymer development, catalyst compound optimization, etc., is creating a larger total addressable market for chemoinformatics software, including new segments of enterprise software customers outside of the pharmaceutical/biotechnology industry.
For instance, in November 2024, the U.S. Environmental Protection Agency expanded its CompTox Chemicals Dashboard to include over 900,000 chemical substances with integrated QSAR-derived toxicity predictions, reflecting growing government-endorsed reliance on chemoinformatics-based in-silico methods for large-scale environmental risk assessment and regulatory decision-making.
Chemoinformatics Market Segment Analysis
-
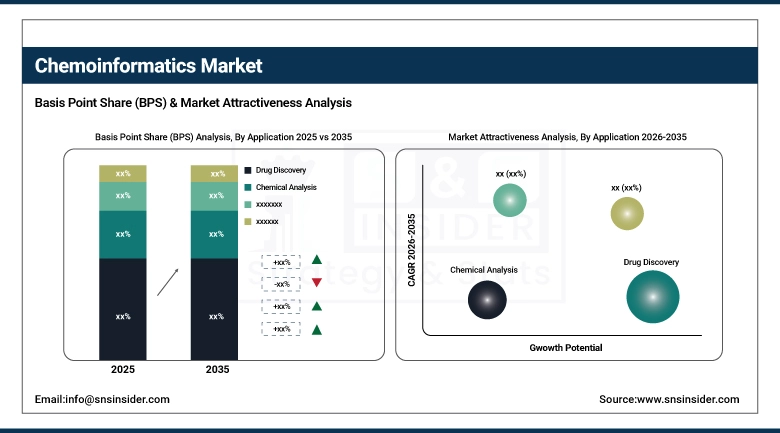
By application, drug discovery held the largest share of approximately 47.68% in 2025, and the drug validation segment is expected to register the highest CAGR of 17.84% over the forecast period.
By Application, Drug Discovery Leads, While Drug Validation Registers Fastest Growth
The drug discovery segment accounted for the largest revenue share of about 47.68% in 2025, owing to the widespread adoption of the drug discovery tools, namely, virtual screening, molecular docking, de novo drug design, and QSAR-based lead optimization, within the pharmaceutical industry. This is because the drug discovery segment is at the heart of the pharmaceutical R&D process, where in silico techniques are now considered essential and not optional in the process of developing new drugs, with the global expenditure on pharmaceutical R&D exceeding USD 250 billion annually. Chemical analysis accounted for approximately 31.42% of market share in 2025, driven by the sustained demand for chemical database management solutions, spectral analysis tools, and compound property profiling software. The drug validation segment is expected to exhibit the maximum CAGR of around 17.84% in the forecast period of 2026-2035, owing to the increased regulatory acceptance of in silico validation data in IND and NDA submissions, the increased adoption of physiologically based pharmacokinetic modeling in drug approval processes, and the increased adoption of cheminformatics solutions in drug development and approval. The others segment includes agrochemical design, materials informatics, and environmental toxicology applications, which accounted for around 8.37% of the market revenue in the year 2025.
Chemoinformatics Market Regional Highlights:
North America Chemoinformatics Market Insights:
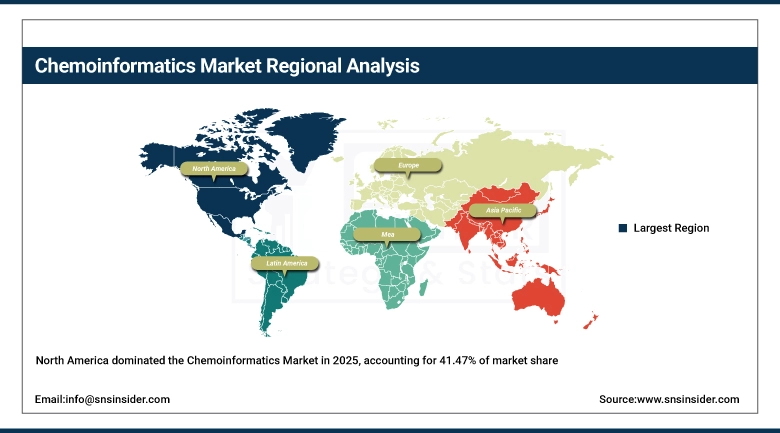
North America dominated the market with the highest revenue share of around 41.47% in 2025. The region is home to the most advanced R&D infrastructure for pharmaceutical R&D globally. The region is also home to the most prominent software companies in the cheminformatics industry and the highest R&D funding in AI-based drug development programs by the NIH and the DARPA. The region also has access to the largest pool of computational chemists and data scientists. The region also has the most advanced software adoption maturity levels in the top-tier pharmaceutical and biotech industry. The region also has the most supportive and progressive regulations that favor the development of the model-based drug development approach. The region of Canada contributes to the market incrementally with the presence of government-funded academic research centers and the emergence of the biotech industry in the country with the adoption of cloud-based cheminformatics software.
Get Customized Report as per Your Business Requirement - Enquiry Now
Asia Pacific Chemoinformatics Market Insights:
Asia Pacific is the fastest-growing regional segment of the chemoinformatics market with an 18.27% CAGR. This is due to the rapid growth of the local pharmaceutical and biotech industry in China, India, Japan, and South Korea. In addition, these countries are witnessing significant investment in AI-based drug discovery and computational life sciences from local governments. China's rising adoption of in-silico data in drug validation by its National Medical Products Administration, India's thriving generic pharmaceutical R&D sector's rising adoption of QSAR-based compound optimization, and South Korea's rising biopharma innovation landscape are creating strong regional market growth. In addition, rising academic partnerships between Asian research universities and global cheminformatics software vendors through academic licensing and co-development initiatives are further accelerating computational chemistry adoption in Asia.
Europe Chemoinformatics Market Insights:
Europe held approximately 28.16% of global chemoinformatics market revenue in 2025, supported by a strong computational chemistry research tradition anchored in institutions across Germany, the United Kingdom, Switzerland, and the Netherlands, alongside a well-developed pharmaceutical and specialty chemicals industry. The EMA's advancing model-informed drug development guidelines and the European Commission's Innovative Medicines Initiative (IMI) funding for in-silico drug development platforms are providing regulatory and financial tailwinds for market growth. The presence of globally recognized cheminformatics vendors, including ChemAxon in Hungary and BioSolveIT in Germany, reinforces Europe's position as a significant center of cheminformatics innovation and commercial activity.
Latin America (LATAM) and Middle East & Africa (MEA) Chemoinformatics Market Insights:
In Latin America and the Middle East & Africa, the increasing investment in the pharmaceutical industry, the rise in academic research output in computational chemistry in the region, and the growth in the number of government S&T funding programs are creating emerging demand for chemoinformatics tools and platforms. In the region of LATAM, Brazil and Mexico are the key drivers of the chemoinformatics market. The growth in the region is due to the increasing R&D in the generic pharmaceutical industry and computational chemistry. In the region of MEA, the UAE and Saudi Arabia are emerging as new innovation centers with increasing investment in the life sciences and AI-based drug development infrastructure. South Africa has already established academic research output in the pharmaceutical industry and is driving the adoption of open-source and cloud-based cheminformatics platforms in the region.
Chemoinformatics Market Competitive Landscape:
Schrödinger, Inc. (est. 1990) is a leading computational chemistry and drug discovery platform company headquartered in New York, offering an integrated suite of physics-based molecular simulation, AI-driven drug design, and cheminformatics tools spanning the full drug discovery workflow from target identification through lead optimization and candidate selection.
-
In October 2024, Schrödinger launched its next-generation molecular dynamics platform with integrated machine learning potentials, enabling pharmaceutical partners to achieve up to 50-fold acceleration in protein-ligand binding free energy calculations, significantly enhancing the throughput and commercial value of its drug discovery collaboration programs.
Dassault Systèmes (BIOVIA) (est. 1981) is a global enterprise software company whose BIOVIA division delivers industry-leading scientific informatics solutions, including chemical database management, molecular modeling, and laboratory informatics platforms, serving pharmaceutical, biotechnology, and specialty chemicals customers across more than 90 countries.
-
In March 2024, Dassault Systèmes BIOVIA released an enhanced version of its Pipeline Pilot cheminformatics workflow platform featuring native integration with cloud-based AI model repositories, enabling pharmaceutical scientists to deploy pre-trained molecular property prediction models directly within existing drug discovery data pipelines without requiring additional programming expertise.
Certara, Inc. (est. 2008) is a leading biosimulation and model-informed drug development company that provides integrated pharmacokinetic, pharmacodynamic, and cheminformatics modeling software and regulatory consulting services to pharmaceutical and biotechnology companies, supporting drug discovery, development, and regulatory submission workflows across global markets.
-
In June 2024, Certara expanded its Simcyp Simulator platform with new chemoinformatics-integrated ADMET property prediction modules, enabling pharmaceutical clients to conduct simultaneous in-silico metabolism and toxicity profiling of novel chemical entities within unified physiologically based pharmacokinetic modeling environments, reducing pre-clinical compound attrition rates.
Chemoinformatics Market Key Players:
-
Schrödinger, Inc.
-
Dassault Systèmes (BIOVIA)
-
Certara, Inc.
-
PerkinElmer, Inc.
-
Simulations Plus, Inc.
-
OpenEye Scientific Software
-
Chemical Computing Group (CCG)
-
ChemAxon Kft.
-
Cresset Group
-
BioSolveIT GmbH
-
Molecular Discovery Ltd.
-
Optibrium Ltd.
-
Dotmatics (Insightful Science)
-
Agilent Technologies, Inc.
-
Thermo Fisher Scientific Inc.
-
Insilico Medicine
-
Recursion Pharmaceuticals, Inc.
-
Intellegens Ltd.
-
Exscientia plc
-
Enamine Ltd.
| Report Attributes | Details |
|---|---|
| Market Size in 2025 | USD 4.51 Billion |
| Market Size by 2035 | USD 19.12 Billion |
| CAGR | CAGR of 15.55% From 2026 to 2035 |
| Base Year | 2025 |
| Forecast Period | 2026-2035 |
| Historical Data | 2022-2024 |
| Report Scope & Coverage | Market Size, Segments Analysis, Competitive Landscape, Regional Analysis, DROC & SWOT Analysis, Forecast Outlook |
| Key Segments | • By Application (Chemical Analysis, Drug Discovery, Drug Validation, and Others) |
| Regional Analysis/Coverage | North America (US, Canada, Mexico), Europe (Germany, France, UK, Italy, Spain, Poland, Turkey, Rest of Europe), Asia Pacific (China, India, Japan, South Korea, Singapore, Australia, Rest of Asia Pacific), Middle East & Africa (UAE, Saudi Arabia, Qatar, South Africa, Rest of Middle East & Africa), Latin America (Brazil, Argentina, Rest of Latin America) |
| Company Profiles | Schrödinger, Inc., Dassault Systèmes (BIOVIA), Certara, Inc., PerkinElmer, Inc., Simulations Plus, Inc., OpenEye Scientific Software, Chemical Computing Group (CCG), ChemAxon Kft., Cresset Group, BioSolveIT GmbH, Molecular Discovery Ltd., Optibrium Ltd., Dotmatics, Agilent Technologies, Inc., Thermo Fisher Scientific Inc., Insilico Medicine, Recursion Pharmaceuticals, Inc., Intellegens Ltd., Exscientia plc, Enamine Ltd. |
Frequently Asked Questions
The Chemoinformatics Market is primarily driven by the integration of AI and machine learning in drug discovery, increasing pharmaceutical R&D investments, and the adoption of cloud-based computational chemistry platforms.
The Chemoinformatics Market is projected to reach USD 19.12 billion by 2035.
The Chemoinformatics Market is widely used across pharmaceutical, biotechnology, agrochemical, materials science, and environmental research industries for molecular modeling and chemical data analysis.
The Chemoinformatics Market is expected to grow at a CAGR of 15.55% from 2026 to 2035.
AI is transforming the Chemoinformatics Market by enabling faster virtual screening, accurate molecular property prediction, and efficient drug design, significantly reducing development timelines and costs.
Get in Touch
