image

White Biotechnology Market Report Scope & Overview:

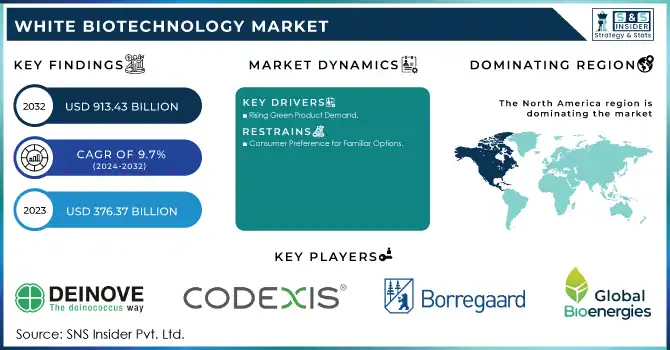
White Biotechnology Market Size was valued at USD 276.7 billion in 2023 and is expected to reach USD 558.7 billion by 2032, growing at a CAGR of 8.1% over the forecast period 2024-2032.

The white biotechnology market report provides direction in key statistical trends, which include revenue outlook, regional analysis, and competition as well. This report highlights the adoption rates by chemicals, food & beverages, pharmaceuticals, and biofuels industries. It examines investment & R&D spending, and follows public funding, and private-sector research. It also examines regulatory compliance & sustainability impact, focusing on compliance with environmental regulations and reductions in carbon footprint. The report analyses patent & innovation trends to determine the technology development and establish who is leading the market. With the increasing government support around sustainable initiatives and rising environmental concerns, the white biotechnology market is expected to grow at a booming pace in the forthcoming years.

White Biotechnology market Revenue Analysis

Get more information on White Biotechnology Market - Request Sample Report

Market Dynamics:

Drivers:

  • Growing consumer demand for sustainable products is propelling the adoption of bio-based solutions.

A major driver in the white biotechnology market is the growing demand of consumers for sustainable products. The latest global survey on sustainable shopping trends, conducted in January 2024, found that 80% of consumers worldwide are willing to pay a premium for sustainably manufactured or sourced products, with some willing to pay an average price premium of 9.7%. This inclination is most prominent within younger age groups for example, more than 70% of Gen Z favors climate-friendly and sustainable farming, and around 55% are willing to pay higher prices for these goods.

Companies are innovating bio-based solutions to meet this demand. In beauty, companies are creating sustainable ingredients such as animal-free collagen or bioengineered perfume notes that satisfy consumers looking for effective products that are less damaging to the environment. Likewise, startups focused on bioplastics are finding success through renewable products made from sugarcane and seaweed to replace traditional plastic products. Such developments reflect a larger trend where consumers are not only preferring sustainable products but also willing to spend on them, thereby driving innovation and growth in the white biotechnology sector.

Restraints

  • Significant upfront costs in research, technology, and infrastructure can deter adoption, especially among small and medium-sized enterprises.

The white biotechnology market is restrained by the high initial capital investments required. Setting up plants for manufacturing processes based on living systems and biological systems that allow the engineering of organs for industrial products requires considerable investments. For instance, building a traditional chemical plant involves capital expenditure of around USD 500 million, whereas a comparable biotech plant requires over USD 1 billion in investments. The cost of this bioprocessing equipment is extremely high, especially considering the high dependence on specialized, customized, and patented bioprocessing equipment incorporating technologically advanced features. Moreover, there is a continuous need to develop and refine biological production pathways to make them optimal and scalable which makes the costs higher even further. Such large financial hurdles can discourage small and medium-sized enterprises from entering the market and consequently restrict innovation and rivalry in the sector.

Opportunities

  • Converting waste materials into valuable products like biofuels and bioplastics supports a circular economy.

White biotechnology has an attractive waste valorization opportunity which can convert waste constituents through either mass conversion or existing materials. A notable example is from the Western Isles in the UK, where non-recyclable waste is used to produce solid recovered fuel (SRF) with the help of fast-acting bacteria which recycle the waste gas energy into carbon-neutral products. It processes around 10 tonnes of municipal and commercial waste per day and produces SRF that generates 95% less CO₂ equivalent compared to conventional fossil fuels.

White biotechnology is an innovative approach increasingly undertaken in the beauty industry, to enable the production of sustainable ingredients. For example, Givaudan is upcycling and using renewable carbon sources in its bioengineered ingredients, and L'Oréal uses biogas in fermentation processes to reduce its carbon footprint. These are a few examples that reflect this recently emerging trend of utilizing waste through biotechnological processes to generate high-value products to support the circular economy and mitigate environmental footprints.

Challenges

  • Scaling up biotechnological processes from laboratory to industrial levels presents significant challenges.

The white biotechnology sector faces significant challenges, particularly in scaling laboratory processes to industrial levels. Building bioreactors, units for microbial cultures, and downstream processing facilities require huge capital investment. For example, the cost of building a chemical plant is about USD 500 million versus over USD 1 billion for a similar biotech plant. Beyond that challenge, the complexity of the biotechnological processes presents roadblocks. Moving from lab-scale to full-scale production requires precise biosynthetic pathway optimization, along with tight regulation of environmental conditions to produce a homogeneous high-quality product. This level of complexity often results in slower development cycles and more costly operations. Furthermore, the industry faces a dearth of talent skilled in the same space both inside of biotechnology and also industry. This talent gap can impede the efficient scaling and commercialization of biotechnological innovations

Segment Analysis:

By Product

In 2023, the biofuels segment held the largest market share of around 38% in revenue. The significant dominance is primarily due to the rising global efforts to promote renewable energy sources and minimize greenhouse gas emissions. According to a report published by the U.S. Energy Information Administration (EIA), biofuel production in the United States rose to 17.5 billion gallons in 2023, up 5% from the previous year. This is further fueled by government rules and subsidies like the Renewable Fuel Standard (RFS) program that mandates that transportation fuel sold in the U.S. contains a minimum volume of renewable fuels.

Furthermore, the European Union's Renewable Energy Directive II (RED II) has set a target of 14% renewable energy in the transport sector by 2030, with advanced biofuels playing a crucial role. These policies have encouraged capital investment to install biofuel production facilities and innovation to develop technologies that reduce costs. Widespread adoption of biofuels in the aviation and marine transport sectors has further aided segment growth, in light of a recent implementation of the Carbon Offsetting and Reduction Scheme for International Aviation (CORSIA), by the International Civil Aviation Organization (ICAO) that supports sustainable aviation fuels.

By Application

In 2023, Bioenergy accounted for 39% of the market share, A large share of the bioenergy sector's dominance can be attributed to the global effort to increase renewable energy sources while reducing carbon emissions. Modern bioenergy constitutes 50% of all renewable energy used in the world today and is expected to grow 3% per year through 2025, according to the International Energy Agency (IEA). This growth is bolstered by governmental policies promoting the use of bioenergy, including the EU setting a target to increase the share of renewable energy to 32% by 2030.

The pharmaceutical ingredients are expected to register the highest growth mainly due to the rise in demand for such products since they offer sustainable and bio-based methods for producing drugs. In 2023, 53 new drugs were approved by the U.S. Food and Drug Administration (FDA), about 25% of which are made using biotechnology processes. The increasing attractiveness of pharmaceutical manufacturing via white biotechnology with environmental benefits, higher product purity, and lower costs largely underlies this trend. The increasing attention towards personalized medicine and biopharmaceuticals is positively driving the implementation of white biotechnology for drug development and production processes.

Regional Analysis:

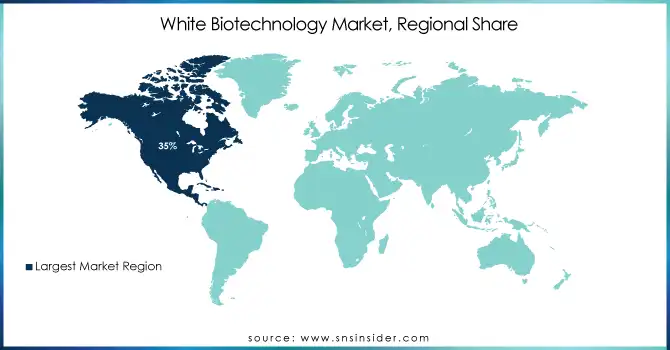
The North American market in terms of the highest market share of 35% of the white biotechnology market in 2023, is due to North America's ever-leading position in terms of a strong, well-established research and development infrastructure, the presence of strong government support, and high adoption of biotechnology solutions across various industries. For instance, the United States, as one of the pioneering nations in white biotechnology, was estimated by the U.S. Department of Agriculture (USDA) to have created 470 billion USD worth of bio-based products, and associated with 4.6 million jobs in 2023.

During the forecast period, the Asia-Pacific region is anticipated to record a higher CAGR than any other region across the globe. The growth of this region is attributed to increasing investments in biotechnology research, increasing environmental awareness, and supportive government policies. China's 14th Five-Year Plan (2021-2025) recognizes biotechnology as one of its pillar strategic industries that aims to raise the proportion of GDP accounted by the bioeconomy to 7% by 2025. Similarly, USD 3.5 billion tagged under National Biotechnology Development Strategy 2021-2025 has been allocated by India's Department of Biotechnology for biotechnology research and development with an emphasis on sustainable bio-based solutions. The significant population and expanding industrial base of the region are anticipated to positively influence the adoption of white biotechnology applications across agricultural, energy, and manufacturing sectors.

White-Biotechnology-Market-Regional-Share

Need any customization research on White Biotechnology Market - Enquiry Now

Key Players:

Key Service Providers/Manufacturers

  • DuPont de Nemours, Inc. (Sorona® polymer, Bio-PDO™)

  • Novozymes A/S (Bioenergy enzymes, Food & beverage enzymes)

  • BASF SE (Biodegradable plastics, Enzymes for detergents)

  • Koninklijke DSM N.V. (EcoPaXX® biopolymer, Yeast-based nutritional products)

  • Cargill, Inc. (BiOH® polyols, NatureWorks® PLA)

  • Archer Daniels Midland Company (Bio-based propylene glycol, Ethanol)

  • Evonik Industries AG (Biolys® feed additive, RESOMER® biopolymers)

  • Corbion N.V. (PURAC® lactic acid, PURALACT® lactide)

  • Amyris, Inc. (Biofene® renewable squalane, Biossance® skincare products)

  • BioAmber Inc. (Bio-based succinic acid, Bio-based 1,4-butanediol)

Users

  • The Coca-Cola Company

  • Unilever PLC

  • Procter & Gamble Co.

  • Nestlé S.A.

  • General Motors Company

  • Ford Motor Company

  • L'Oréal S.A.

  • Colgate-Palmolive Company

  • PepsiCo, Inc.

  • Johnson & Johnson

Recent Developments:

In June 2024, BASF investigated CO₂-neutral bio-based fumarate production with cow stomach bacteria to generate fumaric acid from sugar and CO₂. Together with the universities of Saarland, Marburg, and Kaiserslautern, the company heads a joint research project.

In March 2023, Danisco Animal Nutrition introduced AXTRA Prime, an enzyme mixture that promotes gut health, digestion of nutrients, and performance in pigs, which indicates the development of white biotechnology for animal feed.

White Biotechnology Market Report Scope:

Report Attributes Details

Market Size in 2023

USD 276.7 Billion 

Market Size by 2032

USD 558.7 Billion 

CAGR

CAGR of 8.1% From 2024 to 2032

Base Year

2023

Forecast Period

2024-2032

Historical Data

2020-2022

Report Scope & Coverage

Market Size, Segments Analysis, Competitive  Landscape, Regional Analysis, DROC & SWOT Analysis, Forecast Outlook

Key Segments

• By Type (Biofuels, Biochemicals, Biopolymers)
• By Application (Bioenergy, Food and Feed Additives, Pharmaceutical Ingredients, Personal Care Household Products, Others)

Regional Analysis/Coverage

North America (US, Canada, Mexico), Europe (Eastern Europe [Poland, Romania, Hungary, Turkey, Rest of Eastern Europe] Western Europe] Germany, France, UK, Italy, Spain, Netherlands, Switzerland, Austria, Rest of Western Europe]), Asia Pacific (China, India, Japan, South Korea, Vietnam, Singapore, Australia, Rest of Asia Pacific), Middle East & Africa (Middle East [UAE, Egypt, Saudi Arabia, Qatar, Rest of Middle East], Africa [Nigeria, South Africa, Rest of Africa], Latin America (Brazil, Argentina, Colombia, Rest of Latin America)

Company Profiles

DuPont de Nemours, Inc., Novozymes A/S, BASF SE, Koninklijke DSM N.V., Cargill, Inc., Archer Daniels Midland Company, Evonik Industries AG, Corbion N.V., Amyris, Inc., BioAmber Inc.

Frequently Asked Questions

Ans. The projected market size for the White Biotechnology Market is USD 558.7 Billion by 2032.

Ans: The Asia Pacific region is growing with the fastest CAGR in the White Biotechnology Market over the forecast period of 2024-2032.

Ans. The CAGR of the White Biotechnology Market is 8.1% During the forecast period of 2024-2032.

Ans:  The Strategic Initiatives provided under the White Biotechnology Market report,

  • Marketing and promotional activities
  • Distribution and supply chain strategies
  • Expansion plans and new product launches
  • Strategic partnerships and collaborations
  • Technological Advancements
  • Market Positioning and Branding

AnsThe Biofuels Type segment dominated the White Biotechnology Market in 2023.

Table Of Content:

1. Introduction

1.1 Market Definition

1.2 Scope (Inclusion and Exclusions)

1.3 Research Assumptions

2. Executive Summary

2.1 Market Overview

2.2 Regional Synopsis

2.3 Competitive Summary

3. Research Methodology

3.1 Top-Down Approach

3.2 Bottom-up Approach

3.3. Data Validation

3.4 Primary Interviews

4. Market Dynamics Impact Analysis

4.1 Market Driving Factors Analysis

4.1.2 Drivers

4.1.2 Restraints

4.1.3 Opportunities

4.1.4 Challenges

4.2 PESTLE Analysis

4.3 Porter’s Five Forces Model

5. Statistical Insights and Trends Reporting

5.1 Adoption Rates by Industry (2023)

5.2 Investment & R&D Expenditure (2023-2025)

5.3 Regulatory Compliance & Sustainability Impact (2023)

5.4 Patent & Innovation Trends (2023)

6. Competitive Landscape

6.1 List of Major Companies, By Region

6.2 Market Share Analysis, By Region

6.3 Product Benchmarking

6.3.1 Product specifications and features

6.3.2 Pricing

6.4 Strategic Initiatives

6.4.1 Marketing and promotional activities

6.4.2 Distribution and supply chain strategies

6.4.3 Expansion plans and new product launches

6.4.4 Strategic partnerships and collaborations

6.5 Technological Advancements

6.6 Market Positioning and Branding

7. White Biotechnology Market Segmentation, By Type

7.1 Chapter Overview

7.2 Biofuels

7.2.1 Biofuels Market Trends Analysis (2020-2032)

7.2.2 Biofuels Market Size Estimates and Forecasts to 2032 (USD Billion)

7.3 Biochemicals

7.3.1 Biochemicals Market Trends Analysis (2020-2032)

7.3.2 Biochemicals Market Size Estimates and Forecasts to 2032 (USD Billion)

7.4 Biopolymers

7.4.1 Biopolymers Market Trends Analysis (2020-2032)

7.4.2 Biopolymers Market Size Estimates and Forecasts to 2032 (USD Billion)

8. White Biotechnology Market Segmentation, By Application

8.1 Chapter Overview

8.2 Bioenergy

8.2.1 Bioenergy Market Trends Analysis (2020-2032)

8.2.2 Bioenergy Market Size Estimates and Forecasts to 2032 (USD Billion)

8.3 Food and Feed Additives

8.3.1 Food and Feed Additives Market Trends Analysis (2020-2032)

8.3.2 Food and Feed Additives Market Size Estimates and Forecasts to 2032 (USD Billion)

8.4 Pharmaceutical Ingredients

8.4.1 Pharmaceutical Ingredients Market Trends Analysis (2020-2032)

8.4.2 Pharmaceutical Ingredients Market Size Estimates and Forecasts to 2032 (USD Billion)

8.5 Personal Care Household Products

8.5.1 Personal Care Household Products Market Trends Analysis (2020-2032)

8.5.2 Personal Care Household Products Market Size Estimates and Forecasts to 2032 (USD Billion)

8.6 Others

8.6.1 Others Market Trends Analysis (2020-2032)

8.6.2 Others Market Size Estimates and Forecasts to 2032 (USD Billion)

9. Regional Analysis

9.1 Chapter Overview

9.2 North America

9.2.1 Trends Analysis

9.2.2 North America White Biotechnology Market Estimates and Forecasts, by Country (2020-2032) (USD Billion)

9.2.3 North America White Biotechnology Market Estimates and Forecasts, By Type (2020-2032) (USD Billion)  

9.2.4 North America White Biotechnology Market Estimates and Forecasts, By Application (2020-2032) (USD Billion)

9.2.5 USA

9.2.5.1 USA White Biotechnology Market Estimates and Forecasts, By Type (2020-2032) (USD Billion)

9.2.5.2 USA White Biotechnology Market Estimates and Forecasts, By Application (2020-2032) (USD Billion)

9.2.6 Canada

9.2.6.1 Canada White Biotechnology Market Estimates and Forecasts, By Type (2020-2032) (USD Billion)

9.2.6.2 Canada White Biotechnology Market Estimates and Forecasts, By Application (2020-2032) (USD Billion)

9.2.7 Mexico

9.2.7.1 Mexico White Biotechnology Market Estimates and Forecasts, By Type (2020-2032) (USD Billion)

9.2.7.2 Mexico White Biotechnology Market Estimates and Forecasts, By Application (2020-2032) (USD Billion)

9.3 Europe

9.3.1 Eastern Europe

9.3.1.1 Trends Analysis

9.3.1.2 Eastern Europe White Biotechnology Market Estimates and Forecasts, by Country (2020-2032) (USD Billion)

9.3.1.3 Eastern Europe White Biotechnology Market Estimates and Forecasts, By Type (2020-2032) (USD Billion)  

9.3.1.4 Eastern Europe White Biotechnology Market Estimates and Forecasts, By Application (2020-2032) (USD Billion)

9.3.1.5 Poland

9.3.1.5.1 Poland White Biotechnology Market Estimates and Forecasts, By Type (2020-2032) (USD Billion)

9.3.1.5.2 Poland White Biotechnology Market Estimates and Forecasts, By Application (2020-2032) (USD Billion)

9.3.1.6 Romania

9.3.1.6.1 Romania White Biotechnology Market Estimates and Forecasts, By Type (2020-2032) (USD Billion)

9.3.1.6.2 Romania White Biotechnology Market Estimates and Forecasts, By Application (2020-2032) (USD Billion)

9.3.1.7 Hungary

9.3.1.7.1 Hungary White Biotechnology Market Estimates and Forecasts, By Type (2020-2032) (USD Billion)

9.3.1.7.2 Hungary White Biotechnology Market Estimates and Forecasts, By Application (2020-2032) (USD Billion)

9.3.1.8 Turkey

9.3.1.8.1 Turkey White Biotechnology Market Estimates and Forecasts, By Type (2020-2032) (USD Billion)

9.3.1.8.2 Turkey White Biotechnology Market Estimates and Forecasts, By Application (2020-2032) (USD Billion)

9.3.1.9 Rest of Eastern Europe

9.3.1.9.1 Rest of Eastern Europe White Biotechnology Market Estimates and Forecasts, By Type (2020-2032) (USD Billion)

9.3.1.9.2 Rest of Eastern Europe White Biotechnology Market Estimates and Forecasts, By Application (2020-2032) (USD Billion)

9.3.2 Western Europe

9.3.2.1 Trends Analysis

9.3.2.2 Western Europe White Biotechnology Market Estimates and Forecasts, by Country (2020-2032) (USD Billion)

9.3.2.3 Western Europe White Biotechnology Market Estimates and Forecasts, By Type (2020-2032) (USD Billion)  

9.3.2.4 Western Europe White Biotechnology Market Estimates and Forecasts, By Application (2020-2032) (USD Billion)

9.3.2.5 Germany

9.3.2.5.1 Germany White Biotechnology Market Estimates and Forecasts, By Type (2020-2032) (USD Billion)

9.3.2.5.2 Germany White Biotechnology Market Estimates and Forecasts, By Application (2020-2032) (USD Billion)

9.3.2.6 France

9.3.2.6.1 France White Biotechnology Market Estimates and Forecasts, By Type (2020-2032) (USD Billion)

9.3.2.6.2 France White Biotechnology Market Estimates and Forecasts, By Application (2020-2032) (USD Billion)

9.3.2.7 UK

9.3.2.7.1 UK White Biotechnology Market Estimates and Forecasts, By Type (2020-2032) (USD Billion)

9.3.2.7.2 UK White Biotechnology Market Estimates and Forecasts, By Application (2020-2032) (USD Billion)

9.3.2.8 Italy

9.3.2.8.1 Italy White Biotechnology Market Estimates and Forecasts, By Type (2020-2032) (USD Billion)

9.3.2.8.2 Italy White Biotechnology Market Estimates and Forecasts, By Application (2020-2032) (USD Billion)

9.3.2.9 Spain

9.3.2.9.1 Spain White Biotechnology Market Estimates and Forecasts, By Type (2020-2032) (USD Billion)

9.3.2.9.2 Spain White Biotechnology Market Estimates and Forecasts, By Application (2020-2032) (USD Billion)

9.3.2.10 Netherlands

9.3.2.10.1 Netherlands White Biotechnology Market Estimates and Forecasts, By Type (2020-2032) (USD Billion)

9.3.2.10.2 Netherlands White Biotechnology Market Estimates and Forecasts, By Application (2020-2032) (USD Billion)

9.3.2.11 Switzerland

9.3.2.11.1 Switzerland White Biotechnology Market Estimates and Forecasts, By Type (2020-2032) (USD Billion)

9.3.2.11.2 Switzerland White Biotechnology Market Estimates and Forecasts, By Application (2020-2032) (USD Billion)

9.3.2.12 Austria

9.3.2.12.1 Austria White Biotechnology Market Estimates and Forecasts, By Type (2020-2032) (USD Billion)

9.3.2.12.2 Austria White Biotechnology Market Estimates and Forecasts, By Application (2020-2032) (USD Billion)

9.3.2.13 Rest of Western Europe

9.3.2.13.1 Rest of Western Europe White Biotechnology Market Estimates and Forecasts, By Type (2020-2032) (USD Billion)

9.3.2.13.2 Rest of Western Europe White Biotechnology Market Estimates and Forecasts, By Application (2020-2032) (USD Billion)

9.4 Asia Pacific

9.4.1 Trends Analysis

9.4.2 Asia Pacific White Biotechnology Market Estimates and Forecasts, by Country (2020-2032) (USD Billion)

9.4.3 Asia Pacific White Biotechnology Market Estimates and Forecasts, By Type (2020-2032) (USD Billion)  

9.4.4 Asia Pacific White Biotechnology Market Estimates and Forecasts, By Application (2020-2032) (USD Billion)

9.4.5 China

9.4.5.1 China White Biotechnology Market Estimates and Forecasts, By Type (2020-2032) (USD Billion)

9.4.5.2 China White Biotechnology Market Estimates and Forecasts, By Application (2020-2032) (USD Billion)

9.4.6 India

9.4.5.1 India White Biotechnology Market Estimates and Forecasts, By Type (2020-2032) (USD Billion)

9.4.5.2 India White Biotechnology Market Estimates and Forecasts, By Application (2020-2032) (USD Billion)

9.4.5 Japan

9.4.5.1 Japan White Biotechnology Market Estimates and Forecasts, By Type (2020-2032) (USD Billion)

9.4.5.2 Japan White Biotechnology Market Estimates and Forecasts, By Application (2020-2032) (USD Billion)

9.4.6 South Korea

9.4.6.1 South Korea White Biotechnology Market Estimates and Forecasts, By Type (2020-2032) (USD Billion)

9.4.6.2 South Korea White Biotechnology Market Estimates and Forecasts, By Application (2020-2032) (USD Billion)

9.4.7 Vietnam

9.4.7.1 Vietnam White Biotechnology Market Estimates and Forecasts, By Type (2020-2032) (USD Billion)

9.2.7.2 Vietnam White Biotechnology Market Estimates and Forecasts, By Application (2020-2032) (USD Billion)

9.4.8 Singapore

9.4.8.1 Singapore White Biotechnology Market Estimates and Forecasts, By Type (2020-2032) (USD Billion)

9.4.8.2 Singapore White Biotechnology Market Estimates and Forecasts, By Application (2020-2032) (USD Billion)

9.4.9 Australia

9.4.9.1 Australia White Biotechnology Market Estimates and Forecasts, By Type (2020-2032) (USD Billion)

9.4.9.2 Australia White Biotechnology Market Estimates and Forecasts, By Application (2020-2032) (USD Billion)

9.4.10 Rest of Asia Pacific

9.4.10.1 Rest of Asia Pacific White Biotechnology Market Estimates and Forecasts, By Type (2020-2032) (USD Billion)

9.4.10.2 Rest of Asia Pacific White Biotechnology Market Estimates and Forecasts, By Application (2020-2032) (USD Billion)

9.5 Middle East and Africa

9.5.1 Middle East

9.5.1.1 Trends Analysis

9.5.1.2 Middle East White Biotechnology Market Estimates and Forecasts, by Country (2020-2032) (USD Billion)

9.5.1.3 Middle East White Biotechnology Market Estimates and Forecasts, By Type (2020-2032) (USD Billion)  

9.5.1.4 Middle East White Biotechnology Market Estimates and Forecasts, By Application (2020-2032) (USD Billion)

9.5.1.5 UAE

9.5.1.5.1 UAE White Biotechnology Market Estimates and Forecasts, By Type (2020-2032) (USD Billion)

9.5.1.5.2 UAE White Biotechnology Market Estimates and Forecasts, By Application (2020-2032) (USD Billion)

9.5.1.6 Egypt

9.5.1.6.1 Egypt White Biotechnology Market Estimates and Forecasts, By Type (2020-2032) (USD Billion)

9.5.1.6.2 Egypt White Biotechnology Market Estimates and Forecasts, By Application (2020-2032) (USD Billion)

9.5.1.7 Saudi Arabia

9.5.1.7.1 Saudi Arabia White Biotechnology Market Estimates and Forecasts, By Type (2020-2032) (USD Billion)

9.5.1.7.2 Saudi Arabia White Biotechnology Market Estimates and Forecasts, By Application (2020-2032) (USD Billion)

9.5.1.8 Qatar

9.5.1.8.1 Qatar White Biotechnology Market Estimates and Forecasts, By Type (2020-2032) (USD Billion)

9.5.1.8.2 Qatar White Biotechnology Market Estimates and Forecasts, By Application (2020-2032) (USD Billion)

9.5.1.9 Rest of Middle East

9.5.1.9.1 Rest of Middle East White Biotechnology Market Estimates and Forecasts, By Type (2020-2032) (USD Billion)

9.5.1.9.2 Rest of Middle East White Biotechnology Market Estimates and Forecasts, By Application (2020-2032) (USD Billion)

9.5.2 Africa

9.5.2.1 Trends Analysis

9.5.2.2 Africa White Biotechnology Market Estimates and Forecasts, by Country (2020-2032) (USD Billion)

9.5.2.3 Africa White Biotechnology Market Estimates and Forecasts, By Type (2020-2032) (USD Billion)  

9.5.2.4 Africa White Biotechnology Market Estimates and Forecasts, By Application (2020-2032) (USD Billion)

9.5.2.5 South Africa

9.5.2.5.1 South Africa White Biotechnology Market Estimates and Forecasts, By Type (2020-2032) (USD Billion)

9.5.2.5.2 South Africa White Biotechnology Market Estimates and Forecasts, By Application (2020-2032) (USD Billion)

9.5.2.6 Nigeria

9.5.2.6.1 Nigeria White Biotechnology Market Estimates and Forecasts, By Type (2020-2032) (USD Billion)

9.5.2.6.2 Nigeria White Biotechnology Market Estimates and Forecasts, By Application (2020-2032) (USD Billion)

9.5.2.7 Rest of Africa

9.5.2.7.1 Rest of Africa White Biotechnology Market Estimates and Forecasts, By Type (2020-2032) (USD Billion)

9.5.2.7.2 Rest of Africa White Biotechnology Market Estimates and Forecasts, By Application (2020-2032) (USD Billion)

9.6 Latin America

9.6.1 Trends Analysis

9.6.2 Latin America White Biotechnology Market Estimates and Forecasts, by Country (2020-2032) (USD Billion)

9.6.3 Latin America White Biotechnology Market Estimates and Forecasts, By Type (2020-2032) (USD Billion)  

9.6.4 Latin America White Biotechnology Market Estimates and Forecasts, By Application (2020-2032) (USD Billion)

9.6.5 Brazil

9.6.5.1 Brazil White Biotechnology Market Estimates and Forecasts, By Type (2020-2032) (USD Billion)

9.6.5.2 Brazil White Biotechnology Market Estimates and Forecasts, By Application (2020-2032) (USD Billion)

9.6.6 Argentina

9.6.6.1 Argentina White Biotechnology Market Estimates and Forecasts, By Type (2020-2032) (USD Billion)

9.6.6.2 Argentina White Biotechnology Market Estimates and Forecasts, By Application (2020-2032) (USD Billion)

9.6.7 Colombia

9.6.7.1 Colombia White Biotechnology Market Estimates and Forecasts, By Type (2020-2032) (USD Billion)

9.6.7.2 Colombia White Biotechnology Market Estimates and Forecasts, By Application (2020-2032) (USD Billion)

9.6.8 Rest of Latin America

9.6.8.1 Rest of Latin America White Biotechnology Market Estimates and Forecasts, By Type (2020-2032) (USD Billion)

9.6.8.2 Rest of Latin America White Biotechnology Market Estimates and Forecasts, By Application (2020-2032) (USD Billion)

10. Company Profiles

10.1 DuPont de Nemours, Inc.

10.1.1 Company Overview

10.1.2 Financial

10.1.3 Products/ Services Offered

110.1.4 SWOT Analysis

10.2 Novozymes A/S

10.2.1 Company Overview

10.2.2 Financial

10.2.3 Products/ Services Offered

10.2.4 SWOT Analysis

10.3 BASF SE

10.3.1 Company Overview

10.3.2 Financial

10.3.3 Products/ Services Offered

10.3.4 SWOT Analysis

10.4 Koninklijke DSM N.V.

10.4.1 Company Overview

10.4.2 Financial

10.4.3 Products/ Services Offered

10.4.4 SWOT Analysis

10.5 Cargill, Inc.

10.5.1 Company Overview

10.5.2 Financial

10.5.3 Products/ Services Offered

10.5.4 SWOT Analysis

10.6 Archer Daniels Midland Company

10.6.1 Company Overview

10.6.2 Financial

10.6.3 Products/ Services Offered

10.6.4 SWOT Analysis

10.7 Evonik Industries AG

10.7.1 Company Overview

10.7.2 Financial

10.7.3 Products/ Services Offered

10.7.4 SWOT Analysis

10.8 Corbion N.V.

10.8.1 Company Overview

10.8.2 Financial

10.8.3 Products/ Services Offered

10.8.4 SWOT Analysis

10.9 Amyris, Inc.

10.9.1 Company Overview

10.9.2 Financial

10.9.3 Products/ Services Offered

10.9.4 SWOT Analysis

10.10 BioAmber Inc.

             10.9.1 Company Overview

10.9.2 Financial

10.9.3 Products/ Services Offered

10.9.4 SWOT Analysis

11. Use Cases and Best Practices

12. Conclusion

An accurate research report requires proper strategizing as well as implementation. There are multiple factors involved in the completion of good and accurate research report and selecting the best methodology to compete the research is the toughest part. Since the research reports we provide play a crucial role in any company’s decision-making process, therefore we at SNS Insider always believe that we should choose the best method which gives us results closer to reality. This allows us to reach at a stage wherein we can provide our clients best and accurate investment to output ratio.

Each report that we prepare takes a timeframe of 350-400 business hours for production. Starting from the selection of titles through a couple of in-depth brain storming session to the final QC process before uploading our titles on our website we dedicate around 350 working hours. The titles are selected based on their current market cap and the foreseen CAGR and growth.


The 5 steps process:

Step 1: Secondary Research:

Secondary Research or Desk Research is as the name suggests is a research process wherein, we collect data through the readily available information. In this process we use various paid and unpaid databases which our team has access to and gather data through the same. This includes examining of listed companies’ annual reports, Journals, SEC filling etc. Apart from this our team has access to various associations across the globe across different industries. Lastly, we have exchange relationships with various university as well as individual libraries.

Secondary Research

Step 2: Primary Research

When we talk about primary research, it is a type of study in which the researchers collect relevant data samples directly, rather than relying on previously collected data.  This type of research is focused on gaining content specific facts that can be sued to solve specific problems. Since the collected data is fresh and first hand therefore it makes the study more accurate and genuine.

We at SNS Insider have divided Primary Research into 2 parts.

Part 1 wherein we interview the KOLs of major players as well as the upcoming ones across various geographic regions. This allows us to have their view over the market scenario and acts as an important tool to come closer to the accurate market numbers. As many as 45 paid and unpaid primary interviews are taken from both the demand and supply side of the industry to make sure we land at an accurate judgement and analysis of the market.

This step involves the triangulation of data wherein our team analyses the interview transcripts, online survey responses and observation of on filed participants. The below mentioned chart should give a better understanding of the part 1 of the primary interview.

Primary Research

Part 2: In this part of primary research the data collected via secondary research and the part 1 of the primary research is validated with the interviews from individual consultants and subject matter experts.

Consultants are those set of people who have at least 12 years of experience and expertise within the industry whereas Subject Matter Experts are those with at least 15 years of experience behind their back within the same space. The data with the help of two main processes i.e., FGDs (Focused Group Discussions) and IDs (Individual Discussions). This gives us a 3rd party nonbiased primary view of the market scenario making it a more dependable one while collation of the data pointers.

Step 3: Data Bank Validation

Once all the information is collected via primary and secondary sources, we run that information for data validation. At our intelligence centre our research heads track a lot of information related to the market which includes the quarterly reports, the daily stock prices, and other relevant information. Our data bank server gets updated every fortnight and that is how the information which we collected using our primary and secondary information is revalidated in real time.

Data Bank Validation

Step 4: QA/QC Process

After all the data collection and validation our team does a final level of quality check and quality assurance to get rid of any unwanted or undesired mistakes. This might include but not limited to getting rid of the any typos, duplication of numbers or missing of any important information. The people involved in this process include technical content writers, research heads and graphics people. Once this process is completed the title gets uploader on our platform for our clients to read it.

Step 5: Final QC/QA Process:

This is the last process and comes when the client has ordered the study. In this process a final QA/QC is done before the study is emailed to the client. Since we believe in giving our clients a good experience of our research studies, therefore, to make sure that we do not lack at our end in any way humanly possible we do a final round of quality check and then dispatch the study to the client.


  •            5000 (33% Discount)


  •            8950 (40% Discount)


  •            3050 (23% Discount)

Start a Conversation

Hi! Click one of our member below to chat on Phone