Clean Label Mold Inhibitors Market Report Scope & Overview:
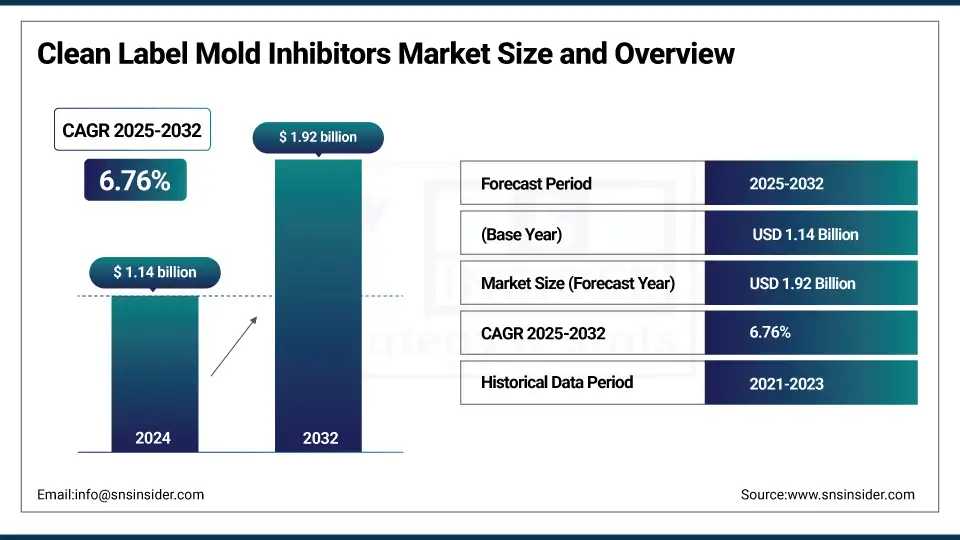
The Clean Label Mold Inhibitors market size was valued at USD 1.14 billion in 2024 and is expected to reach USD 1.92 billion by 2032, growing at a CAGR of 6.76% over the forecast period of 2025-2032.
The growth of clean label mold inhibitors in natural preservatives is highly induced by the consumer preference for label-friendly mold control and clean label preservatives. According to a report by USDA FAS, consumers now have greater awareness of health, wellness, and plant-based offerings, which has bolstered the clean label mold inhibitors market trends. Verdad Essence WH100 was introduced by companies like Corbion in April 2025, an effect on bakery mold inhibitors and shelf-life extension additives, as well as Kemin’s SHIELD V Plus Dry, featuring buffered vinegar and botanical extracts. By 2024, USDA approval covered 68 processors for clean labels, which reflected increasing market penetration. Trends to watch for include fermented ingredients like miso and apple cider vinegar that will contribute taste and natural mold inhibitors. Focus by USDA FSIS on labeling to promote honesty supports clean label mold inhibitors market study and spurs manufacturers to fabricate food-grade mold inhibitors and food-friendly additives, reinforcing the natural preservatives market and the plant-based mold inhibitors category.
To Get more information On Clean Label Mold Inhibitors Market - Request Free Sample Report
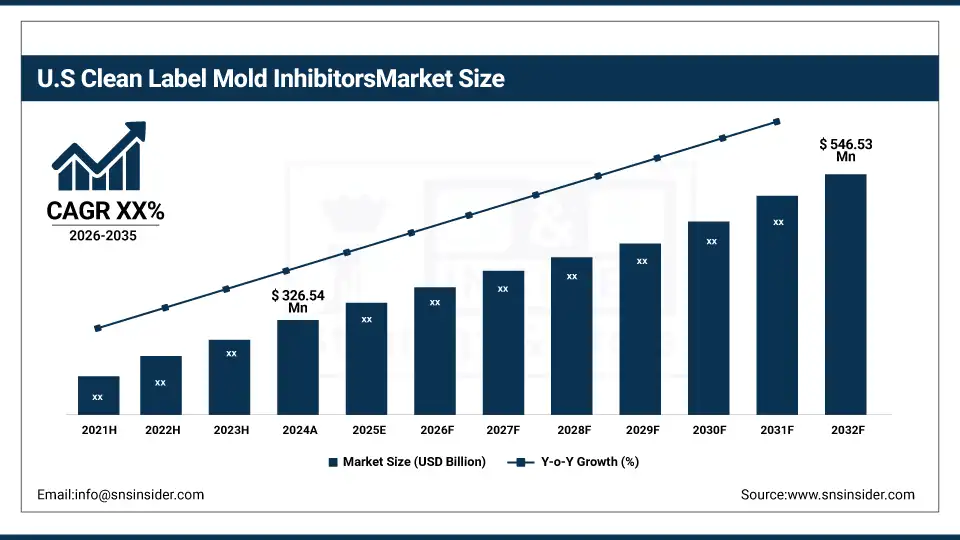
The U.S is the dominant country within North America with a market size of USD 326.54 million and is projected to reach a value of USD 546.53 million by 2032 with a market share of about 74%, owing to the strong demand for plant-based mold inhibitors and natural mold inhibitors used in baked food items and packaged food products. USDA National Organic Program guidelines support the adoption of clean label preservatives, and the top players in the clean label mold inhibitors market, such as Kemin Industries and Corbion, offer bakery mold inhibitors in their respective product lines. Moreover, the FDA clean label food additives ruling boosts confidence and supports the U.S. at the forefront of clean label mold inhibitors market trends, and extends the national natural preservatives market.
Market Dynamics:
Drivers:
-
Growing demand for plant-based mold inhibitors strengthens clean label food additives portfolio
Consumers are increasingly demanding clean label preservatives and natural mold inhibitors, with reports from the USDA indicating that 72% of consumers are more likely to buy products if they contain organic mold inhibitors. This trend is fueling the growth of the clean label mold inhibitors market and market share of bakery mold inhibitors and shelf life extension additives. Firms boost armies of plant-based mold inhibitors, incorporating vinegar and fermented starches to keep up with demand. This change is reflected in the clean label mold inhibitors market study and supports the larger natural preservatives market as more people look for food-grade mold inhibitors and label-friendly mold control options.”
-
Regulatory clarity boosts adoption of natural preservatives in food-grade mold inhibitors
The USDA Food Safety and Inspection Service revised label requirements in 20244 to provide consumers with additional information for natural preservatives and food-grade mold inhibitors. This regulatory emphasis will lead the clean label mold inhibitors market to reformulate products with organic mold inhibitors and plant-derived mold inhibitors. Thus, the trends of the clean label mold inhibitors market reveal increased market size as well as growing consumer preference. These advancements allow businesses to expand their share of the clean label mold inhibitors market by providing label-friendly mold control and by bringing clean label food additives in line with consumer expectations of transparency.
Restraints:
-
Complex approval processes delay clean label food additives innovation and adoption
The FDA mandates extensive testing for new, food-grade mold inhibitors, which is time-consuming and expensive. FDA approvals can take more than a year and cost hundreds of thousands of dollars, stalling clean label mold inhibitors industry growth, as per FDA statistics. Under such situations, small clean label mold inhibitors companies will hardly be able to launch natural preservatives market solutions. This hampers the innovation of bakery mold inhibitors and organic mold inhibitors, and thus hinders clean label mold inhibitors market growth analysis forecasts and the rate of introduction of novel plant-based mold inhibitors.
Segmentation Analysis:
By Type
Plant-based dominated the clean label mold inhibitors market in 2024 with 49.50% market share due to increased demand for label-friendly mold control and natural preservatives, market demand as supported by the USDA Agricultural Marketing Service data. Clean label mold inhibitors producers utilize starch and vinegar-based clean label food ingredients in bakery mold inhibitors due to their cost-effectiveness and consumer confidence. High demand for plant-based mold inhibitors induced the clean label mold inhibitors market size in food grade mold inhibitors and shelf life extension additives in bakeries and beverages applications.
Fermentation-based based are the fastest growing in the clean label mold inhibitors market in the forecast period with an estimated CAGR of 6.86%, propelled by advances in cultured blends of flours and fermented ingredients. The demand for organic mold inhibitors drives the growth of the clean label mold inhibitors market and is consistent with the natural preservatives market pattern, as per the USDA National Institute of Food and Agriculture. Clean label Mold Inhibitors market players are utilizing fermentation to improve the clean label food additives by adding fermented mold inhibitors and catering to the escalating preference for natural mold inhibitors among health-conscious consumers.
By Ingredient
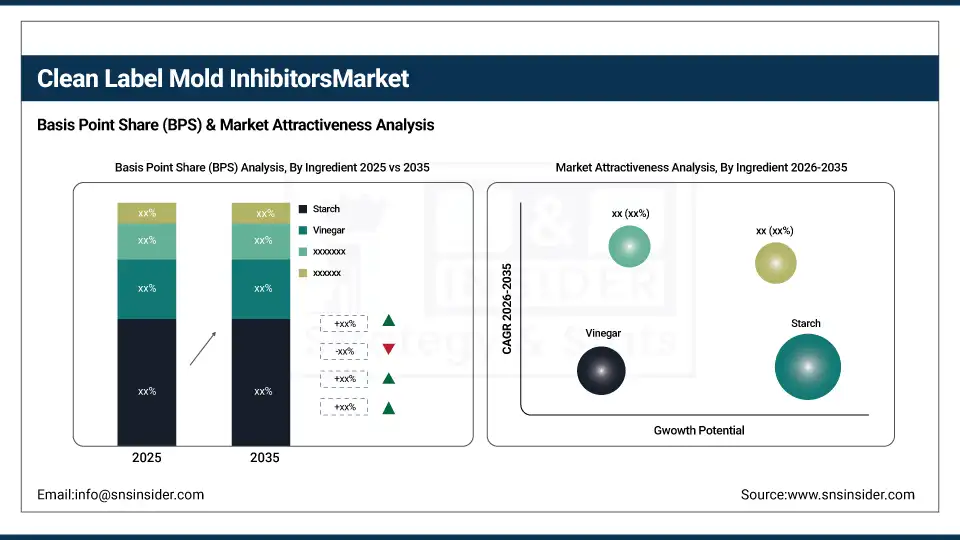
Starch dominated the clean label mold inhibitors market in 2024 with 30.20% market share, owing to being cost-effective and compatible with bakery mold inhibitors. Pentak offers what the US Department of Agriculture (USDA) Agricultural Marketing Service reports says is a leading clean label control against surface mold. Starch’s utility and ease of use position the ingredient to be highly appealing to clean label mold inhibitors companies targeting label-friendly mold control, which will continue to drive growth in food-grade mold inhibitors and shelf-life extension additives for bakery and sauces.
Fermented flour is the fastest growing in the clean label mold inhibitors market in the forecast period with an estimated CAGR of 7.34%, as a result of increasing demand for sourdough blends providing natural preservative benefits. According to the Organic Trade Association, growing consumer preference for organic mold inhibitors boosts the clean label mold inhibitors market. Clean Label Mold Inhibitors companies are focused on investing in fermentation-based solutions for bakery mold inhibitors, which will also provide a boost to clean label food additives innovation, as well as rising clean label mold inhibitors market research in health-driven applications.
By Form
Dry form dominated the clean label mold inhibitors market in 2024 with 67.40% market share, owing to longer shelf life and storage benefits. Demand for powdered bakery conditioners and sauces is driven by USDA Economic Research Service figures. Companies in the Clean Label Mold Inhibitors market are opting for dry plant-based mold inhibitors on account of processing convenience and cost effectiveness, further reinforcing the size and share of the clean label mold inhibitors market in food grade mold inhibitors and shelf life extension additives across multiple applications.
Liquid form is the fastest growing in the clean label mold inhibitors market in the forecast period, with an estimated CAGR of 6.88%, as they are more extensively used in vinegar solutions and botanical extracts. According to the FDA’s labeling guidelines, which promote transparency, several clean label mold inhibitors manufacturers are investing in liquid natural mold inhibitors. These offerings are easily incorporated into food processing lines, thereby underpinning the clean label mold inhibitors market value and penetration across beverages, sauces, and dressings, and supplementing clean label food additives product lines.
By End-use
Food & beverages dominated the clean label mold inhibitors market in 2024 with 52.20% market share, as there is a robust demand in bread, dairy, and sauces, as per USDA Agricultural Marketing Service data. Clean label mold inhibitors companies use label-friendly mold control and natural preservatives and meet consumers' requirements. The emphasis on clean label preservatives and plant-based mold inhibitors fuels the market size and share of the clean label mold inhibitors market globally on the basis of food-grade mold inhibitors and shelf life extension in high-consumption categories.
Pharmaceuticals is the fastest growing in the clean label mold inhibitors market in the forecast period with an estimated CAGR of 7.64%, due to the increasing demand for natural mold inhibitors in supplements and nutraceuticals. Emphasis on labels created by the FDA, favorable to plant-based mold-inhibitors and organic mold inhibitor market, is driving the growth of the clean label mold inhibitors market in this region. These players are expanding in the high-growth markets such as food, beverages, and health. This awareness fuels the growth of the clean label mold inhibitors market and underlies the clean label food additives innovation and the natural preservatives market at large.
By Distribution Channel
Direct sales dominated the clean label mold inhibitors market in 2024 with an estimated market share of 51.70% owing to the strong presence of food manufacturers demanding reliability and label-friendly mold control. Direct sales are favored by clean label mold inhibitors producers. As stated by the USDA Agricultural Marketing Service, clean label mold inhibitors makers have a preference for direct sales to comply with food-grade mold inhibitors specifications and clean label preservatives standards. This tactic reinforces the demand for natural mold inhibitors, plant-based mold inhibitors, and shelf life extension additives, thus boosting the clean label mold inhibitors market size in critical bakery and beverage applications.
Indirect sales are the fastest growing in the clean label mold inhibitors market with an estimated CAGR of 6.84%, led by distributors and wholesalers catering towards small to mid-scale businesses. The growing demand and direct use of Organic Mold Inhibitors, through a number of indirect distribution channels, is influenced by increased clean food product label regulations. Clean label mold inhibitors companies leverage these networks to extend the coverage of the natural preservatives market, leading to the growth of the clean label mold inhibitors market and providing the opportunity to deliver label-friendly mold control across a range of product segments.
Regional Analysis
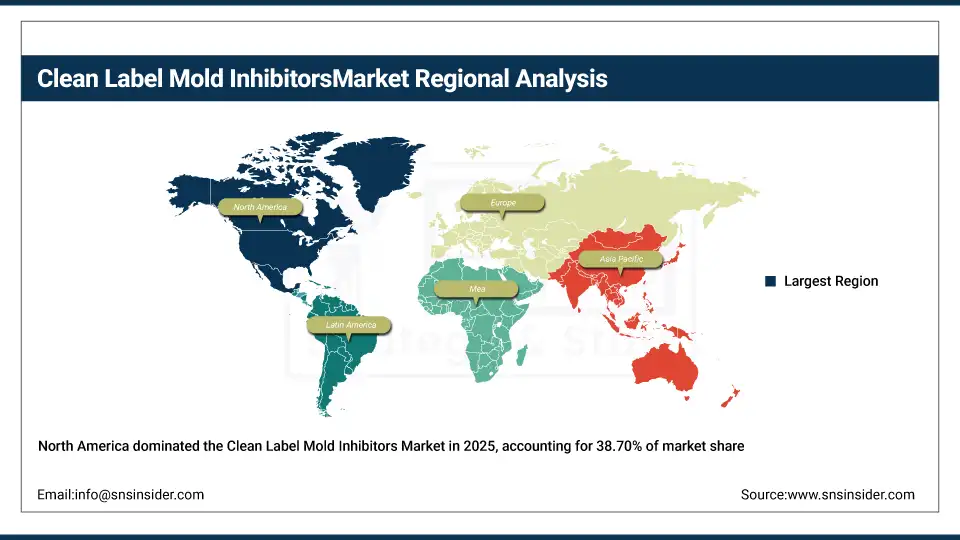
North America dominated the clean label mold inhibitors market in 2024 with a significant market share of 38.70%, owing to surging demand for natural preservatives as well as favorable legislation about clean label food additives. Focus of the region on food-grade mold inhibitors and label-friendly mold control for bakery mold inhibitors and for beverages further bolsters market reach, notes the USDA Agricultural Marketing Service. North America clean label mold inhibitors companies are reaping the profits from customer inclination toward organic mold inhibitors and shelf-life extension additives, thereby overshadowing clean label mold inhibitors market growth and increasing clean label mold inhibitors market size and share.
Get Customized Report as per Your Business Requirement - Enquiry Now
Asia Pacific is the fastest-growing region in the clean label mold inhibitors market from 2025 to 2032, with the highest CAGR of 7.24%, owing to a surge in demand for natural mold inhibitors and growing application of food-grade mold inhibitors. China is the front-runner with burgeoning investments in clean label food additives and shelf-life prolonging additives backed by government initiatives promoting food safety, resulting in the natural preservatives market expansion. India and Japan also contribute to the growth of the market by increasing demand for bakery mold inhibitors and the development of plant-based mold inhibitors.
Key Players:
The major clean label mold inhibitors market competitors include Kemin Industries, Inc., Corbion N.V., Lesaffre Corporation, Puratos Group, Kerry Group plc, Handary SA, J&K Ingredients, BioVeritas, Ribus, Inc., Shenzhen Leveking Bio-Engineering Co., Ltd., Niacet, Galactic, Hawkins, Inc., Kalsec Inc., Prinova Group, BTSA Biotecnologías Aplicadas, Sacco System, Eastman Chemical, DSM Food Specialties, and Galactic Food Group.
Recent Developments:
-
In April 2025, Corbion unveiled Verdad Essence WH100, a cultured wheat solution with predictive‑model enhancements for natural mold inhibition in breads
-
In April 2024, Millbio expanded its line with X‑Tra Guard Rowan Berry Extract, a gluten‑free, plant‑based mold inhibitor alternative to potassium sorbate
| Report Attributes | Details |
|---|---|
| Market Size in 2024 | USD 1.14 billion |
| Market Size by 2032 | USD 1.92 billion |
| CAGR | CAGR of 6.76% From 2025 to 2032 |
| Base Year | 2024 |
| Forecast Period | 2025-2032 |
| Historical Data | 2021-2023 |
| Report Scope & Coverage | Market Size, Segments Analysis, Competitive Landscape, Regional Analysis, DROC & SWOT Analysis, Forecast Outlook |
| Key Segments | •By Type (Plant based, Fermentation based, Others) •By Ingredient (Starch, Vinegar, Fermented Flour, Whey, Others) •By Form (Dry, Liquid) •By End-use (Food & Beverages, Animal Feed, Pharmaceuticals, Personal Care & Cosmetics, Others) •By Distribution Channel (Direct Sales, Indirect Sales [Retail, Distributors & Wholesalers, Others]) |
| Regional Analysis/Coverage | North America (US, Canada, Mexico), Europe (Germany, France, UK, Italy, Spain, Poland, Turkey, Rest of Europe), Asia Pacific (China, India, Japan, South Korea, Singapore, Australia, Rest of Asia Pacific), Middle East & Africa (UAE, Saudi Arabia, Qatar, South Africa, Rest of Middle East & Africa), Latin America (Brazil, Argentina, Rest of Latin America) |
| Company Profiles | Kemin Industries, Inc., Corbion N.V., Lesaffre Corporation, Puratos Group, Kerry Group plc, Handary SA, J&K Ingredients, BioVeritas, Ribus, Inc., Shenzhen Leveking Bio-Engineering Co., Ltd., Niacet, Galactic, Hawkins, Inc., Kalsec Inc., Prinova Group, BTSA Biotecnologías Aplicadas, Sacco System, Eastman Chemical, DSM Food Specialties, and Galactic Food Group |
Frequently Asked Questions
Growing demand for organic mold inhibitors, clean label preservatives, and label?friendly shelf life extension additives drives market trends.
Key natural mold inhibitors include plant?based starch, vinegar, fermented flour, and botanical extracts.
North America dominates with a 38.70% market share in 2024, followed by Europe holding 26.50%.
The clean label mold inhibitors market is projected to grow at a CAGR of 6.76% from 2025 to 2032.
The clean label mold inhibitors market size was valued at USD 1.14?billion globally in 2024.
Get in Touch
