Clean Technology Market Report Scope & Overview:
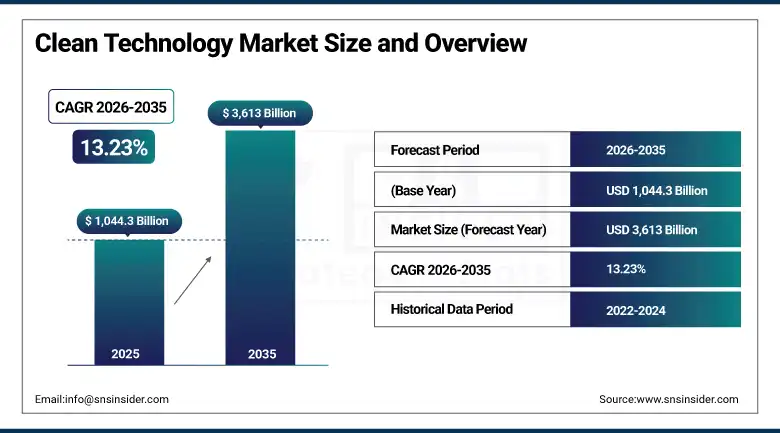
The Clean Technology Market was valued at USD 1,044.3 Billion in 2025 and is expected to reach USD 3,613 Billion by 2035, growing at a CAGR of 13.23% from 2026–2035.
The Clean Technology Market is currently witnessing considerable growth as a result of increased concern about reducing carbon emissions and adopting energy-efficient solutions for attaining sustainable development goals. Various countries are taking steps to adopt favorable policies, incentives, and investments that would speed up the use of renewables, EVs, energy storage solutions, and smart infrastructures. The growing demands for energy, environmental concerns, and regulation on greenhouse gases emissions are contributing to the growth of the market. Advancements in technology in relation to generating clean energy and carbon management solutions are making things more cost-effective and efficient.
According to the International Energy Agency (IEA), global renewable electricity capacity additions reached a record 666 GW in 2024, accounting for approximately 92.5% of total power capacity expansion worldwide, highlighting the accelerating deployment of clean energy technologies. The International Renewable Energy Agency (IRENA) reported that global renewable power capacity reached 4,448 GW in 2024, representing more than 46% of installed global power generation capacity and reinforcing the growing transition toward sustainable energy systems.
Clean Technology Market Size and Forecast
-
Market Size in 2026E: USD 1,182.4 Billion
-
Market Size by 2035: USD 3,613 Billion
-
CAGR: 13.23% from 2026 to 2035
-
Fastest Growing Region: North America
-
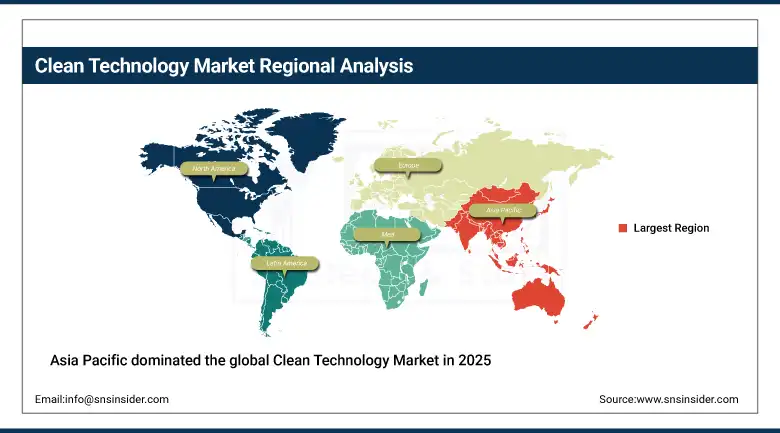
Largest Region: Asia Pacific
To Get more information On Clean Technology Market - Request Free Sample Report
Clean Technology Market Trends
-
Rising investments in renewable energy technologies and sustainable infrastructure projects to support global decarbonization goals
-
Growing adoption of energy-efficient solutions across industrial, commercial, and residential sectors to reduce energy consumption and operational costs
-
Increasing integration of artificial intelligence, IoT, and data analytics to optimize resource utilization, energy management, and environmental monitoring
-
Expanding deployment of electric vehicles, energy storage systems, and smart grid technologies to accelerate the transition toward low-carbon economies
-
Strengthening government regulations, carbon reduction targets, and sustainability initiatives driving innovation and adoption of clean technology solutions worldwide
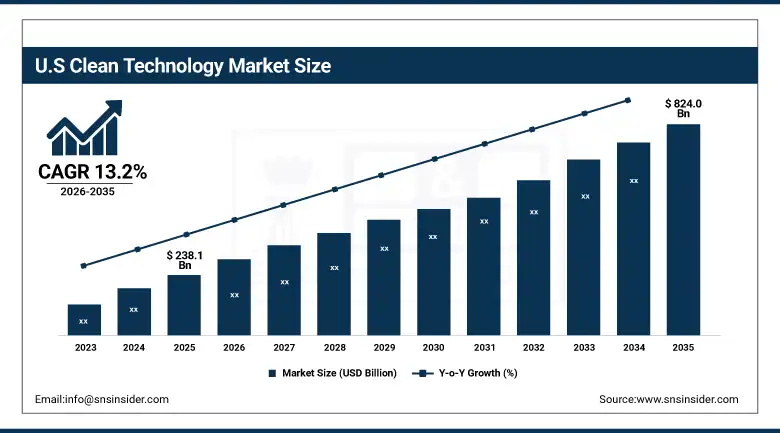
The U.S. Clean Technology Market Outlook
The U.S. Clean Technology Market was valued at approximately USD 238.1 Billion in 2025 and is expected to reach approximately USD 824.0 Billion by 2035, growing at a CAGR of approximately 13.2%.
The United States leads North American clean technology revenues through the Inflation Reduction Act’s USD 369 billion climate and clean energy investment that represents the most significant U.S. government clean technology market intervention in history, creating investment tax credits, production tax credits, and advanced manufacturing incentives whose commercial scale has triggered over USD 300 billion of private clean technology manufacturing investment since enactment.
According to the U.S. Energy Information Administration (EIA), renewable energy sources generated approximately 25% of total U.S. electricity in 2024, up from 21% in 2023, reflecting the increasing adoption of clean energy technologies across the power sector.
Clean Technology Market Segment Analysis
-
By Technology Type, Renewable Energy segment dominated the Clean Technology Market in 2025 with 41% share; Energy Storage segment is the fastest growing segment.
-
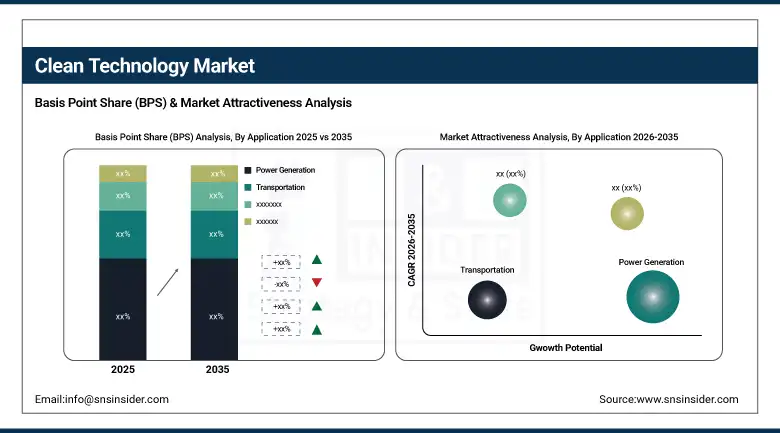
By Application, Power Generation segment dominated the market in 2025 with 46% share; Transportation segment is the fastest growing segment.
-
By End User, Utilities segment dominated the market in 2025 with 44% share; Commercial & Industrial segment is the fastest growing segment.
By Technology Type, renewable energy segment dominates the clean technology market, while energy storage segment is the fastest-growing segment
Renewable Energy dominated the Clean Technology Market due to rising investment in renewable energy sources like solar, wind, hydropower, etc., worldwide. There are initiatives being taken by governments and organizations towards promoting the use of renewable energy through favorable policies, incentives, and targets to reduce emissions of carbon. The falling cost of renewable technology and rising demand for clean energy are contributing to its growing acceptance. Its importance in terms of lowering greenhouse gases emissions and securing energy sources make it market leader.
Energy Storage is the fastest-growing segment due to the rising demand for efficient and flexible energy storage systems. Due to the increasing production capacity of renewable energy generation, the demand for battery energy storage systems has also gone up in order to deal with inconsistent power supply and energy grid stability. Advanced technology, decreased costs, and high investment levels in smart grids are some factors driving growth in this segment.
By Application, power generation segment dominates the clean technology market, while transportation segment is the fastest-growing segment
Power Generation dominated the market due to the presence of widely used clean energy sources that could generate sustainable energy through renewables. Increased energy needs, concerns about carbon emissions, and favorable government initiatives have led to increased investment in clean energy projects all around the world. Utilities and energy companies keep adding to their renewable energy production capabilities due to increasing environmental regulations. The use of renewable technologies at a very large scale has helped the industry secure its position.
Transportation is the fastest-growing application segment due to the wide adoption of electric and hybrid cars and fuels. Growing environmental standards, increasing fuel economy standards, and government policies are encouraging companies in this industry to focus on the production of more environmentally friendly products. Improvements in battery technologies and increased awareness among consumers about environmental issues are also driving market growth.
By End User, utilities segment dominates the clean technology market, while commercial & industrial segment is the fastest-growing segment
Utilities dominated the Clean Technology Market because utilities are the main users of renewable energy production, energy storage technologies, and grid technology improvements. Growing efforts to minimize carbon emissions and energy usage have compelled the utility companies to invest substantially. Utilities are the key players for facilitating renewable energy use and the provision of energy supply. Their large-scale projects will continue supporting their market leadership.
Commercial & Industrial is the fastest-growing end-user segment owing to sustainability considerations as well as reduced costs of energy consumption. Companies are now implementing renewable energy generation capacity and energy-saving techniques to meet their sustainable development goals and minimize dependence on energy from other sources. Companies' growing commitments to carbon neutrality and attractive financing conditions facilitate fast adoption of clean technology solutions among commercial and industrial organizations.
Regional Analysis
|
Region |
Major Country |
Share within Region, 2025 (%) |
|---|---|---|
|
Asia Pacific |
China |
52.4% |
|
North America |
United States |
82.5% |
|
Europe |
Germany |
22.4% |
|
Middle East & Africa |
UAE |
38.4% |
|
Latin America |
Brazil |
44.2% |
North America Clean Technology Market Insights
North America is the fastest-growing regional clean technology market, expanding at a CAGR exceeding 12.8% from 2025 to 2033, driven by the Inflation Reduction Act’s unprecedented USD 369 billion clean energy investment mobilisation that is simultaneously creating domestic manufacturing investment, accelerating renewable deployment through enhanced tax credits, and stimulating EV adoption through consumer purchase credits. The United States accounts for approximately 82.5% of North American revenues through utility-scale solar and wind procurement, onshore and emerging offshore wind development, and the world’s second-largest EV market after China.
The U.S. Department of Energy (DOE) reported that the United States installed approximately 50 GW of new solar capacity in 2024, marking the largest annual solar deployment in the country's history and highlighting strong investments in renewable energy infrastructure.
Europe Clean Technology Market Insights
Europe is a technically advanced clean technology market where the EU’s European Green Deal creating binding renewable energy targets, carbon pricing under the Emissions Trading System creating clean technology economic advantage, and the REPowerEU plan’s accelerated clean energy deployment following the 2022 energy supply crisis collectively sustain structured institutional procurement. Germany accounts for approximately 22.4% of European revenues through its leading offshore wind procurement, solar installation programme, and the industrial decarbonisation investment of its energy-intensive manufacturing sector.
According to the European Commission, renewable energy accounted for approximately 47% of the European Union's electricity generation in 2024, surpassing fossil fuel-based generation and highlighting the region’s accelerating transition toward clean energy sources.
The European Environment Agency (EEA) reported that EU greenhouse gas emissions were approximately 37% below 1990 levels while the economy continued to expand, demonstrating the effectiveness of clean technology adoption and decarbonization initiatives.
Asia Pacific Clean Technology Market Insights
Asia Pacific dominated the global Clean Technology Market in 2025, accounting for more than 40% of revenue share through China’s world-leading solar panel, wind turbine, and EV manufacturing capacity, India’s accelerating renewable energy deployment under its 500 GW non-fossil capacity target, and the progressive clean energy transition across Southeast Asia’s rapidly growing economies. China accounts for approximately 52.4% of Asia Pacific revenues through its dominance of global solar module manufacturing at approximately 95% of global supply, wind turbine production, and EV battery manufacturing capacity.
The National Energy Administration of China reported that the country added approximately 357 GW of renewable power capacity in 2024, including record levels of solar and wind installations, reinforcing its leadership in clean energy deployment.
According to the Ministry of New and Renewable Energy (MNRE), India surpassed 230 GW of installed non-fossil fuel electricity capacity in 2025, reflecting continued progress toward national decarbonization targets and supporting the expansion of the clean technology market.
Get Customized Report as per Your Business Requirement - Enquiry Now
MEA & Latin America Clean Technology Market Insights
The UAE leads MEA revenues at approximately 38.4% through its Mohammed Bin Rashid Al Maktoum Solar Park representing the world’s largest single-site solar project, the Barakah nuclear power plant’s clean electricity contribution, and Vision 2031’s clean energy and sustainability investment programme whose commercial scale is making the UAE an emerging clean technology deployment showcase. Saudi Arabia’s NEOM and Vision 2030 renewable energy projects and Egypt’s Benban solar park create growing regional clean technology procurement.
Brazil leads Latin American revenues at approximately 44.2% through its world-leading hydropower base, the rapidly growing onshore wind and solar energy deployment under Brazil’s clean energy auction programme, and the sustainable aviation fuel and green ethanol sectors whose bioenergy technology investment creates a distinctive Latin American clean technology strength. Chile’s green hydrogen ambition, Colombia’s growing solar deployment, and Mexico’s wind energy development create growing secondary regional market demand.
Market Dynamics
Growth Drivers: Inflation Reduction Act investments and declining solar and battery costs are accelerating clean technology adoption globally.
The clean technology market’s extraordinary growth rate is powered by the historical convergence of government policy ambition with commercial cost competitiveness whose simultaneous realisation is creating clean technology adoption at rates that neither policy push nor market pull alone could achieve. Solar photovoltaic’s 90% cost reduction since 2010, wind energy’s 70% cost reduction, and lithium-ion battery’s 90% cost reduction are creating clean technology options that compete favourably with fossil fuel alternatives purely on economic merit in most major markets, simultaneously transforming clean technology from a policy-dependent niche into a commercially self-sustaining growth sector.
The IRA’s USD 369 billion in clean energy subsidies, the EU’s European Green Deal investment, and equivalent national programmes across 190 countries provide financial acceleration that compounds the market momentum of cost-competitive clean technologies into unprecedented deployment velocity.
Restraints: Critical mineral supply constraints and inadequate grid infrastructure investments are slowing clean technology deployment.
Clean technology’s dependence on critical minerals including lithium, cobalt, nickel, copper, and rare earth elements whose supply is geographically concentrated in China, the DRC, and Chile creates supply chain vulnerability whose management requires geopolitical strategy, extraction investment, and recycling infrastructure development that cannot be accomplished within the short-term timelines that accelerated clean technology deployment requires. Each critical mineral supply constraint that creates price spikes, long-term contract scarcity, or supply chain disruption risk for battery manufacturers, EV producers, and clean energy equipment suppliers represents a systemic deployment bottleneck whose resolution requires sustained investment across multiple mineral development timelines.
Grid infrastructure investment requirements for renewable energy integration, whose transmission expansion, distribution modernisation, and grid stability technology costs are substantial and whose planning, permitting, and construction timelines extend 5 to 15 years, constrain deployment pace below the policy commitment timelines that climate targets require.
Opportunities: Green hydrogen scale-up and emerging market energy transitions are creating significant clean technology opportunities.
Green hydrogen production from renewable-powered electrolysis represents the most commercially significant clean technology frontier whose commercial development over the 2025 to 2035 period will determine whether the hard-to-abate sectors including steel, cement, ammonia production, aviation, and shipping can achieve the decarbonisation trajectories that net-zero commitments require. Each electrolyser cost reduction milestone, hydrogen pipeline infrastructure investment, and green ammonia production facility commissioned creates commercial evidence that progressively validates the business case for green hydrogen investment at the scale that industrial decarbonisation requires.
Emerging market clean energy leapfrogging, where developing economies in Sub-Saharan Africa, South Asia, and Southeast Asia bypass the fossil fuel infrastructure build-out that historical economic development pathways followed in favour of distributed solar and battery systems serving previously unelectrified communities, creates a new clean technology demand category whose commercial scale grows with each successful mini-grid and off-grid solar deployment.
Recent Developments:
-
2024: NextEra Energy Resources completed the 1 GW Manatee Energy Storage Centre in Florida, the world’s largest battery energy storage project at commissioning, demonstrating commercial maturity of utility-scale battery storage as a renewable grid firming infrastructure category.
-
2024: First Solar completed Ohio facility expansion adding 3.5 GW of annual CadTel thin-film panel production capacity, bringing domestic U.S. solar manufacturing to 10 GW annually and positioning as the largest solar manufacturer in the Western Hemisphere under IRA domestic content incentives.
-
2024: Vestas Wind Systems secured a 1.6 GW offshore wind turbine supply agreement for the Coastal Virginia Offshore Wind project, demonstrating the commercial scale of North American offshore wind market entry that creates sustained large turbine procurement above onshore wind baseline.
Clean Technology Market Key Players are:
-
Tesla, Inc.
-
NextEra Energy, Inc.
-
Enphase Energy, Inc.
-
First Solar, Inc.
-
Vestas Wind Systems A/S
-
Ørsted A/S
-
Siemens Energy AG
-
Schneider Electric SE
-
ABB Ltd.
-
GE Vernova Inc.
-
Bloom Energy Corporation
-
Plug Power Inc.
-
Ballard Power Systems Inc.
-
Brookfield Renewable Partners L.P.
-
Canadian Solar Inc.
-
SunPower Corporation
-
Iberdrola, S.A.
-
Johnson Controls International plc
-
Veolia Environnement S.A.
-
Sungrow Power Supply Co., Ltd.
Clean Technology Market Report Scope:
| Report Attributes | Details |
|---|---|
| Market Size in 2025 | USD 1,044.3 Billion |
| Market Size by 2035 | USD 3,613 Billion |
| CAGR | CAGR of 13.23% From 2026 to 2035 |
| Base Year | 2025 |
| Forecast Period | 2026-2035 |
| Historical Data | 2022-2024 |
| Report Scope & Coverage | Market Size, Segments Analysis, Competitive Landscape, Regional Analysis, DROC & SWOT Analysis, Forecast Outlook |
| Key Segments | • By Technology Type (Renewable Energy, Energy Storage, Electric Mobility, Water & Waste Management, Green Building, Carbon Capture & Storage, Others) • By Application (Power Generation, Transportation, Industrial, Commercial, Residential) • By End User (Government, Utilities, Commercial & Industrial, Residential) |
| Regional Analysis/Coverage | North America (US, Canada), Europe (Germany, UK, France, Italy, Spain, Russia, Poland, Rest of Europe), Asia Pacific (China, India, Japan, South Korea, Australia, ASEAN Countries, Rest of Asia Pacific), Middle East & Africa (UAE, Saudi Arabia, Qatar, South Africa, Rest of Middle East & Africa), Latin America (Brazil, Argentina, Mexico, Colombia, Rest of Latin America). |
| Company Profiles | Tesla, Inc., NextEra Energy, Inc., Enphase Energy, Inc., First Solar, Inc., Vestas Wind Systems A/S, Ørsted A/S, Siemens Energy AG, Schneider Electric SE, ABB Ltd., GE Vernova Inc., Bloom Energy Corporation, Plug Power Inc., Ballard Power Systems Inc., Brookfield Renewable Partners L.P., Canadian Solar Inc., SunPower Corporation, Iberdrola, S.A., Johnson Controls International plc, Veolia Environnement S.A., Sungrow Power Supply Co., Ltd. |
Frequently Asked Questions
The Clean Technology Market is expected to grow at a CAGR of 13.23% from 2026 to 2035.
The Clean Technology Market was valued at USD 1,044.3 Billion in 2025.
Government clean energy investments, falling solar and battery costs, renewable capacity expansion, and accelerating EV adoption are driving market growth.
The Renewable Energy segment dominated the Clean Technology Market.
Asia Pacific dominated the Clean Technology Market in 2025.
Get in Touch
