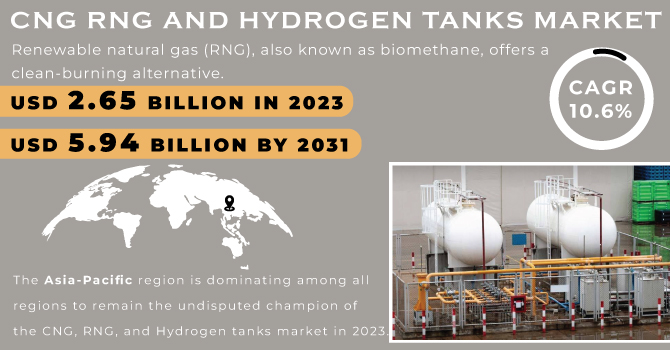
The CNG, RNG, and Hydrogen Tanks Market Size was valued at USD 2.65 billion in 2023 and is expected to reach USD 5.94 billion by 2031, and grow at a CAGR of 10.6% over the forecast period 2024-2031.
Renewable natural gas (RNG), also known as biomethane, offers a clean-burning alternative. They are Made from everyday waste like landfill scraps and livestock manure through a process called anaerobic digestion, RNG gets refined and injected directly into existing pipelines, making it a readily available fuel source. Compressed natural gas (CNG) steps up as a substitute for traditional fuels like gasoline, diesel, and LPG. CNG boasts lower emissions and, as a lighter-than-air gas, disperses quickly, minimizing environmental impact. But how do we store and transport these clean-burning gases, Enter specialized tanks Crafted from metal, carbon fiber, or glass, these tanks are champions of sustainability. They offer benefits like extended lifespan, reduced costs, and a smaller environmental footprint compared to traditional options. These tanks can be adapted to various applications and vehicle types based on the materials used in their construction. This flexibility makes them a key player in the clean energy transition.
Get More Information on CNG, RNG, and Hydrogen Tanks Market - Request Sample Report
Drivers
Enhancing tax breaks for CNG vehicles and infrastructure
Government support, subsidies, and mandates for cleaner transportation
Tax incentives have been a powerful tool for promoting CNG vehicles in regions like North America and Asia Pacific. For example, the US state of Oklahoma extended its tax credit program for CNG vehicles and refueling infrastructure in May 2019. This move, extending the credit until December 31, 2027, reinforces Oklahoma's position as a leader in the adoption of natural gas for transportation. The companies focusing on high-mileage, low-emission CNG vehicles can expect a surge in demand for their products, leading to cleaner air. This policy also benefits the state and its residents economically through tax breaks.
Restraint:
High Raw Material Costs Limit Economies of Scale in Composites
Limited infrastructure discourages and vehicles discourage infrastructure investment.
The composites market, and the industries it supplies, are known for fierce competition where cost reigns supreme. Businesses prioritize two key factors: operating expenses (OPEX) and capital expenditures (CAPEX). achieving economies of scale is challenging due to the high cost of raw materials and manufacturing processes. This creates a significant demand for cost-effective design and production technologies in the composites market.The high barrier to entry discourages new players. Carbon fiber and glass fiber, crucial materials for Type 3 and Type 4 CNG composite tanks, require substantial upfront investment. These expensive raw materials directly inflate the overall manufacturing cost of these tanks. Consequently, developing cost-efficient methods for producing carbon and glass fiber composites is a critical challenge for global manufacturers.
Opportunities
Growing demand light weight transportation tank in electric vehicles.
Expansion of Refueling Infrastructure over Hydrogen vehicle market
The hydrogen-powered and electric vehicles use electric motors for propulsion, and their energy storage methods differ significantly. Hydrogen cars utilize hydrogen gas stored in tanks, which is then converted into electricity via a fuel cell. Electric vehicles rely on traditional battery packs. A major hurdle hindering the widespread adoption of hydrogen cars is the high cost of their storage tanks. These tanks, typically for a 5kg capacity, range from USD 4,000 to 4,500, significantly inflating the overall vehicle price. Research efforts are currently focused on developing lightweight Class 4-cylinder carbon fiber tanks to address this challenge. These tanks aim to reduce costs by lowering the required gas storage pressure.
Challenges
The challenges and opportunities of hydrogen-powered vehicles
Fluctuating Energy Prices can impact economic viability of CNG and RNG
The Hydrogen-powered vehicles are gaining popularity in countries like South Korea and Japan, fueled by government subsidies and infrastructure investments. California, USA, also offers incentives for fuel cell vehicles. However, a debate exists regarding their environmental impact. While some consider creating hydrogen from natural gas sustainable, others argue that electric cars relying solely on batteries have a cleaner edge. Thankfully, research is underway to produce hydrogen from renewable sources. the lack of widespread refueling infrastructure limits their adoption. If significant advancements in hydrogen technology aren't made, electric vehicles could become the dominant clean transportation option.
The war in Ukraine disrupts the CNG, RNG, and Hydrogen Tanks Market in several ways. Sanctions and supply chain issues from key producers like Russia and Ukraine could cause price hikes and delays. However, the war may also present opportunities. Europe's need for energy security could push for a faster shift to alternative fuels like hydrogen and RNG, increasing demand for their storage tanks. Governments might also offer incentives for these fuels, further stimulating tank production. The overall impact is uncertain, but the war could accelerate the clean energy transition in the long run.
The impact of an economic downturn can squeeze the CNG, RNG, and Hydrogen Tanks Market. Consumers strapped for cash may delay buying new CNG, RNG, or hydrogen vehicles, reducing demand for tanks. Businesses might also postpone investments in refueling infrastructure, further dampening the market. Financing for large-scale projects could dry up, causing delays and impacting tank availability. Governments might offer incentives for clean transportation during downturns, boosting demand for these fuels and tanks.
By Gas Type
Compressed Natural Gas (CNG)
Renewable Natural Gas (RNG)
Hydrogen
Compressed Natural Gas (CNG) Sub-segments dominate the CNG, RNG, and Hydrogen Tanks market share in 2023 by gas type , both in terms of value and volume. This dominance stems from several factors For many automotive manufacturers worldwide, CNG tanks offer a long-term economic advantage compared to traditional fuel tanks. CNG vehicles equipped with these tanks contribute to a cleaner environment by emitting fewer greenhouse gases than gasoline or diesel alternatives. Many countries already have well-established CNG refueling infrastructure, making CNG a more readily available and convenient option. Government initiatives promoting the use of alternative fuels further propel the CNG tank market by incentivizing CNG adoption.
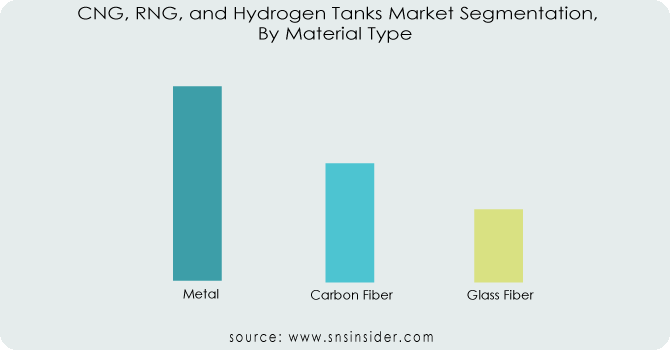
By Material Type
Metal
Glass Fiber
The Metal sub-segment by material type continues to hold the leading position in the global CNG, RNG, and hydrogen tanks market, it captures overall 55% of market share, and dominating both value and volume in 2023. This dominance can be attributed to two key factors Metal tanks are a breeze to manufacture, making them a budget-friendly option. This has led to their widespread use in the Asia Pacific, the Middle East, and Latin America. Type 1 tanks, constructed entirely from high-strength steel, are the current standard for metal tanks. However, the tide is starting to turn.
Get Customized Report as per your Business Requirement - Request For Customized Report
By Tank Type
Type 1
Type 2
Type 3
Type 4
Type 1 sub-segment by tank type, constructed entirely of metal, currently dominates the global CNG, RNG, and hydrogen tank market, capturing 43.2% of the market share in 2023. Their popularity stems from their widespread use in light-duty vehicles. Type 1 tanks offer robust performance, they are the most expensive option due to their all-metal construction. This also translates to significant weight, impacting vehicle fuel efficiency. players like Everest Kanto Cylinders Ltd. (India), Praxair Technologies Inc. (U.S.), and Faber Industries S.P.A. (Italy), are major participants in the Type 1 tank market. However, with the rise of composite materials offering lighter weight and potentially lower costs, the future of Type 1 tanks remains to be seen.
By Application
Fuel Tank
Transportation Tank
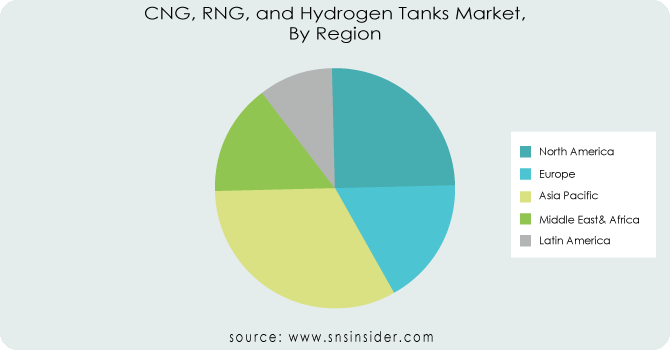
Regional Analysis
The Asia-Pacific region is dominating among all regions to remain the undisputed champion of the CNG, RNG, and Hydrogen tanks market in 2023. This dominance can be attributed to several factors: Asia-Pacific is a frontrunner when it comes to adopting clean energy initiatives. They're heavily invested in building sustainable transportation infrastructure, making them a prime market for clean gas storage solutions. The region boasts robust economic growth alongside a growing awareness of environmental issues. This confluence has accelerated the adoption of cleaner fuels, with CNG, RNG, and hydrogen playing a key role in their energy transition strategies.
REGIONAL COVERAGE:
North America
US
Canada
Mexico
Europe
Eastern Europe
Poland
Romania
Hungary
Turkey
Rest of Eastern Europe
Western Europe
Germany
France
UK
Italy
Spain
Netherlands
Switzerland
Austria
Rest of Western Europe
Asia Pacific
China
India
Japan
South Korea
Vietnam
Singapore
Australia
Rest of Asia Pacific
Middle East & Africa
Middle East
UAE
Egypt
Saudi Arabia
Qatar
Rest of the Middle East
Latin America
Brazil
Argentina
Colombia
Rest of Latin America
The major key players listed in the CNG, RNG, and Hydrogen Tanks Market are Worthington Industries, Inc. (US), Faber Industrie SpA (Italy), Luxfer Group (UK), Hexagon Composites ASA (Norway), Everest Kanto Cylinders Ltd. (India), Quantum Fuel Systems LLC. (US), Praxair Technologies Inc. (US), Avanco Group (Germany), Xinyi Beijing Tianhai Industry Co. Ltd. (China), Lianyungang Zhongfu Lianzhong Composites Group Co. Ltd. (China), and other player.
In May 2023, Luxfer Group debuted a groundbreaking Type 4 cylinder, the G-Stor Go H2. This advanced design boasts a reliable boss-to-liner interface, minimizing gas leakage. As a certified and cost-competitive hydrogen storage solution, the G-Stor Go H2 is perfectly suited for a variety of applications, including fuel-cell-powered buses, heavy-duty trucks, vans, bulk gas transport, boats, and even trains.
IN January 2023, Hexagon Purus marked a significant milestone in January 2023 with the opening of a brand new hydrogen cylinder manufacturing facility in Westminster, Maryland, USA. This state-of-the-art plant boasts the capacity to produce up to 10,000 cylinders annually, specifically designed for heavy-duty vehicle applications.
| Report Attributes | Details |
|---|---|
| Market Size in 2023 | US$ 2.65 Billion |
| Market Size by 2031 | US$ 5.94 Billion |
| CAGR | CAGR of 10.6% From 2024 to 2031 |
| Base Year | 2023 |
| Forecast Period | 2024-2031 |
| Historical Data | 2020-2022 |
| Report Scope & Coverage | Market Size, Segments Analysis, Competitive Landscape, Regional Analysis, DROC & SWOT Analysis, Forecast Outlook |
| Key Segments | • By Gas Type (Compressed Natural Gas (CNG), Hydrogen, Renewable Natural Gas (RNG)) • By Material Type (Metal, Carbon Fiber, Glass Fiber) • By Tank Type (Type 1, Type 2, Type 3, Type 4) • By Application (Fuel Tank, Transportation Tank) |
| Regional Analysis/Coverage |
North America (US, Canada, Mexico), Europe (Eastern Europe [Poland, Romania, Hungary, Turkey, Rest of Eastern Europe] Western Europe] Germany, France, UK, Italy, Spain, Netherlands, Switzerland, Austria, Rest of Western Europe]), Asia Pacific (China, India, Japan, South Korea, Vietnam, Singapore, Australia, Rest of Asia Pacific), Middle East & Africa (Middle East [UAE, Egypt, Saudi Arabia, Qatar, Rest of Middle East], Africa [Nigeria, South Africa, Rest of Africa], Latin America (Brazil, Argentina, Colombia Rest of Latin America |
| Company Profiles | Hexagon Composites ASA, Everest Kanto Cylinders Ltd.., Worthington Industries, Inc., Luxfer Group, Faber Industrie SpA, and other players. |
| DRIVERS | • Providing more tax breaks for CNG cars and infrastructure |
| Restraints | • High cost of tanks made of composite materials and government approvals |
Ans: Primary or secondary type of research done by this reports.
Ans: Type 1 CNG tanks are popular because they are widely used in light-duty vehicles and offer robust performance.
Ans: Manufacturers, Consultant, aftermarket players, association, Research institute, private and universities libraries, suppliers and distributors of the product.
Ans: Infrastructure for electric cars is already in place and working well are the challenges faced by the CNG, RNG, and Hydrogen Tanks Market.
Ans: Making transport tanks that aren't too heavy are the opportunity for CNG, RNG, and Hydrogen Tanks Market.
Ans. The projected market size for the CNG, RNG, and Hydrogen Tanks Market is USD 5.94 Billion by 2031.
TABLE OF CONTENTS
1. Introduction
1.1 Market Definition
1.2 Scope
1.3 Research Assumptions
2. Industry Flowchart
3. Research Methodology
4. Market Dynamics
4.1 Drivers
4.2 Restraints
4.3 Opportunities
4.4 Challenges
5. Impact Analysis
5.1 Impact of Russia-Ukraine Crisis
5.2 Impact of Economic Slowdown on Major Countries
5.2.1 Introduction
5.2.2 United States
5.2.3 Canada
5.2.4 Germany
5.2.5 France
5.2.6 UK
5.2.7 China
5.2.8 Japan
5.2.9 South Korea
5.2.10 India
6. Value Chain Analysis
7. Porter’s 5 Forces Model
8.Pest Analysis
9. Average Selling Price
9.1 North America
9.2 Europe
9.3 Asia Pacific
9.4 Latin America
9.5 Middle East & Africa
10. CNG, RNG, and Hydrogen Tanks Market, By Gas Type
10.1 Introduction
10.2 Trend Analysis
10.3 Compressed Natural Gas (CNG)
10.4 Renewable Natural Gas (RNG)
10.5 Hydrogen
11. CNG, RNG, and Hydrogen Tanks Market, By Material Type
11.1 Introduction
11.2 Trend Analysis
11.3 Metal
11.4 Carbon Fiber
11.5 Glass Fiber
12. CNG, RNG, and Hydrogen Tanks Market, By Application
12.1 Introduction
12.2 Trend Analysis
12.3 Fuel Tank
12.4 Transportation Tank
13. CNG, RNG, and Hydrogen Tanks Market, By Tank Type
13.1 Introduction
13.2 Trend Analysis
13.3 Type 1
13.4 Type 2
13.5 Type 3
13.6 Type 4
14. Regional Analysis
14.1 Introduction
14.2 North America
14.2.1 Trend Analysis
14.2.2 North America CNG, RNG, and Hydrogen Tanks Market by Country
14.2.3 North America CNG, RNG, and Hydrogen Tanks Market By Gas Type
14.2.4 North America CNG, RNG, and Hydrogen Tanks Market By Material Type
14.2.5 North America CNG, RNG, and Hydrogen Tanks Market By Application
14.2.6 North America CNG, RNG, and Hydrogen Tanks Market By Tank Type
14.2.7 USA
14.2.7.1 USA CNG, RNG, and Hydrogen Tanks Market By Gas Type
14.2.7.2 USA CNG, RNG, and Hydrogen Tanks Market By Material Type
14.2.7.3 USA CNG, RNG, and Hydrogen Tanks Market By Application
14.2.7.4 USA CNG, RNG, and Hydrogen Tanks Market By Tank Type
14.2.8 Canada
14.2.8.1 Canada CNG, RNG, and Hydrogen Tanks Market By Gas Type
14.2.8.2 Canada CNG, RNG, and Hydrogen Tanks Market By Material Type
14.2.8.3 Canada CNG, RNG, and Hydrogen Tanks Market By Application
14.2.8.4 Canada CNG, RNG, and Hydrogen Tanks Market By Tank Type
14.2.9 Mexico
14.2.9.1 Mexico CNG, RNG, and Hydrogen Tanks Market By Gas Type
14.2.9.2 Mexico CNG, RNG, and Hydrogen Tanks Market By Material Type
14.2.9.3 Mexico CNG, RNG, and Hydrogen Tanks Market By Application
14.2.9.4 Mexico CNG, RNG, and Hydrogen Tanks Market By Tank Type
14.3 Europe
14.3.1 Trend Analysis
14.3.2 Eastern Europe
14.3.2.1 Eastern Europe CNG, RNG, and Hydrogen Tanks Market by Country
14.3.2.2 Eastern Europe CNG, RNG, and Hydrogen Tanks Market By Gas Type
14.3.2.3 Eastern Europe CNG, RNG, and Hydrogen Tanks Market By Material Type
14.3.2.4 Eastern Europe CNG, RNG, and Hydrogen Tanks Market By Application
14.3.2.5 Eastern Europe CNG, RNG, and Hydrogen Tanks Market By Tank Type
14.3.2.6 Poland
14.3.2.6.1 Poland CNG, RNG, and Hydrogen Tanks Market By Gas Type
14.3.2.6.2 Poland CNG, RNG, and Hydrogen Tanks Market By Material Type
14.3.2.6.3 Poland CNG, RNG, and Hydrogen Tanks Market By Application
14.3.2.6.4 Poland CNG, RNG, and Hydrogen Tanks Market By Tank Type
14.3.2.7 Romania
14.3.2.7.1 Romania CNG, RNG, and Hydrogen Tanks Market By Gas Type
14.3.2.7.2 Romania CNG, RNG, and Hydrogen Tanks Market By Material Type
14.3.2.7.3 Romania CNG, RNG, and Hydrogen Tanks Market By Application
14.3.2.7.4 Romania CNG, RNG, and Hydrogen Tanks Market By Tank Type
14.3.2.8 Hungary
14.3.2.8.1 Hungary CNG, RNG, and Hydrogen Tanks Market By Gas Type
14.3.2.8.2 Hungary CNG, RNG, and Hydrogen Tanks Market By Material Type
14.3.2.8.3 Hungary CNG, RNG, and Hydrogen Tanks Market By Application
14.3.2.8.4 Hungary CNG, RNG, and Hydrogen Tanks Market By Tank Type
14.3.2.9 Turkey
14.3.2.9.1 Turkey CNG, RNG, and Hydrogen Tanks Market By Gas Type
14.3.2.9.2 Turkey CNG, RNG, and Hydrogen Tanks Market By Material Type
14.3.2.9.3 Turkey CNG, RNG, and Hydrogen Tanks Market By Application
14.3.2.9.4 Turkey CNG, RNG, and Hydrogen Tanks Market By Tank Type
14.3.2.10 Rest of Eastern Europe
14.3.2.10.1 Rest of Eastern Europe CNG, RNG, and Hydrogen Tanks Market By Gas Type
14.3.2.10.2 Rest of Eastern Europe CNG, RNG, and Hydrogen Tanks Market By Material Type
14.3.2.10.3 Rest of Eastern Europe CNG, RNG, and Hydrogen Tanks Market By Application
14.3.2.10.4 Rest of Eastern Europe CNG, RNG, and Hydrogen Tanks Market By Tank Type
14.3.3 Western Europe
14.3.3.1 Western Europe CNG, RNG, and Hydrogen Tanks Market by Country
14.3.3.2 Western Europe CNG, RNG, and Hydrogen Tanks Market By Gas Type
14.3.3.3 Western Europe CNG, RNG, and Hydrogen Tanks Market By Material Type
14.3.3.4 Western Europe CNG, RNG, and Hydrogen Tanks Market By Application
14.3.3.5 Western Europe CNG, RNG, and Hydrogen Tanks Market By Tank Type
14.3.3.6 Germany
14.3.3.6.1 Germany CNG, RNG, and Hydrogen Tanks Market By Gas Type
14.3.3.6.2 Germany CNG, RNG, and Hydrogen Tanks Market By Material Type
14.3.3.6.3 Germany CNG, RNG, and Hydrogen Tanks Market By Application
14.3.3.6.4 Germany CNG, RNG, and Hydrogen Tanks Market By Tank Type
14.3.3.7 France
14.3.3.7.1 France CNG, RNG, and Hydrogen Tanks Market By Gas Type
14.3.3.7.2 France CNG, RNG, and Hydrogen Tanks Market By Material Type
14.3.3.7.3 France CNG, RNG, and Hydrogen Tanks Market By Application
14.3.3.7.4 France CNG, RNG, and Hydrogen Tanks Market By Tank Type
14.3.3.8 UK
14.3.3.8.1 UK CNG, RNG, and Hydrogen Tanks Market By Gas Type
14.3.3.8.2 UK CNG, RNG, and Hydrogen Tanks Market By Material Type
14.3.3.8.3 UK CNG, RNG, and Hydrogen Tanks Market By Application
14.3.3.8.4 UK CNG, RNG, and Hydrogen Tanks Market By Tank Type
14.3.3.9 Italy
14.3.3.9.1 Italy CNG, RNG, and Hydrogen Tanks Market By Gas Type
14.3.3.9.2 Italy CNG, RNG, and Hydrogen Tanks Market By Material Type
14.3.3.9.3 Italy CNG, RNG, and Hydrogen Tanks Market By Application
14.3.3.9.4 Italy CNG, RNG, and Hydrogen Tanks Market By Tank Type
14.3.3.10 Spain
14.3.3.10.1 Spain CNG, RNG, and Hydrogen Tanks Market By Gas Type
14.3.3.10.2 Spain CNG, RNG, and Hydrogen Tanks Market By Material Type
14.3.3.10.3 Spain CNG, RNG, and Hydrogen Tanks Market By Application
14.3.3.10.4 Spain CNG, RNG, and Hydrogen Tanks Market By Tank Type
14.3.3.11 Netherlands
14.3.3.11.1 Netherlands CNG, RNG, and Hydrogen Tanks Market By Gas Type
14.3.3.11.2 Netherlands CNG, RNG, and Hydrogen Tanks Market By Material Type
14.3.3.11.3 Netherlands CNG, RNG, and Hydrogen Tanks Market By Application
14.3.3.11.4 Netherlands CNG, RNG, and Hydrogen Tanks Market By Tank Type
14.3.3.12 Switzerland
14.3.3.12.1 Switzerland CNG, RNG, and Hydrogen Tanks Market By Gas Type
14.3.3.12.2 Switzerland CNG, RNG, and Hydrogen Tanks Market By Material Type
14.3.3.12.3 Switzerland CNG, RNG, and Hydrogen Tanks Market By Application
14.3.3.12.4 Switzerland CNG, RNG, and Hydrogen Tanks Market By Tank Type
14.3.3.14 Austria
14.3.3.14.1 Austria CNG, RNG, and Hydrogen Tanks Market By Gas Type
14.3.3.14.2 Austria CNG, RNG, and Hydrogen Tanks Market By Material Type
14.3.3.14.3 Austria CNG, RNG, and Hydrogen Tanks Market By Application
14.3.3.14.4 Austria CNG, RNG, and Hydrogen Tanks Market By Tank Type
14.3.3.14 Rest of Western Europe
14.3.3.14.1 Rest of Western Europe CNG, RNG, and Hydrogen Tanks Market By Gas Type
14.3.3.14.2 Rest of Western Europe CNG, RNG, and Hydrogen Tanks Market By Material Type
14.3.3.14.3 Rest of Western Europe CNG, RNG, and Hydrogen Tanks Market By Application
14.3.3.14.4 Rest of Western Europe CNG, RNG, and Hydrogen Tanks Market By Tank Type
14.4 Asia-Pacific
14.4.1 Trend Analysis
14.4.2 Asia-Pacific CNG, RNG, and Hydrogen Tanks Market by Country
14.4.3 Asia-Pacific CNG, RNG, and Hydrogen Tanks Market By Gas Type
14.4.4 Asia-Pacific CNG, RNG, and Hydrogen Tanks Market By Material Type
14.4.5 Asia-Pacific CNG, RNG, and Hydrogen Tanks Market By Application
14.4.6 Asia-Pacific CNG, RNG, and Hydrogen Tanks Market By Tank Type
14.4.7 China
14.4.7.1 China CNG, RNG, and Hydrogen Tanks Market By Gas Type
14.4.7.2 China CNG, RNG, and Hydrogen Tanks Market By Material Type
14.4.7.3 China CNG, RNG, and Hydrogen Tanks Market By Application
14.4.7.4 China CNG, RNG, and Hydrogen Tanks Market By Tank Type
14.4.8 India
14.4.8.1 India CNG, RNG, and Hydrogen Tanks Market By Gas Type
14.4.8.2 India CNG, RNG, and Hydrogen Tanks Market By Material Type
14.4.8.3 India CNG, RNG, and Hydrogen Tanks Market By Application
14.4.8.4 India CNG, RNG, and Hydrogen Tanks Market By Tank Type
14.4.9 Japan
14.4.9.1 Japan CNG, RNG, and Hydrogen Tanks Market By Gas Type
14.4.9.2 Japan CNG, RNG, and Hydrogen Tanks Market By Material Type
14.4.9.3 Japan CNG, RNG, and Hydrogen Tanks Market By Application
14.4.9.4 Japan CNG, RNG, and Hydrogen Tanks Market By Tank Type
14.4.10 South Korea
14.4.10.1 South Korea CNG, RNG, and Hydrogen Tanks Market By Gas Type
14.4.10.2 South Korea CNG, RNG, and Hydrogen Tanks Market By Material Type
14.4.10.3 South Korea CNG, RNG, and Hydrogen Tanks Market By Application
14.4.10.4 South Korea CNG, RNG, and Hydrogen Tanks Market By Tank Type
14.4.11 Vietnam
14.4.11.1 Vietnam CNG, RNG, and Hydrogen Tanks Market By Gas Type
14.4.11.2 Vietnam CNG, RNG, and Hydrogen Tanks Market By Material Type
14.4.11.3 Vietnam CNG, RNG, and Hydrogen Tanks Market By Application
14.4.11.4 Vietnam CNG, RNG, and Hydrogen Tanks Market By Tank Type
14.4.12 Singapore
14.4.12.1 Singapore CNG, RNG, and Hydrogen Tanks Market By Gas Type
14.4.12.2 Singapore CNG, RNG, and Hydrogen Tanks Market By Material Type
14.4.12.3 Singapore CNG, RNG, and Hydrogen Tanks Market By Application
14.4.12.4 Singapore CNG, RNG, and Hydrogen Tanks Market By Tank Type
14.4.14 Australia
14.4.14.1 Australia CNG, RNG, and Hydrogen Tanks Market By Gas Type
14.4.14.2 Australia CNG, RNG, and Hydrogen Tanks Market By Material Type
14.4.14.3 Australia CNG, RNG, and Hydrogen Tanks Market By Application
14.4.14.4 Australia CNG, RNG, and Hydrogen Tanks Market By Tank Type
14.4.14 Rest of Asia-Pacific
14.4.14.1 Rest of Asia-Pacific CNG, RNG, and Hydrogen Tanks Market By Gas Type
14.4.14.2 Rest of Asia-Pacific CNG, RNG, and Hydrogen Tanks Market By Material Type
14.4.14.3 Rest of Asia-Pacific CNG, RNG, and Hydrogen Tanks Market By Application
14.4.14.4 Rest of Asia-Pacific CNG, RNG, and Hydrogen Tanks Market By Tank Type
14.5 Middle East & Africa
14.5.1 Trend Analysis
14.5.2 Middle East
14.5.2.1 Middle East CNG, RNG, and Hydrogen Tanks Market by Country
14.5.2.2 Middle East CNG, RNG, and Hydrogen Tanks Market By Gas Type
14.5.2.3 Middle East CNG, RNG, and Hydrogen Tanks Market By Material Type
14.5.2.4 Middle East CNG, RNG, and Hydrogen Tanks Market By Application
14.5.2.5 Middle East CNG, RNG, and Hydrogen Tanks Market By Tank Type
14.5.2.6 UAE
14.5.2.6.1 UAE CNG, RNG, and Hydrogen Tanks Market By Gas Type
14.5.2.6.2 UAE CNG, RNG, and Hydrogen Tanks Market By Material Type
14.5.2.6.3 UAE CNG, RNG, and Hydrogen Tanks Market By Application
14.5.2.6.4 UAE CNG, RNG, and Hydrogen Tanks Market By Tank Type
14.5.2.7 Egypt
14.5.2.7.1 Egypt CNG, RNG, and Hydrogen Tanks Market By Gas Type
14.5.2.7.2 Egypt CNG, RNG, and Hydrogen Tanks Market By Material Type
14.5.2.7.3 Egypt CNG, RNG, and Hydrogen Tanks Market By Application
14.5.2.7.4 Egypt CNG, RNG, and Hydrogen Tanks Market By Tank Type
14.5.2.8 Saudi Arabia
14.5.2.8.1 Saudi Arabia CNG, RNG, and Hydrogen Tanks Market By Gas Type
14.5.2.8.2 Saudi Arabia CNG, RNG, and Hydrogen Tanks Market By Material Type
14.5.2.8.3 Saudi Arabia CNG, RNG, and Hydrogen Tanks Market By Application
14.5.2.8.4 Saudi Arabia CNG, RNG, and Hydrogen Tanks Market By Tank Type
14.5.2.9 Qatar
14.5.2.9.1 Qatar CNG, RNG, and Hydrogen Tanks Market By Gas Type
14.5.2.9.2 Qatar CNG, RNG, and Hydrogen Tanks Market By Material Type
14.5.2.9.3 Qatar CNG, RNG, and Hydrogen Tanks Market By Application
14.5.2.9.4 Qatar CNG, RNG, and Hydrogen Tanks Market By Tank Type
14.5.2.10 Rest of Middle East
14.5.2.10.1 Rest of Middle East CNG, RNG, and Hydrogen Tanks Market By Gas Type
14.5.2.10.2 Rest of Middle East CNG, RNG, and Hydrogen Tanks Market By Material Type
14.5.2.10.3 Rest of Middle East CNG, RNG, and Hydrogen Tanks Market By Application
14.5.2.10.4 Rest of Middle East CNG, RNG, and Hydrogen Tanks Market By Tank Type
14.5.3 Africa
14.5.3.1 Africa CNG, RNG, and Hydrogen Tanks Market by Country
14.5.3.2 Africa CNG, RNG, and Hydrogen Tanks Market By Gas Type
14.5.3.3 Africa CNG, RNG, and Hydrogen Tanks Market By Material Type
14.5.3.4 Africa CNG, RNG, and Hydrogen Tanks Market By Application
14.5.3.5 Africa CNG, RNG, and Hydrogen Tanks Market By Tank Type
14.5.3.6 Nigeria
14.5.3.6.1 Nigeria CNG, RNG, and Hydrogen Tanks Market By Gas Type
14.5.3.6.2 Nigeria CNG, RNG, and Hydrogen Tanks Market By Material Type
14.5.3.6.3 Nigeria CNG, RNG, and Hydrogen Tanks Market By Application
14.5.3.6.4 Nigeria CNG, RNG, and Hydrogen Tanks Market By Tank Type
14.5.3.7 South Africa
14.5.3.7.1 South Africa CNG, RNG, and Hydrogen Tanks Market By Gas Type
14.5.3.7.2 South Africa CNG, RNG, and Hydrogen Tanks Market By Material Type
14.5.3.7.3 South Africa CNG, RNG, and Hydrogen Tanks Market By Application
14.5.3.7.4 South Africa CNG, RNG, and Hydrogen Tanks Market By Tank Type
14.5.3.8 Rest of Africa
14.5.3.8.1 Rest of Africa CNG, RNG, and Hydrogen Tanks Market By Gas Type
14.5.3.8.2 Rest of Africa CNG, RNG, and Hydrogen Tanks Market By Material Type
14.5.3.8.3 Rest of Africa CNG, RNG, and Hydrogen Tanks Market By Application
14.5.3.8.4 Rest of Africa CNG, RNG, and Hydrogen Tanks Market By Tank Type
14.6 Latin America
14.6.1 Trend Analysis
14.6.2 Latin America CNG, RNG, and Hydrogen Tanks Market by country
14.6.3 Latin America CNG, RNG, and Hydrogen Tanks Market By Gas Type
14.6.4 Latin America CNG, RNG, and Hydrogen Tanks Market By Material Type
14.6.5 Latin America CNG, RNG, and Hydrogen Tanks Market By Application
14.6.6 Latin America CNG, RNG, and Hydrogen Tanks Market By Tank Type
14.6.7 Brazil
14.6.7.1 Brazil CNG, RNG, and Hydrogen Tanks Market By Gas Type
14.6.7.2 Brazil CNG, RNG, and Hydrogen Tanks Market By Material Type
14.6.7.3 Brazil CNG, RNG, and Hydrogen Tanks Market By Application
14.6.7.4 Brazil CNG, RNG, and Hydrogen Tanks Market By Tank Type
14.6.8 Argentina
14.6.8.1 Argentina CNG, RNG, and Hydrogen Tanks Market By Gas Type
14.6.8.2 Argentina CNG, RNG, and Hydrogen Tanks Market By Material Type
14.6.8.3 Argentina CNG, RNG, and Hydrogen Tanks Market By Application
14.6.8.4 Argentina CNG, RNG, and Hydrogen Tanks Market By Tank Type
14.6.9 Colombia
14.6.9.1 Colombia CNG, RNG, and Hydrogen Tanks Market By Gas Type
14.6.9.2 Colombia CNG, RNG, and Hydrogen Tanks Market By Material Type
14.6.9.3 Colombia CNG, RNG, and Hydrogen Tanks Market By Application
14.6.9.4 Colombia CNG, RNG, and Hydrogen Tanks Market By Tank Type
14.6.10 Rest of Latin America
14.6.10.1 Rest of Latin America CNG, RNG, and Hydrogen Tanks Market By Gas Type
14.6.10.2 Rest of Latin America CNG, RNG, and Hydrogen Tanks Market By Material Type
14.6.10.3 Rest of Latin America CNG, RNG, and Hydrogen Tanks Market By Application
14.6.10.4 Rest of Latin America CNG, RNG, and Hydrogen Tanks Market By Tank Type
15. Company Profiles
15.1 Worthington Industries, Inc. (US)
15.1.1 Company Overview
15.1.2 Financial
15.1.3 Products/ Services Offered
15.1.4 SWOT Analysis
15.1.5 The SNS View
15.2 Faber Industrie SpA (Italy)
15.2.1 Company Overview
15.2.2 Financial
15.2.3 Products/ Services Offered
15.2.4 SWOT Analysis
15.2.5 The SNS View
15.3 Luxfer Group (UK)
15.3.1 Company Overview
15.3.2 Financial
15.3.3 Products/ Services Offered
15.3.4 SWOT Analysis
15.3.5 The SNS View
15.4 Hexagon Composites ASA (Norway)
15.4.1 Company Overview
15.4.2 Financial
15.4.3 Products/ Services Offered
15.4.4 SWOT Analysis
15.4.5 The SNS View
15.5 Everest Kanto Cylinders Ltd. (India)
15.5.1 Company Overview
15.5.2 Financial
15.5.3 Products/ Services Offered
15.5.4 SWOT Analysis
15.5.5 The SNS View
15.6 Quantum Fuel Systems LLC. (US)
15.6.1 Company Overview
15.6.2 Financial
15.6.3 Products/ Services Offered
15.6.4 SWOT Analysis
15.6.5 The SNS View
15.7 Avanco Group (Germany)
15.7.1 Company Overview
15.7.2 Financial
15.7.3 Products/ Services Offered
15.7.4 SWOT Analysis
15.7.5 The SNS View
15.8 Xinyi Beijing
15.8.1 Company Overview
15.8.2 Financial
15.8.3 Products/ Services Offered
15.8.4 SWOT Analysis
15.8.5 The SNS View
15.9 lianyungang zhongfu lianzhong composites group co. Ltd. (china)
15.9.1 Company Overview
15.9.2 Financial
15.9.3 Products/ Services Offered
15.9.4 SWOT Analysis
15.9.5 The SNS View
15.10 Tianhai Industry Co. Ltd. (China)
15.10.1 Company Overview
15.10.2 Financial
15.10.3 Products/ Services Offered
15.10.4 SWOT Analysis
15.10.5 The SNS View
16. Competitive Landscape
16.1 Competitive Benchmarking
16.2 Market Share Analysis
16.3 Recent Developments
16.3.1 Industry News
16.3.2 Company News
16.3.3 Mergers & Acquisitions
17. Use Case and Best Practices
18. Conclusion
An accurate research report requires proper strategizing as well as implementation. There are multiple factors involved in the completion of good and accurate research report and selecting the best methodology to compete the research is the toughest part. Since the research reports we provide play a crucial role in any company’s decision-making process, therefore we at SNS Insider always believe that we should choose the best method which gives us results closer to reality. This allows us to reach at a stage wherein we can provide our clients best and accurate investment to output ratio.
Each report that we prepare takes a timeframe of 350-400 business hours for production. Starting from the selection of titles through a couple of in-depth brain storming session to the final QC process before uploading our titles on our website we dedicate around 350 working hours. The titles are selected based on their current market cap and the foreseen CAGR and growth.
The 5 steps process:
Step 1: Secondary Research:
Secondary Research or Desk Research is as the name suggests is a research process wherein, we collect data through the readily available information. In this process we use various paid and unpaid databases which our team has access to and gather data through the same. This includes examining of listed companies’ annual reports, Journals, SEC filling etc. Apart from this our team has access to various associations across the globe across different industries. Lastly, we have exchange relationships with various university as well as individual libraries.

Step 2: Primary Research
When we talk about primary research, it is a type of study in which the researchers collect relevant data samples directly, rather than relying on previously collected data. This type of research is focused on gaining content specific facts that can be sued to solve specific problems. Since the collected data is fresh and first hand therefore it makes the study more accurate and genuine.
We at SNS Insider have divided Primary Research into 2 parts.
Part 1 wherein we interview the KOLs of major players as well as the upcoming ones across various geographic regions. This allows us to have their view over the market scenario and acts as an important tool to come closer to the accurate market numbers. As many as 45 paid and unpaid primary interviews are taken from both the demand and supply side of the industry to make sure we land at an accurate judgement and analysis of the market.
This step involves the triangulation of data wherein our team analyses the interview transcripts, online survey responses and observation of on filed participants. The below mentioned chart should give a better understanding of the part 1 of the primary interview.

Part 2: In this part of primary research the data collected via secondary research and the part 1 of the primary research is validated with the interviews from individual consultants and subject matter experts.
Consultants are those set of people who have at least 12 years of experience and expertise within the industry whereas Subject Matter Experts are those with at least 15 years of experience behind their back within the same space. The data with the help of two main processes i.e., FGDs (Focused Group Discussions) and IDs (Individual Discussions). This gives us a 3rd party nonbiased primary view of the market scenario making it a more dependable one while collation of the data pointers.
Step 3: Data Bank Validation
Once all the information is collected via primary and secondary sources, we run that information for data validation. At our intelligence centre our research heads track a lot of information related to the market which includes the quarterly reports, the daily stock prices, and other relevant information. Our data bank server gets updated every fortnight and that is how the information which we collected using our primary and secondary information is revalidated in real time.

Step 4: QA/QC Process
After all the data collection and validation our team does a final level of quality check and quality assurance to get rid of any unwanted or undesired mistakes. This might include but not limited to getting rid of the any typos, duplication of numbers or missing of any important information. The people involved in this process include technical content writers, research heads and graphics people. Once this process is completed the title gets uploader on our platform for our clients to read it.
Step 5: Final QC/QA Process:
This is the last process and comes when the client has ordered the study. In this process a final QA/QC is done before the study is emailed to the client. Since we believe in giving our clients a good experience of our research studies, therefore, to make sure that we do not lack at our end in any way humanly possible we do a final round of quality check and then dispatch the study to the client.
Polyolefin Market size was valued at USD 256.35 billion in 2023 and is expected to grow to USD 385.55 billion by 2031 and grow at a CAGR of 5.2% over the forecast period of 2024-2031.
The Biocomposites Market was valued at USD 32.59 billion in 2023 and is supposed to reach USD 105.38 billion by 2031. It is expected to grow at a CAGR of 15.8% over the forecast period 2024-2031.
The Squalene Market size was valued at USD 150.26 million in 2023 and is expected to grow to USD 341.24 million by 2031 and grow at a CAGR of 10.8% over the forecast period of 2024-2031.
Calcium Hypochlorite Market Size was valued at USD 780.29 million in 2023. It is projected to reach USD 1806.35 million by 2031 and grow at a CAGR of 11.06% over the forecast period 2024-2031.
The Fertilizers Market size was USD 203.99 billion in 2022 and is expected to Reach USD 283.49 billion by 2030 and grow at a CAGR of 4.2% over the forecast period of 2023-2030.
The Cashew Nutshell Liquid Market Size was valued at USD 3.76 billion in 2022, and expected to reach USD 6.76 billion by 2030, and grow at a CAGR of 7.6% over the forecast period 2023-2030.

Hi! Click one of our member below to chat on Phone
© 2024 All Rights Reserved by SNS Insider Pvt Ltd