Fertilizers Market Report Scope and Overview:
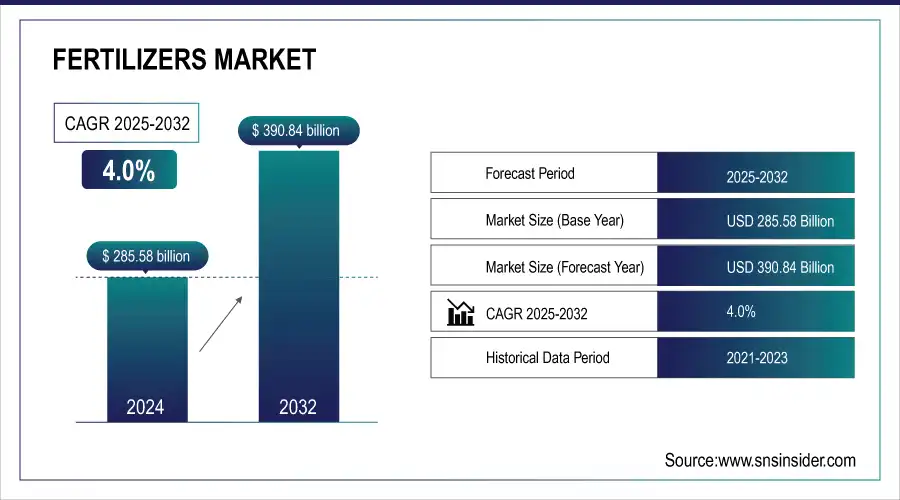
The Fertilizers Market Size was valued at USD 285.58 Billion in 2024 and is expected to reach USD 390.84 Billion by 2032, growing at a CAGR of 4.0% over the forecast period 2025-2032.
Growing global food demand as a result of population growth, urbanization, and changing dietary habits toward more calorie- and nutrient-dense foods continues to drive the fertilizers market. Such growth is crucial, as the United Nations estimates the world population will increase to 9.8 billion by 2050, and agricultural productivity will need to more than double to meet the demand. Fertilizer consumption globally grew by 4.5% to around 210 million metric tons this year, as measured in metric tons, according to the Food and Agriculture Organization (FAO). This increase has shown the dependency on fertilizers in augmenting crop yields and keeping soil fertile for an ever-growing global population.

Get E-PDF Sample Report on Fertilizers Market - Request Sample Report
Fertilizers Market Size and Forecast:
-
Market Size in 2024 – USD 285.58 Billion
-
Market Size by 2032 – USD 390.84 Billion
-
CAGR – 4.0% from 2025 to 2032
-
Base Year – 2024
-
Forecast Period – 2025 to 2032
-
Historical Data – 2021 to 2023
Fertilizers Market Highlights:
-
Government support and subsidies are driving fertilizer demand, e.g., India allocated $26 billion in 2023–2024, while the U.S. sees increased fertilizer efficiency through precision agriculture.
-
Growing global population (projected 9.7 billion by 2050) and urbanization are increasing the need for higher crop yields, making fertilizers essential for food security.
-
Precision agriculture and sustainable alternatives like organic and bio-based fertilizers are improving nutrient efficiency, reducing waste, and supporting climate targets.
-
Environmental concerns and stricter regulations are shifting the market toward bio-based and specialty fertilizers with reduced ecological impact.
-
Emerging markets, especially in Africa and Asia, are seeing accelerated fertilizer adoption through initiatives like the African Fertilizer Financing Mechanism and government programs.
-
Market growth is restrained by geopolitical tensions, high energy costs, supply chain challenges, and regulatory requirements to reduce soil and water pollution, increasing production costs for conventional fertilizers.
Supportive policies and subsidies from governments around the world are also accelerating this growth. India announced $26 billion in fertilizer subsidies in 2023-2024, to shield farmers from costs of this critical input. Likewise, in the U.S., the Department of Agriculture estimated that technological advancements in precision agriculture are resulting in increased fertilizer application rates of about 3.2%. Collectively, these technologies allow farmers to apply fertilizers more efficiently, which minimizes waste and enhances productivity. Other sustainable production methods including organic and bio-based fertilizers have picked up too. These alternatives are in accordance with climate targets outlined in international agreements and stimulate the transition towards sustainable agriculture. In summary, all of these factors together ensure continuous demand for fertilizers making them an essential part of modern agricultural production systems.
Fertilizers Market Drivers:
-
Environmental concerns and stricter regulations on chemical fertilizers are driving the shift toward bio-based and specialty fertilizers, which offer improved nutrient efficiency and reduced ecological impact.
The worldwide population is projected to grow to around 9.7 billion in 2050, putting huge stress on agricultural systems to ensure food supply. Urbanization exacerbates this dilemma by decreasing the amount of arable land and necessitating greater intensification of available farmland. Hence, the need for fertilizers has become critical to increase the yield of crops to meet the food requirements. As an example, the FAO mentions that world cereal demand is expected to increase by more than 50% by the middle of the century, mainly due to increased consumption in developing economies. Agricultural intensification efforts in India are also reflected in government-run programs encouraging the use of fertilizers, like the PM-Kisan, which subsidizes essential inputs in agriculture.
Moreover, the increasingly popular precision agriculture methods let farmers use fertilizers more efficiently, thus minimizing wastage. A report by the International Fertilizer Association (IFA) reveals that nitrogen fertilizers continue to make up the most usage, especially in Asia where rice, wheat, and maize are staple crops. And among emerging markets such as Africa, fertilizer adoption is also accelerating. The African Union's "Africa Fertilizer Financing Mechanism" seeks for a 50% increase in access to fertilizers for smallholder farmers by 2030, to help raise levels of agricultural productivity. They highlight the importance of fertilizers in meeting the challenges of global food security as population pressures and demand patterns are changing rapidly.
Fertilizers Market Restraints:
-
Geopolitical tensions, high energy costs, and global supply chain challenges are causing fluctuations in raw material availability and prices, which hinder market growth and profitability.
Stringent environmental regulations to reduce the soil & water pollution impact of conventional fertilizers have posed serious threats to the global fertilizers market. As a result, both governments and environmental organizations have pointed out environmental problems related to chemical fertilizers, including the pollution of free water by runoff, soil depletion, and greenhouse gas emissions during production and as a result of application. Consequently, numerous nations have implemented stringent regulations that limit the application of nitrogen- and phosphorus-containing fertilizers. For example, to mitigate nitrogen losses to surface water, the EU's Common Agricultural Policy has caps on N application rates. Staying in line with these regulations calls for expensive changes in the production process as well as research on whether it is replaced by greener possible alternatives. Although these regulations are very important for better agricultural systems in the future, they become additional operation difficulties and will lower the profit rates of conventional fertilizer manufacturers. Thus, the industry is challenged to switch on bio-based or specialty fertilizers that can comply with the lending regulatory frameworks.
Fertilizers Market Segment Analysis:
By Form
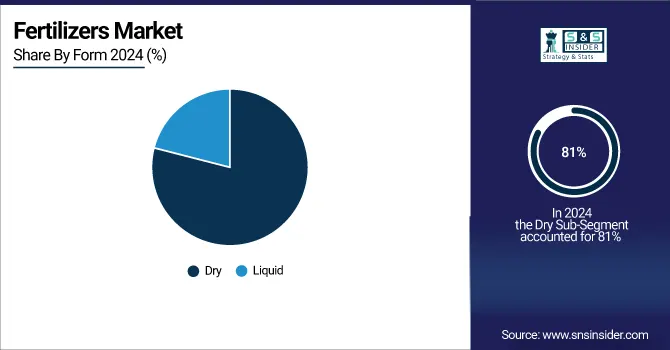
In 2024, the dry fertilizers segment emerged as the leading form in the global market, commanding an 81% share. This dominance is primarily due to the advantages dry fertilizers offer, including cost-effectiveness, easier transportation, and longer shelf life compared to liquid fertilizers. These features make them particularly attractive for large-scale farming operations that rely on mechanized application methods. Dry fertilizers are also easier to store, allowing farmers to manage their inventory efficiently, especially in regions with limited storage infrastructure.
Government policies have further bolstered the adoption of dry fertilizers. For example, Brazil's Ministry of Agriculture introduced a subsidy program in mid-2023 to make dry fertilizers more accessible to smallholder farmers. The scheme enables farmers, including those from the poorest of communities, to access these high-quality fertilizers, thus enhancing their yield. Furthermore, due to their compatibility with almost all crops and farming practices, dry fertilizers are versatile, which contributes to their extensive application. Technological advancements, including slow-release and coated fertilizers to improve nutrient use efficiency and reduce leaching, further host the growth of the segment. These innovations closely connect with productivity challenges globally to increase sustainable agricultural practices without sacrificing production. The demand for adherence to pay-per-use nutrients provided by the dry fertilizers segment is a projected factor supporting the segment to dominate the market during the forecast period as farmers continue to look for cost-effective, reliable solutions for their nutrient management needs.

By Application
The agriculture segment held the highest revenue share in the fertilizers market in 2024. This is due to the growing demand for increased yield on crops to feed the food demands of the growing population and shifting consumption trends. For instance, the FAO reports that in 2023, around 72% of the worldwide fertilizer so far utilized was for agricultural uses, particularly for grains, fruits, and vegetables. This emphasizes the importance of fertilizer to improve agricultural productivity and face the constraints of limited land and the variability of the climate.
The agriculture segment has resulted in government initiatives as a major contributor. The Green Deal policy in the European Union advocates for sustainable farming practices that involve the right way of using fertilizers to minimize harm to the environment. Likewise, the reported 5% rise in the amount of fertilizer applied to China's agricultural lands in 2023, as per China's Ministry of Agriculture, is also in line with state-sponsored investments in high-yield crops, and more recently, precision-farming technologies. The essential goal of these measures is maximizing resource efficiency while maintaining food security. Additionally, the creation of targeted fertilizers has optimized the precision of fertilizer application for varying crop requirements. Such innovations help farmers to gain maximum yield at minimum costs and fertilizers have now become an integral part of modern farming. The agriculture segment is the most lucrative as it plays an important role in the global food chain and it has a high dependency on fertilizers to support growing populations.
By Product
In 2024, the segment for organic fertilizers led the market, accounting for a revenue share of 71%. This growth is driven by the increasing demand for organic food products as well as rising awareness of environmental sustainability. Organic fertilizers are made from organic materials, like compost, manure, and plant residues, which contain plenty of essential nutrients and contribute to soil fitness. The development of these fertilizers is being popularized as many consumers and manufacturers have started migrating towards eco-friendly farming practices to minimize the ecological dangers of traditional farming.
This segment has been driven by government support. The United Nations Environment Programme (UNEP) reported a 7% annual growth in organic fertilizer usage in 2023, supported by policies encouraging sustainable farming. India, for example, is implementing its Paramparagat Krishi Vikas Yojana (PKVY) program in which over 1.8 million farmers have been trained for organic agriculture, receiving subsidies and market support for organic fertilizers. Likewise, the European Union's Farm to Fork strategy has adopted targets that call for a 20% reduction in chemical fertilizer use by 2030, creating additional public pressure for the uptake of organic alternatives.
Fertilizers Market Regional Analysis:
Asia-Pacific Fertilizers Market Trends:
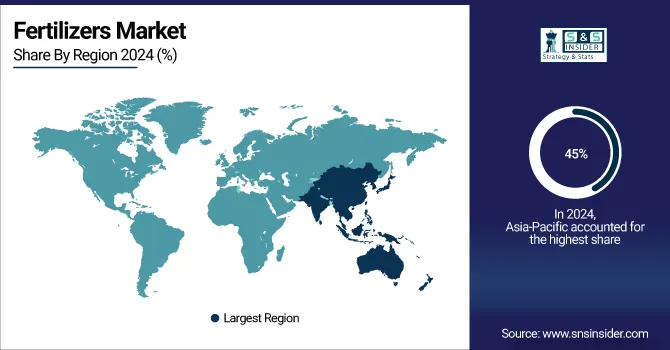
In 2024, the fertilizers market was still dominated by the Asia-Pacific region, with a 45% share of the global market. The primary reason for this leadership is the large agricultural activity and cultivated land within the region which is supporting to meet the higher crop yield demand to feed and sustain its increasing population. India and China lead the effort with government regulations to increase access to fertilizers and support their efficient consumption. For instance, India allocated over $26 billion in subsidies for fertilizers in 2023 to support its farmers and ensure food security. Likewise, fertilizer use has continued increasing in China, fueled by ongoing investment in modern agricultural technology and crop nutrient management.
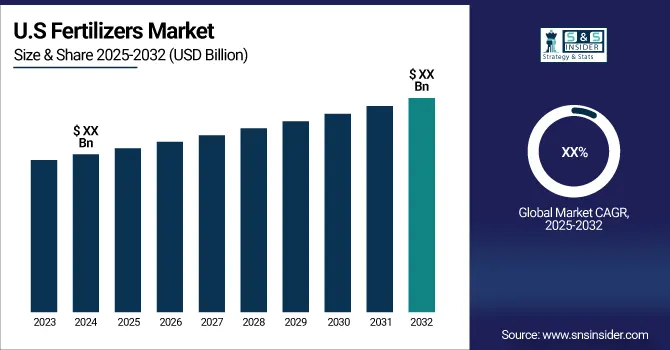
North America Fertilizers Market Trends:
The North American region is a dynamic market for fertilizers owing to the developments in agriculture and the growing implementation of precision farming. Specifically, the governments of the United States and Canada are prioritizing sustainable farming solutions to combat climate change, soil erosion, and pressure to produce more food. The development can be attributed to government efforts on green manure and the development of technological advances such as slow-released fertilizers, etc. In addition, the surging requirement for organic commodities in North America has resulted in higher penetration of organic fertilizers, thereby strengthening the market dynamics of the region. These trends highlight how both Asia-Pacific and North America are playing pivotal roles in shaping the global fertilizers market.
Europe Fertilizers Market Trends:
Europe holds a significant share in the global fertilizers market, driven by advanced agricultural practices and regulatory emphasis on sustainable farming. Countries such as Germany, France, and the Netherlands are promoting precision farming, soil nutrient optimization, and eco-friendly fertilizers to reduce environmental impact. Increasing adoption of slow-release and organic fertilizers, supported by government subsidies and research initiatives, is enhancing crop productivity while minimizing ecological footprints. The region’s focus on balancing food production with sustainability is expected to sustain market growth.
Latin America Fertilizers Market Trends:
Latin America is witnessing steady growth in the fertilizers market, fueled by expanding agricultural activities and favorable climatic conditions. Brazil, Argentina, and Mexico are major contributors due to large-scale cultivation of soy, corn, and sugarcane. Government initiatives promoting fertilizer use, modernization of farming practices, and investment in nutrient management are supporting growth. Additionally, the rising demand for high-yield crops and export-oriented agriculture is encouraging the adoption of both chemical and organic fertilizers, strengthening the regional market dynamics.
Middle East & Africa Fertilizers Market Trends:
The Middle East & Africa region is emerging as a key market for fertilizers due to expanding arable land, agricultural modernization, and food security initiatives. Countries like Egypt, Saudi Arabia, and South Africa are investing in irrigation technologies, soil fertility programs, and subsidized fertilizer distribution to enhance crop productivity. The demand for nutrient-rich and specialized fertilizers is increasing alongside government policies supporting sustainable agriculture. With rising population and investment in agri-tech solutions, the region is poised for steady growth in the global fertilizers market.

Get Customized Report as Per Your Business Requirement - Request For Customized Report
Fertilizers Market Key Players:
Service Providers / Manufacturers:
-
Nutrien Ltd. (ESN Smart Nitrogen, Hydro Agri)
-
Yara International ASA (YaraMila Complex, YaraVita)
-
The Mosaic Company (MicroEssentials, K-Mag)
-
CF Industries Holdings, Inc. (NitroPhos, Urea-Ammonium Nitrate)
-
Israel Chemicals Ltd (ICL) (Polyphosphate Fertilizers, PKpluS)
-
Coromandel International Ltd. (Gromor, Paramfos)
-
OCI Nitrogen (NUTRAMON, Urea Fertilizer)
-
K+S Aktiengesellschaft (KALISOP, ESTA Kieserit)
-
Haifa Group (Haifa MAP, Multi-K Magnesium Nitrate)
-
SABIC (Fertlizer Products, Specialty Nutrients)
-
Sinofert Holdings Ltd. (Compound Fertilizers, NPK Blends)
-
TogliattiAzot (Urea, NPK Fertilizers)
-
PT Pupuk Indonesia (Urea, NPK, Ammonium Sulfate)
-
Agrium Inc. (Crop Nutrients, Specialty Fertilizers)
-
Rashtriya Chemicals & Fertilizers Ltd. (Superphosphate, NPK Blends)
-
Fertilizantes Heringer S.A. (Nitrogen and Phosphate Fertilizers)
-
National Fertilizers Limited (Urea, Ammonium Nitrate)
-
OCI Company Ltd. (Nitrogen and Phosphate Solutions)
-
Chambal Fertilisers & Chemicals Ltd. (DAP, NPK, Urea Fertilizers)
Users
-
General Mills
-
Nestlé
-
Unilever
-
PepsiCo
-
Cargill, Inc.
-
Danone S.A.
-
Archer Daniels Midland Company (ADM)
-
Tyson Foods, Inc.
-
Kraft Heinz Company
-
Mondelez International
Fertilizers Market Competitive Landscape:
The Mosaic Company, established in 2004 and headquartered in the United States, is a leading global producer of potash and phosphate fertilizers. It supplies essential crop nutrients to support sustainable agriculture worldwide. Mosaic focuses on high-quality production, operational efficiency, and expansion projects to meet growing global food demand.
-
In March 2025, Mosaic aims to restore fertilizer output in 2025, forecasting potash production of 8.7–9.1 mn t and phosphate production of 7.4–7.6 mn t, supported by Esterhazy Hydrofloat expansion, facility maintenance, and completion of a 1 mn t/yr blending plant in Palmeirante, Brazil.
OCI Global, established in 1927 and headquartered in the Netherlands, is a leading global producer of nitrogen-based fertilizers and industrial chemicals. The company focuses on sustainable agricultural solutions, including lower-carbon fertilizers, and serves farmers worldwide. OCI emphasizes innovation, operational efficiency, and partnerships to promote climate-smart, high-yield crop production.
-
In March 2025 OCI Global partners with RWZ to supply lower carbon fertilizers, including Nutramon® Novo and Dynamon® Novo, produced using biogas to reduce CO₂ emissions by up to 60%, supporting RWZ’s KlimaPartner Landwirtschaft initiative for climate-smart, sustainable farming.
Report Attributes | Details |
---|---|
Market Size in 2024 | USD 285.58 Billion |
Market Size by 2032 | USD 390.84 Billion |
CAGR | CAGR of 4.0% From 2025 to 2032 |
Base Year | 2024 |
Forecast Period | 2025-2032 |
Historical Data | 2021-2023 |
Report Scope & Coverage | Market Size, Segments Analysis, Competitive Landscape, Regional Analysis, DROC & SWOT Analysis, Forecast Outlook |
Key Segments | • By Form (Dry, Liquid) • By Application (Agriculture {Grains and Cereals, Oilseeds, Fruits and Vegetables, Others}, Horticulture, Gardening) • By Crop Type (Field Crops, Horticultural Crops, Turf & Ornamental) • By Product (Organic {Plant-based fertilizers, Animal-based fertilizers, Mineral-based fertilizers}, Inorganic {Nitrogen, Phosphorus, Potassium) |
Regional Analysis/Coverage | North America (US, Canada), Europe (Germany, UK, France, Italy, Spain, Russia, Poland, Rest of Europe), Asia Pacific (China, India, Japan, South Korea, Australia, ASEAN Countries, Rest of Asia Pacific), Middle East & Africa (UAE, Saudi Arabia, Qatar, South Africa, Rest of Middle East & Africa), Latin America (Brazil, Argentina, Mexico, Colombia, Rest of Latin America). |
Company Profiles |
Nutrien Ltd., Yara International ASA, The Mosaic Company, CF Industries Holdings, Inc., Israel Chemicals Ltd (ICL), EuroChem Group AG, Coromandel International Ltd., OCI Nitrogen, K+S Aktiengesellschaft, Haifa Group, SABIC, Sinofert Holdings Ltd., TogliattiAzot, PT Pupuk Indonesia, Agrium Inc., Rashtriya Chemicals & Fertilizers Ltd., Fertilizantes Heringer S.A., National Fertilizers Limited, OCI Company Ltd., Chambal Fertilisers & Chemicals Ltd. |
Table Of Contents
1. Introduction
1.1 Market Definition & Scope
1.2 Research Assumptions & Abbreviations
1.3 Research Methodology
2. Executive Summary
2.1 Market Snapshot
2.2 Market Absolute $ Opportunity Assessment & Y-o-Y Analysis, 2021–2032
2.3 Market Size & Forecast, By Segmentation, 2021–2032
2.3.1 Market Size By Form
2.3.2 Market Size By Form
2.3.3 Market Size By Product
2.3.4 Market Size By Product
2.4 Market Share & Bps Analysis By Region, 2024
2.5 Industry Growth Scenarios – Conservative, Likely & Optimistic
2.6 Industry CxO’s Perspective
3. Market Overview
3.1 Market Dynamics
3.1.1 Drivers
3.1.2 Restraints
3.1.3 Opportunities
3.1.4 Key Market Trends
3.2 Industry PESTLE Analysis
3.3 Key Industry Forces (Porter’s) Impacting Market Growth
3.4 Industry Supply Chain Analysis
3.4.1 Raw Material Suppliers
3.4.2 Manufacturers
3.4.3 Distributors/Suppliers
3.4.4 Customers/End-Users
3.5 Industry Life Cycle Assessment
3.6 Parent Market Overview
3.7 Market Risk Assessment
4. Statistical Insights & Trends Reporting
4.1 Product & Material Metrics
4.1.1 Market Share by Fertilizer Type (Nitrogenous, Phosphatic, Potassic, Complex/Compound, Biofertilizers, Specialty Fertilizers).
4.1.2 Average Nutrient Content (%) by Fertilizer Type.
4.1.3 Regional Consumption Volume by Fertilizer Category (tons).
4.1.4 Fertilizer Production Capacity & Utilization Rates.
4.2 Application & Crop Metrics
4.2.1 Volume and Revenue Share by Crop Type (Cereals & Grains, Oilseeds, Fruits & Vegetables, Cash Crops, Others).
4.2.2 Nutrient Application Rate per Hectare (kg/ha) by Crop Type.
4.2.3 Seasonal Application Trends & Peak Usage Periods.
4.2.4 Regional Crop-specific Fertilizer Usage Patterns.
4.3 Cost & Economic Indicators
4.3.1 Average Selling Price (ASP) by Fertilizer Type and Region.
4.3.2 Production Cost Breakdown (Raw Materials, Energy, Logistics).
4.3.3 Total Cost of Fertilizer Application per Hectare.
4.3.4 Price Sensitivity and Volatility Trends for Key Raw Materials (Urea, Phosphate Rock, Potash).
4.4 Supply Chain & Manufacturing Metrics
4.4.1 Concentration Ratio of Leading Fertilizer Manufacturers.
4.4.2 Global Production & Import-Export Statistics.
4.4.3 Lead Time & Inventory Metrics for Fertilizer Distribution.
4.4.4 Manufacturing Yield, Quality Control, and Loss Rates.
5. Fertilizers Market Segmental Analysis & Forecast, By Form , 2021 – 2032, Value (USD Billion)
5.1 Introduction
5.2 Dry
5.2.1 Key Trends
5.2.2 Market Size & Forecast, 2022 – 2033
5.3 Liquid
6. Fertilizers Market Segmental Analysis & Forecast, By Application, 2021 – 2032, Value (USD Billion)
6.1 Introduction
6.2 Agriculture
6.2.1 Key Trends
6.2.2 Market Size & Forecast, 2022 – 2033
6.2.3 Grains and Cereals
6.2.4 Oilseeds
6.2.5 Fruits and Vegetables
6.2.6 Others
6.3 Horticulture
6.4 Gardening
7. Fertilizers Market Segmental Analysis & Forecast, By Crop Type, 2021 – 2032, Value (USD Billion)
7.1 Introduction
7.2 Field Crops
7.2.1 Key Trends
7.2.2 Market Size & Forecast, 2021 – 2032
7.3 Horticultural Crops
7.4 Turf & Ornamental
8. Fertilizers Market Segmental Analysis & Forecast, By Product, 2021 – 2032, Value (USD Billion)
8.1 Introduction
8.2 Organic
8.2.1 Key Trends
8.2.2 Market Size & Forecast, 2021 – 2032
8.2.3 Plant-based fertilizers
8.2.4 Animal-based fertilizers
8.2.5 Mineral-based fertilizers
8.3 Inorganic
8.3.1 Nitrogen
8.3.1.1Urea
8.3.1.2Anhydrous ammonia
8.3.1.3 Ammonium nitrate
8.4.1.4 UAN solutions
8.5.1.5Ammonium sulfate
8.3.2 Phosphorus
8.3.2.1Diammonium phosphate
8.3.2.2 Monoammonium phosphate
8.3.2.3 Triple superphosphate
8.3.2.4 Ordinary superphosphate
8.3.2.5 Ammonium polyphosphate
8.3.2.6 Others
8.3.3 Potassium
8.3.3.1 Potassium chloride
8.3.3.2 Potassium sulfate
8.3.3.3 Potassium nitrate
9. Fertilizers Market Segmental Analysis & Forecast By Region, 2021 – 2025, Value (USD Billion)
9.1 Introduction
9.2 North America
9.2.1 Key Trends
9.2.2 Fertilizers Market Size & Forecast, By Form , 2021 – 2032
9.2.3 Fertilizers Market Size & Forecast, By Application, 2021 – 2032
9.2.4 Fertilizers Market Size & Forecast, By Crop Type, 2021 – 2032
9.2.5 Fertilizers Market Size & Forecast, By Product
, 2021 – 2032
9.2.6 Fertilizers Market Size & Forecast, By Country, 2021 – 2032
9.2.6.1 USA
9.2.6.1.1 Fertilizers Market Size & Forecast, By Form , 2021 – 2032
9.2.6.1.2 Fertilizers Market Size & Forecast, By Application, 2021 – 2032
9.2.6.1.3 Fertilizers Market Size & Forecast, By Crop Type
, 2021 – 2032
9.2.6.1.4 Fertilizers Market Size & Forecast, By Product, 2021 – 2032
9.2.6.2 Canada
9.2.6.2.1 Fertilizers Market Size & Forecast, By Form , 2021 – 2032
9.2.6.2.2 Fertilizers Market Size & Forecast, By Application, 2021 – 2032
9.2.6.2.3 Fertilizers Market Size & Forecast, By Crop Type
2021 – 2032
9.2.6.2.4 Fertilizers Market Size & Forecast, By Product, 2021 – 2032
9.3 Europe
9.3.1 Key Trends
9.3.2 Fertilizers Market Size & Forecast, By Form , 2021 – 2032
9.3.3 Fertilizers Market Size & Forecast, By Application, 2021 – 2032
9.3.4 Fertilizers Market Size & Forecast, By Crop Type
, 2021 – 2032
9.3.5 Fertilizers Market Size & Forecast, By Product, 2021 – 2032
9.3.6 Fertilizers Market Size & Forecast, By Country, 2021 – 2032
9.3.6.1 Germany
9.3.6.1.1 Fertilizers Market Size & Forecast, By Form , 2021 – 2032
9.3.6.1.2 Fertilizers Market Size & Forecast, By Application, 2021 – 2032
9.3.6.1.3 Fertilizers Market Size & Forecast, By Crop Type
, 2021 – 2032
9.3.6.1.4 Fertilizers Market Size & Forecast, By Product, 2021 – 2032
9.3.6.2 UK
9.3.6.2.1 Fertilizers Market Size & Forecast, By Form , 2021 – 2032
9.3.6.2.2 Fertilizers Market Size & Forecast, By Application, 2021 – 2032
9.3.6.2.3 Fertilizers Market Size & Forecast, By Crop Type
, 2021 – 2032
9.3.6.2.4 Fertilizers Market Size & Forecast, By Product, 2021 – 2032
9.3.6.3 France
9.3.6.3.1 Fertilizers Market Size & Forecast, By Form , 2021 – 2032
9.3.6.3.2 Fertilizers Market Size & Forecast, By Application, 2021 – 2032
9.3.6.3.3 Fertilizers Market Size & Forecast, By Crop Type
, 2021 – 2032
9.3.6.3.4 Fertilizers Market Size & Forecast, By Product, 2021 – 2032
9.3.6.4 Italy
9.3.6.4.1 Fertilizers Market Size & Forecast, By Form , 2021 – 2032
9.3.6.4.2 Fertilizers Market Size & Forecast, By Application, 2021 – 2032
9.3.6.4.3 Fertilizers Market Size & Forecast, By Crop Type
, 2021 – 2032
9.3.6.4.4 Fertilizers Market Size & Forecast, By Product, 2021 – 2032
9.3.6.5 Spain
9.3.6.5.1 Fertilizers Market Size & Forecast, By Form , 2021 – 2032
9.3.6.5.2 Fertilizers Market Size & Forecast, By Application, 2021 – 2032
9.3.6.5.3 Fertilizers Market Size & Forecast, By Crop Type
, 2021 – 2032
9.3.6.5.4 Fertilizers Market Size & Forecast, By Product, 2021 – 2032
9.3.6.6 Russia
9.3.6.6.1 Fertilizers Market Size & Forecast, By Form , 2021 – 2032
9.3.6.6.2 Fertilizers Market Size & Forecast, By Application, 2021 – 2032
9.3.6.6.3 Fertilizers Market Size & Forecast, By Crop Type
, 2021 – 2032
9.3.6.6.4 Fertilizers Market Size & Forecast, By Product, 2021 – 2032
9.3.6.7 Poland
9.3.6.7.1 Fertilizers Market Size & Forecast, By Form , 2021 – 2032
9.3.6.7.2 Fertilizers Market Size & Forecast, By Application, 2021 – 2032
9.3.6.7.3 Fertilizers Market Size & Forecast, By Crop Type
, 2021 – 2032
9.3.6.7.4 Fertilizers Market Size & Forecast, By Product, 2021 – 2032
9.3.6.8 Rest of Europe
9.3.6.8.1 Fertilizers Market Size & Forecast, By Form , 2021 – 2032
9.3.6.8.2 Fertilizers Market Size & Forecast, By Application, 2021 – 2032
9.3.6.8.3 Fertilizers Market Size & Forecast, By Crop Type
, 2021 – 2032
9.3.6.8.4 Fertilizers Market Size & Forecast, By Product, 2021 – 2032
9.4 Asia-Pacific
9.4.1 Key Trends
9.4.2 Fertilizers Market Size & Forecast, By Form , 2021 – 2032
9.4.3 Fertilizers Market Size & Forecast, By Application, 2021 – 2032
9.4.4 Fertilizers Market Size & Forecast, By Crop Type
, 2021 – 2032
9.4.5 Fertilizers Market Size & Forecast, By Form , 2021 – 2032
9.4.6 Fertilizers Market Size & Forecast, By Country, 2021 – 2032
9.4.6.1 China
9.4.6.1.1 Fertilizers Market Size & Forecast, By Form , 2021 – 2032
9.4.6.1.2 Fertilizers Market Size & Forecast, By Application, 2021 – 2032
9.4.6.1.3 Fertilizers Market Size & Forecast, By Crop Type
, 2021 – 2032
9.4.6.1.4 Fertilizers Market Size & Forecast, By Product, 2021 – 2032
9.4.6.2 India
9.4.6.2.1 Fertilizers Market Size & Forecast, By Form , 2021 – 2032
9.4.6.2.2 Fertilizers Market Size & Forecast, By Application, 2021 – 2032
9.4.6.2.3 Fertilizers Market Size & Forecast, By Crop Type
, 2021 – 2032
9.4.6.2.4 Fertilizers Market Size & Forecast, By Product, 2021 – 2032
9.4.6.3 Japan
9.4.6.3.1 Fertilizers Market Size & Forecast, By Form , 2021 – 2032
9.4.6.3.2 Fertilizers Market Size & Forecast, By Application, 2021 – 2032
9.4.6.3.3 Fertilizers Market Size & Forecast, By Crop Type
, 2021 – 2032
9.4.6.3.4 Fertilizers Market Size & Forecast, By Product, 2021 – 2032
9.4.6.4 South Korea
9.4.6.4.1 Fertilizers Market Size & Forecast, By Form , 2021 – 2032
9.4.6.4.2 Fertilizers Market Size & Forecast, By Application, 2021 – 2032
9.4.6.4.3 Fertilizers Market Size & Forecast, By Crop Type
, 2021 – 2032
9.4.6.4.4 Fertilizers Market Size & Forecast, By Product, 2021 – 2032
9.4.6.5 Australia
9.4.6.5.1 Fertilizers Market Size & Forecast, By Form , 2021 – 2032
9.4.6.5.2 Fertilizers Market Size & Forecast, By Application, 2021 – 2032
9.4.6.5.3 Fertilizers Market Size & Forecast, By Crop Type
, 2021 – 2032
9.4.6.5.4 Fertilizers Market Size & Forecast, By Product, 2021 – 2032
9.4.6.6 ASEAN Countries
9.4.6.6.1 Fertilizers Market Size & Forecast, By Form , 2021 – 2032
9.4.6.6.2 Fertilizers Market Size & Forecast, By Application, 2021 – 2032
9.4.6.6.3 Fertilizers Market Size & Forecast, By Crop Type
, 2021 – 2032
9.4.6.6.4 Fertilizers Market Size & Forecast, By Product, 2021 – 2032
9.4.6.7 Rest of Asia-Pacific
9.4.6.7.1 Fertilizers Market Size & Forecast, By Form , 2021 – 2032
9.4.6.7.2 Fertilizers Market Size & Forecast, By Application, 2021 – 2032
9.4.6.7.3 Fertilizers Market Size & Forecast, By Crop Type, 2021 – 2032
9.4.6.7.4 Fertilizers Market Size & Forecast, By Product, 2021 – 2032
9.5 Latin America
9.5.1 Key Trends
9.5.2 Fertilizers Market Size & Forecast, By Form , 2021 – 2032
9.5.3 Fertilizers Market Size & Forecast, By Application, 2021 – 2032
9.5.4 Fertilizers Market Size & Forecast, By Crop Type, 2021 – 2032
9.5.5 Fertilizers Market Size & Forecast, By Product, 2021 – 2032
9.5.6 Fertilizers Market Size & Forecast, By Country, 2021 – 2032
9.5.6.1 Brazil
9.5.6.1.1 Fertilizers Market Size & Forecast, By Form , 2021 – 2032
9.5.6.1.2 Fertilizers Market Size & Forecast, By Application, 2021 – 2032
9.5.6.1.3 Fertilizers Market Size & Forecast, By Crop Type, 2021 – 2032
9.5.6.1.4 Fertilizers Market Size & Forecast, By Product, 2021 – 2032
9.5.6.2 Argentina
9.5.6.2.1 Fertilizers Market Size & Forecast, By Form , 2021 – 2032
9.5.6.2.2 Fertilizers Market Size & Forecast, By Application, 2021 – 2032
9.5.6.2.3 Fertilizers Market Size & Forecast, By Crop Type, 2021 – 2032
9.5.6.2.4 Fertilizers Market Size & Forecast, By Product, 2021 – 2032
9.5.6.3 Mexico
9.5.6.3.1 Fertilizers Market Size & Forecast, By Form , 2021 – 2032
9.5.6.3.2 Fertilizers Market Size & Forecast, By Application, 2021 – 2032
9.5.6.3.3 Fertilizers Market Size & Forecast, By Crop Type, 2021 – 2032
9.5.6.3.4 Fertilizers Market Size & Forecast, By Product, 2021 – 2032
9.5.6.4 Colombia
9.5.6.4.1 Fertilizers Market Size & Forecast, By Form , 2021 – 2032
9.5.6.4.2 Fertilizers Market Size & Forecast, By Application, 2021 – 2032
9.5.6.4.3 Fertilizers Market Size & Forecast, By Crop Type, 2021 – 2032
9.5.6.4.4 Fertilizers Market Size & Forecast, By Product, 2021 – 2032
9.5.6.5 Rest of Latin America
9.5.6.5.1 Fertilizers Market Size & Forecast, By Form , 2021 – 2032
9.5.6.5.2 Fertilizers Market Size & Forecast, By Application, 2021 – 2032
9.5.6.5.3 Fertilizers Market Size & Forecast, By Crop Type, 2021 – 2032
9.5.6.5.4 Fertilizers Market Size & Forecast, By Product, 2021 – 2032
9.6 Middle East & Africa
9.6.1 Key Trends
9.6.2 Fertilizers Market Size & Forecast, By Form , 2021 – 2032
9.6.3 Fertilizers Market Size & Forecast, By Application, 2021 – 2032
9.6.4 Fertilizers Market Size & Forecast, By Product, 2021 – 2032
9.6.5 Fertilizers Market Size & Forecast, By Crop Type, 2021 – 2032
9.6.6 Fertilizers Market Size & Forecast, By Country, 2021 – 2032
9.6.6.1 UAE
9.6.6.1.1 Fertilizers Market Size & Forecast, By Form , 2021 – 2032
9.6.6.1.2 Fertilizers Market Size & Forecast, By Application, 2021 – 2032
9.6.6.1.3 Fertilizers Market Size & Forecast, By Crop Type, 2021 – 2032
9.6.6.1.4 Fertilizers Market Size & Forecast, By Product, 2021 – 2032
9.6.6.2 Saudi Arabia
9.6.6.2.1 Fertilizers Market Size & Forecast, By Form , 2021 – 2032
9.6.6.2.2 Fertilizers Market Size & Forecast, By Application, 2021 – 2032
9.6.6.2.3 Fertilizers Market Size & Forecast, By Crop Type, 2021 – 2032
9.6.6.2.4 Fertilizers Market Size & Forecast, By Product, 2021 – 2032
9.6.6.3 Qatar
9.6.6.3.1 Fertilizers Market Size & Forecast, By Form , 2021 – 2032
9.6.6.3.2 Fertilizers Market Size & Forecast, By Application, 2021 – 2032
9.6.6.3.3 Fertilizers Market Size & Forecast, By Crop Type, 2021 – 2032
9.6.6.3.4 Fertilizers Market Size & Forecast, By Product, 2021 – 2032
9.6.6.4 Egypt
9.6.6.4.1 Fertilizers Market Size & Forecast, By Form , 2021 – 2032
9.6.6.4.2 Fertilizers Market Size & Forecast, By Application, 2021 – 2032
9.6.6.4.3 Fertilizers Market Size & Forecast, By Crop Type, 2021 – 2032
9.6.6.4.4 Fertilizers Market Size & Forecast, By Product, 2021 – 2032
9.6.6.5 South Africa
9.6.6.5.1 Fertilizers Market Size & Forecast, By Form , 2021 – 2032
9.6.6.5.2 Fertilizers Market Size & Forecast, By Application, 2021 – 2032
9.6.6.5.3 Fertilizers Market Size & Forecast, By Crop Type, 2021 – 2032
9.6.6.5.4 Fertilizers Market Size & Forecast, By Product, 2021 – 2032
9.6.6.6 Rest of Middle East & Africa
9.6.6.6.1 Fertilizers Market Size & Forecast, By Form , 2021 – 2032
9.6.6.6.2 Fertilizers Market Size & Forecast, By Application, 2021 – 2032
9.6.6.6.3 Fertilizers Market Size & Forecast, By Crop Type, 2021 – 2032
9.6.6.6.4 Fertilizers Market Size & Forecast, By Product, 2021 – 2032
10. Competitive Landscape
10.1 Key Players' Positioning
10.2 Competitive Developments
10.2.1 Key Strategies Adopted (%), By Key Players, 2024
10.2.2 Year-Wise Strategies & Development, 2021 – 2025
10.2.3 Number Of Strategies Adopted By Key Players, 2024
10.3 Market Share Analysis, 2024
10.4 Product/Service & Application Benchmarking
10.4.1 Product/Service Specifications & Features By Key Players
10.4.2 Product/Service Heatmap By Key Players
10.4.3 Application Heatmap By Key Players
10.5 Industry Start-Up & Innovation Landscape
10.6 Key Company Profiles
10.6.1 Nutrien Ltd.
10.6.1.1 Company Overview & Snapshot
10.6.1.2 Product/Service Portfolio
10.6.1.3 Key Company Financials
10.6.1.4 SWOT Analysis
10.6.2 Yara International ASA
10.6.3 The Mosaic Company
10.6.4 CF Industries Holdings, Inc.
10.6.5 Israel Chemicals Ltd (ICL)
10.6.6 EuroChem Group AG
10.6.7 Coromandel International Ltd.
10.6.8 OCI Nitrogen
10.6.9 K+S Aktiengesellschaft
10.6.10 Haifa Group
10.6.11 SABIC
10.6.12 Sinofert Holdings Ltd.
10.6.13 TogliattiAzot
10.6.14 PT Pupuk Indonesia
10.6.15 Agrium Inc.
10.6.16 Rashtriya Chemicals & Fertilizers Ltd.
10.6.17 Fertilizantes Heringer S.A.
10.6.18 OCI Company Ltd.
10.6.19 Netsmart Technologies
10.6.20 Chambal Fertilisers & Chemicals Ltd.
11. Analyst Recommendations
11.1 SNS Insider Opportunity Map
11.2 Industry Low-Hanging Fruit Assessment
11.3 Market Entry & Growth Strategy
11.4 Analyst Viewpoint & Suggestions on Market Growth
12. Assumptions
13. Disclaimer
14. Appendix
14.1 List Of Tables
14.2 List Of Figures
Key Segments:
By Form
-
Dry
-
Liquid
By Application
-
Agriculture
-
Grains and Cereals
-
Oilseeds
-
Fruits and Vegetables
-
Others
-
-
Horticulture
-
Gardening
By Crop Type
-
Field Crops
-
Horticultural Crops
-
Turf & Ornamental
By Product
-
Organic
-
Plant-based fertilizers
-
Animal-based fertilizers
-
Mineral-based fertilizers
-
-
Inorganic
-
Nitrogen
-
Urea
-
Anhydrous ammonia
-
Ammonium nitrate
-
UAN solutions
-
Ammonium sulfate
-
-
Phosphorus
-
Diammonium phosphate
-
Monoammonium phosphate
-
Triple superphosphate
-
Ordinary superphosphate
-
Ammonium polyphosphate
-
Others
-
-
Potassium
-
Potassium chloride
-
Potassium sulfate
-
Potassium nitrate
-
-
Request for Segment Customization as per your Business Requirement: Segment Customization Request
REGIONAL COVERAGE:
North America
-
US
-
Canada
-
Mexico
Europe
-
Eastern Europe
-
Poland
-
Romania
-
Hungary
-
Turkey
-
Rest of Eastern Europe
-
-
Western Europe
-
Germany
-
France
-
UK
-
Italy
-
Spain
-
Netherlands
-
Switzerland
-
Austria
-
Rest of Western Europe
-
Asia Pacific
-
China
-
India
-
Japan
-
South Korea
-
Vietnam
-
Singapore
-
Australia
-
Rest of Asia Pacific
Middle East & Africa
-
Middle East
-
UAE
-
Egypt
-
Saudi Arabia
-
Qatar
-
Rest of the Middle East
-
-
Africa
-
Nigeria
-
South Africa
-
Rest of Africa
-
Latin America
-
Brazil
-
Argentina
-
Colombia
-
Rest of Latin America
Request for Country Level Research Report: Country Level Customization Request
Available Customization
With the given market data, SNS Insider offers customization as per the company’s specific needs. The following customization options are available for the report:
-
Product Analysis
-
Criss-Cross segment analysis (e.g. Product X Application)
-
Product Matrix which gives a detailed comparison of product portfolio of each company
-
Geographic Analysis
-
Additional countries in any of the regions
-
Company Information
-
Detailed analysis and profiling of additional market players (Up to five)
An accurate research report requires proper strategizing as well as implementation. There are multiple factors involved in the completion of good and accurate research report and selecting the best methodology to compete the research is the toughest part. Since the research reports we provide play a crucial role in any company’s decision-making process, therefore we at SNS Insider always believe that we should choose the best method which gives us results closer to reality. This allows us to reach at a stage wherein we can provide our clients best and accurate investment to output ratio.
Each report that we prepare takes a timeframe of 350-400 business hours for production. Starting from the selection of titles through a couple of in-depth brain storming session to the final QC process before uploading our titles on our website we dedicate around 350 working hours. The titles are selected based on their current market cap and the foreseen CAGR and growth.
The 5 steps process:
Step 1: Secondary Research:
Secondary Research or Desk Research is as the name suggests is a research process wherein, we collect data through the readily available information. In this process we use various paid and unpaid databases which our team has access to and gather data through the same. This includes examining of listed companies’ annual reports, Journals, SEC filling etc. Apart from this our team has access to various associations across the globe across different industries. Lastly, we have exchange relationships with various university as well as individual libraries.

Step 2: Primary Research
When we talk about primary research, it is a type of study in which the researchers collect relevant data samples directly, rather than relying on previously collected data. This type of research is focused on gaining content specific facts that can be sued to solve specific problems. Since the collected data is fresh and first hand therefore it makes the study more accurate and genuine.
We at SNS Insider have divided Primary Research into 2 parts.
Part 1 wherein we interview the KOLs of major players as well as the upcoming ones across various geographic regions. This allows us to have their view over the market scenario and acts as an important tool to come closer to the accurate market numbers. As many as 45 paid and unpaid primary interviews are taken from both the demand and supply side of the industry to make sure we land at an accurate judgement and analysis of the market.
This step involves the triangulation of data wherein our team analyses the interview transcripts, online survey responses and observation of on filed participants. The below mentioned chart should give a better understanding of the part 1 of the primary interview.

Part 2: In this part of primary research the data collected via secondary research and the part 1 of the primary research is validated with the interviews from individual consultants and subject matter experts.
Consultants are those set of people who have at least 12 years of experience and expertise within the industry whereas Subject Matter Experts are those with at least 15 years of experience behind their back within the same space. The data with the help of two main processes i.e., FGDs (Focused Group Discussions) and IDs (Individual Discussions). This gives us a 3rd party nonbiased primary view of the market scenario making it a more dependable one while collation of the data pointers.
Step 3: Data Bank Validation
Once all the information is collected via primary and secondary sources, we run that information for data validation. At our intelligence centre our research heads track a lot of information related to the market which includes the quarterly reports, the daily stock prices, and other relevant information. Our data bank server gets updated every fortnight and that is how the information which we collected using our primary and secondary information is revalidated in real time.

Step 4: QA/QC Process
After all the data collection and validation our team does a final level of quality check and quality assurance to get rid of any unwanted or undesired mistakes. This might include but not limited to getting rid of the any typos, duplication of numbers or missing of any important information. The people involved in this process include technical content writers, research heads and graphics people. Once this process is completed the title gets uploader on our platform for our clients to read it.
Step 5: Final QC/QA Process:
This is the last process and comes when the client has ordered the study. In this process a final QA/QC is done before the study is emailed to the client. Since we believe in giving our clients a good experience of our research studies, therefore, to make sure that we do not lack at our end in any way humanly possible we do a final round of quality check and then dispatch the study to the client.