Biocomposites Market Report Scope & Overview:
Get More Information on Biocomposites Market - Request Sample Report
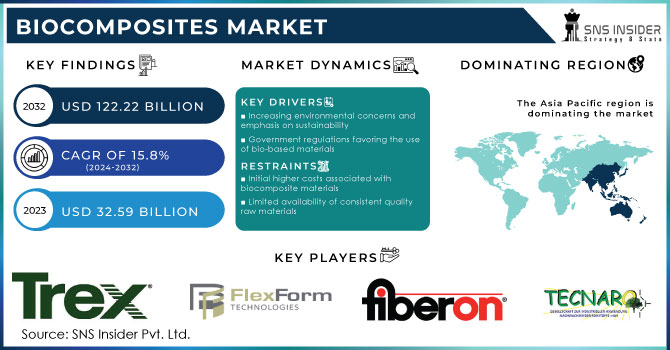
The Biocomposites Market was valued at USD 32.59 billion in 2023 and is supposed to reach USD 122.22 billion by 2032. It is expected to grow at a CAGR of 15.8% over the forecast period 2024-2032.
The biocomposites market is experiencing significant growth due to escalating environmental concerns, driving demand for sustainable alternatives. Advancements in biotechnology and manufacturing processes have improved the performance and cost-effectiveness of biocomposite materials. Heightened regulatory support and incentives for eco-friendly products further stimulate market expansion. Increasing consumer awareness and preference for bio-based materials across diverse industries, including automotive, construction, and packaging, are also pivotal growth factors.
The replacement of plastic composites with biocomposites offers opportunities for industries aiming to reduce their environmental footprint and meet sustainability goals. Biocomposites, derived from renewable resources, provide an eco-friendly alternative while maintaining comparable performance characteristics. This shift towards biocomposites aligns with growing consumer demand for sustainable products, opening avenues for market differentiation and brand enhancement.
Market Dynamics
Drivers
-
Increasing environmental concerns and emphasis on sustainability
-
Government regulations favoring the use of bio-based materials
Restraint
-
Initial higher costs associated with biocomposite materials
-
Limited availability of consistent quality raw materials
-
Performance limitations compared to traditional materials in certain applications
The constraint of performance limitations arise when biocomposites may not meet the exacting standards required in specific applications, such as those demanding extreme durability or temperature resistance. While biocomposites offer eco-friendly alternatives, their mechanical properties may not always match those of traditional materials like metals or synthetic plastics. Overcoming these limitations necessitates continuous advancements in biocomposite technology to broaden their applicability and compete effectively in diverse markets.
Opportunities
-
Growing consumer awareness and preference for eco-friendly products
-
Expansion of applications across various industries such as automotive, construction, and packaging
The opportunity lies in leveraging biocomposites' versatile properties to address unique challenges across automotive, construction, and packaging industries. In automotive, biocomposites offer lightweight solutions, enhancing fuel efficiency and reducing environmental impact. In construction, they contribute to sustainable building practices, offering durability and insulation properties. Additionally, in packaging, biocomposites provide eco-friendly alternatives to traditional plastics, meeting consumer demand for sustainable packaging solutions. This diversification of applications underscores the market's potential for growth and innovation across various sectors.
Challenges
-
Competition from conventional materials, especially in price-sensitive markets
Impact of Russia-Ukraine War:
Both Russia and Ukraine are key exporters of raw materials like flax, hemp, and wood used in biocomposite production. The war has caused shortages and transportation hurdles, driving up prices of these materials. Russia is a major energy producer, and the war has led to a surge in oil and gas prices. This affects production costs for biocomposites, as energy is used in manufacturing processes. The Russia-Ukraine war has created short-term challenges for the biocomposites market. But the long-term growth opportunities remain positive, driven by the increasing demand for sustainable materials.
Impact of Economic Downturn:
During economic downturns, the biocomposites market faces reduced demand as consumers prioritize essential purchases over non-essential items. Businesses, facing financial constraints, postpone investments in sustainable technologies like biocomposites, impacting market growth. Slower economic activity limits expansion opportunities for biocomposite manufacturers, leading to a dampened overall growth rate. Uncertainties in economic conditions further exacerbate the market's challenges, potentially stalling innovation and adoption of biocomposite materials. However, the long-term demand for sustainable solutions may offer resilience, although with slower growth during periods of economic weakness.
Market Segmentation
By Polymer Type
-
Natural Polymer Composites
-
Synthetic Polymer Composites
By Polymer Type, Synthetic Polymer Composites held the largest revenue share in 2023 because of their extensive use in industries requiring high-performance materials. Their versatility allows for customization to meet specific application needs, ranging from aerospace to electronics. Moreover, continuous advancements in synthetic polymer technology have led to improved properties, such as enhanced strength, durability, and resistance to harsh environments, solidifying their position as the preferred choice in the biocomposites market.
By Fiber Type
-
Wood Fiber Composites
-
Non-Wood Fiber Composites
Wood Fiber Composites led the biocomposites market with the highest revenue share of more than 52% in 2023 due to their compatibility with existing manufacturing processes and infrastructure. Manufacturers can easily integrate wood fiber composites into their production lines without significant modifications, reducing implementation costs and accelerating adoption. Additionally, wood fiber composites offer excellent strength-to-weight ratios, making them ideal for various applications in industries such as automotive, construction, and consumer goods. Their natural appearance and eco-friendly credentials further contributed to their popularity, driving their substantial revenue share in the biocomposites market.
By Product
-
Hybrid Biocomposites
-
Green Biocomposites
Hybrid Biocomposites dominated the product segment of the biocomposites market in 2023 due to their capacity to optimize material properties by combining different types of natural fibers and synthetic polymers. This synergistic approach enhances mechanical strength, durability, and customization possibilities, catering to diverse industry demands. Additionally, hybrid biocomposites offer a sustainable solution by utilizing renewable resources while maintaining competitive performance standards, driving their dominance in the biocomposites market.
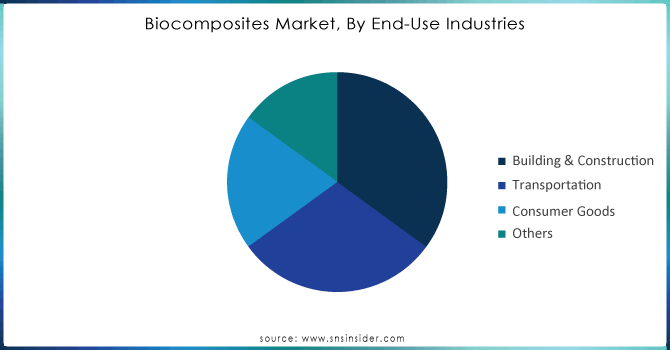
By End-Use Industries
-
Building & Construction
-
Consumer Goods
-
Others
Get Customized Report as per Your Business Requirement - Request For Customized Report
Regional Analysis
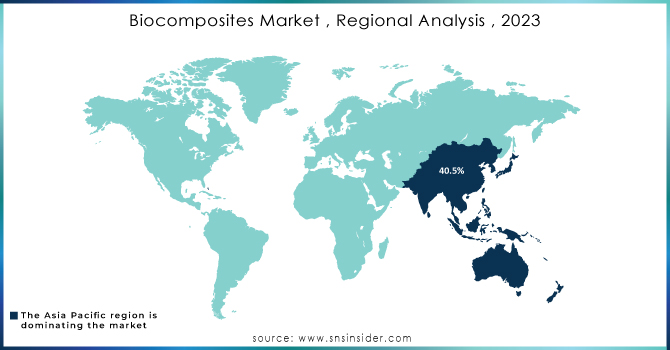
Asia Pacific dominated the Biocomposites Market with the highest revenue share of about 40.5% in 2023. The region's large population and rapid industrialization drive demand for sustainable materials, such as biocomposites, across various industries. Additionally, favorable government policies and initiatives promoting environmental sustainability and renewable resources encourage the adoption of biocomposites. Moreover, the presence of a large industrial base and rapid economic growth fueled demand across diverse sectors such as automotive, building & construction, and packaging, where biocomposites find extensive applications. Furthermore, Asia Pacific benefits from a robust manufacturing ecosystem and technological advancements, facilitating efficient production and widespread usage of biocomposites in the region.
North America is expected to be the second-largest region in the Biocomposites Market during the forecast period. Increasing environmental awareness and stringent regulations promoting sustainable practices drive the adoption of biocomposites across industries. The rapidly expanding aircraft manufacturing business, as well as the electric vehicle industry, are driving up demand for Biocomposites in this region.
REGIONAL COVERAGE:
North America
-
US
-
Canada
-
Mexico
Europe
-
Eastern Europe
-
Poland
-
Romania
-
Hungary
-
Turkey
-
Rest of Eastern Europe
-
-
Western Europe
-
Germany
-
France
-
UK
-
Italy
-
Spain
-
Netherlands
-
Switzerland
-
Austria
-
Rest of Western Europe
-
Asia Pacific
-
China
-
India
-
Japan
-
South Korea
-
Vietnam
-
Singapore
-
Australia
-
Rest of Asia Pacific
Middle East & Africa
-
Middle East
-
UAE
-
Egypt
-
Saudi Arabia
-
Qatar
-
Rest of the Middle East
-
-
Africa
-
Nigeria
-
South Africa
-
Rest of Africa
-
Latin America
-
Brazil
-
Argentina
-
Colombia
-
Rest of Latin America
Key Players:
The major key players are Trex Company, UPM, FlexForm Technologies, Fiberon LLC, Universal Forest Products, Inc., Meshlin Composites ZRT, Nanjing Jufeng Advanced Materials Co., Ltd., Tecnaro GmbH, Procotex, and A.B.COMPOSITES PVT.LTD.
Recent Development:
-
In June 2023, Trex Company, the world's largest manufacturer of high-performance wood-alternative decking and railing, introduced the Trex Select® T-Rail. This composite railing system, featuring a popular T-shaped top rail, aims to make the beauty and convenience of Trex's high-performance composite and aluminum railing accessible to a broader audience with competitive pricing that rivals PVC vinyl railing.
-
In May 2023, UPM Biochemicals and URSA, one of the leading producers of glass wool and mineral wool in Europe, announced the development of more environmentally friendly building insulation. This innovation will help reduce energy consumption and lower CO2 emissions.
-
In September 2022, Fiberon launched Wildwood composite cladding, offering the unmatched beauty and warmth of wood combined with the durability of high-performance, low-maintenance materials.
-
In March 2020, Finland-based paper mill UPM developed a wood-based biocomposite material made with up to 100% renewable resources
| Report Attributes | Details |
|---|---|
| Market Size in 2023 | US$ 32.59 Billion |
| Market Size by 2032 | US$ 122.22 Billion |
| CAGR | CAGR of 15.8% From 2024 to 2032 |
| Base Year | 2023 |
| Forecast Period | 2024-2032 |
| Historical Data | 2020-2022 |
| Report Scope & Coverage | Market Size, Segments Analysis, Competitive Landscape, Regional Analysis, DROC & SWOT Analysis, Forecast Outlook |
| Key Segments | • By Polymer Type, (Natural Polymer Composites and Synthetic Polymer Composites) • By Fiber Type, (Wood Fiber Composites and Non-Wood Fiber Composites) • By Product (Hybrid Biocomposites, and Green Biocomposites) • By End-Use Industries (Building & Construction, Transportation, Consumer Goods, Others) |
| Regional Analysis/Coverage | North America (US, Canada, Mexico), Europe (Eastern Europe [Poland, Romania, Hungary, Turkey, Rest of Eastern Europe] Western Europe] Germany, France, UK, Italy, Spain, Netherlands, Switzerland, Austria, Rest of Western Europe]), Asia Pacific (China, India, Japan, South Korea, Vietnam, Singapore, Australia, Rest of Asia Pacific), Middle East & Africa (Middle East [UAE, Egypt, Saudi Arabia, Qatar, Rest of Middle East], Africa [Nigeria, South Africa, Rest of Africa], Latin America (Brazil, Argentina, Colombia, Rest of Latin America) |
| Company Profiles | Trex Company, UPM, FlexForm Technologies, Fiberon LLC, Universal Forest Products, Inc., Meshlin Composites ZRT, Nanjing Jufeng Advanced Materials Co., Ltd., Tecnaro GmbH, Procotex, and A.B.COMPOSITES PVT.LTD. |
| DRIVERS | • Increasing environmental concerns and emphasis on sustainability • Government regulations favoring the use of bio-based materials |
| RESTRAINTS | • Initial higher costs associated with biocomposite materials • Limited availability of consistent quality raw materials • Performance limitations compared to traditional materials in certain applications |
Frequently Asked Questions
Ans: Building & Construction led the End-use industries segment of the Biocomposites Market in 2023.
Ans: One of the key factors hindering the growth of the Biocomposites Market is the performance limitations compared to traditional materials in certain applications.
Ans: Increasing environmental concerns and the shift towards sustainable materials are key drivers of the Biocomposites Market.
Ans: The expected CAGR of the global Biocomposites Market during the forecast period is 15.8%.
Ans: The Biocomposites Market was valued at USD 32.59 billion in 2023.
Get in Touch
