image

Competing Protocols Market Size, Share & Segmentation By Types (IPsec, 3Des, SSL, Others) End-User (Personal Users, Corporate Users), and Region | Global Forecast 2025-2032

Date: June 2025 Report Code: SNS/ICT/7647 Page 300

Competing Protocols Market Report Scope & Overview:

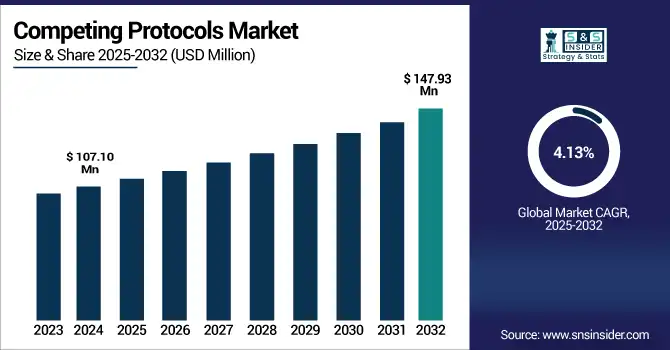
The Competing Protocols Market size was valued at USD 107.10 million in 2024 and is expected to reach USD 147.93 million by 2032, expanding at a CAGR of 4.13% over the forecast period of 2025-2032.

The Competing Protocols Market is growing steadily as demand for secure data transmission rises across corporate and personal applications. Protocols like IPsec, SSL, and 3DES are essential for safeguarding communication over networks. IPsec dominates due to its enterprise-grade security, while SSL is the fastest-growing, driven by remote work, cloud services, and secure web interactions. Corporate users hold the largest share, but personal users are growing rapidly with increased cybersecurity awareness. North America leads the market, followed by Europe and Asia Pacific. As cyber threats evolve, the market is expected to expand with innovations in encryption and secure communication technologies.

According to research, as of 2024, over 85% of global web traffic is encrypted using SSL/TLS protocols, up from 67%. Additionally, more than 40% of enterprises now deploy multi-protocol security frameworks, integrating SSL, IPsec, and TLS for enhanced protection.

The U.S Competing Protocols Market size reached USD 28.26 million in 2024 and is expected to reach USD 36.06 million in 2032 at a CAGR of 3.10% from 2025 to 2032.

The U.S. dominates the competing protocols market due to its advanced digital infrastructure, and the adoption of encryption technologies occurred early, with cybersecurity regulations like HIPAA and CCPA being strict. The competing protocols industry players like Cisco, IBM, and Microsoft foster continuous innovation upon secure communication protocols like IPsec and SSL. Also, the government invests deeply in national cybersecurity initiatives. Increasing cyber threats, the rapid shift to remote work, and growing reliance on cloud computing across sectors such as finance, defense, and healthcare further accelerate demand. In addition, enterprises are fully aware of data protection. These exact factors help the U.S. maintain its leadership within this market.

Market Dynamics

Drivers:

  • Rapid Increase in Cyber Threats and Remote Workforce Expansion Driving Protocol Adoption.

The exponential rise that is in cyberattacks and the shift toward remote and hybrid work models strengthen reliance that is on secure communication protocols. Organizations across industries are implementing SSL, IPsec, and advanced encryption standards in order to maintain network integrity and protect sensitive data. Newer advances cover multi-factor authentication upgrades and zero-trust implementations. With tighter integrations into cloud-native services, emerging vulnerabilities are addressed. Enterprises proactively adopt better protocol capabilities because digital transformation accelerated during and post-pandemic so they ensure secure access for a distributed workforce as they maintain compliance with regulatory mandates that evolve.

According to research, the average time to detect protocol-based breaches dropped from 207 days in 2020 to 138 days in 2023, as companies adopting secure protocol frameworks experienced a 36% reduction in phishing-related breaches within 12-months..

Restraints:

  • Regulatory Compliance Costs and Complexity Impeding Widespread Protocol Implementation.

Complying with strict cybersecurity regulations such as HIPAA, CCPA, and GDPR often mandates that you audit protocols extensively, manage complex configurations in addition to update frequently. In order to properly deploy and then maintain secure protocols, smaller organizations in particular do battle with the cost and with the expertise that is required. Dedicated resources and also skilled personnel must adapt themselves to continuously evolving standards. This adaptation can slow down implementation also increase operational expenses. The burden of certification, along with active vulnerability assessments and documentation, can divert attention and budgets away from innovation initiatives, which limits broader Competing Protocols market growth, especially among budget-constrained enterprises and public-sector entities.

Opportunities:

  • Expansion of Cloud-Native Applications Presents Opportunities for Advanced Protocol Integration.

The rapid migration to cloud-native architectures and microservices is creating significant opportunities for integrating advanced protocols like TLS 1.3, HTTP/3, and automated certificate management. Organizations are seeking seamless encryption built into containerized environments and API-driven services, paving the way for protocol-as-a-service offerings. Recent trends include automated key rotation, integration with service meshes like Istio, and protocol support within Kubernetes environments. These developments are enabling dynamic, scalable, and secure communication across distributed systems, opening up a substantial opportunity for vendors offering integrated, cloud-ready protocol solutions tailored to modern DevOps and CI/CD workflows.

Challenges:

  • Complexity of Legacy Infrastructure and Protocol Interoperability Challenges.

Legacy systems often rely on outdated encryption standards such as 3Des or older SSL versions, creating compatibility gaps when integrating with modern infrastructure. Ensuring interoperability across diverse environments—from on-premises to cloud—requires extensive testing, protocol translation layers, and sometimes costly upgrades. These challenges raise deployment barriers, increase project timelines, and heighten security risks during migration. Organizations must navigate a delicate balance between maintaining backward compatibility and advancing security capabilities. To address this, many are investing in middleware, protocol unification platforms, and expert services, though these measures often add complexity and cost to large-scale implementations.

Segment Analysis

By Types

The IPsec segment held the largest revenue share of 41.73% in 2024, driven by its robust encryption, authentication, and secure tunneling capabilities across enterprise networks. It is extensively used in Virtual Private Networks (VPNs), securing end-to-end communication across corporate and governmental IT infrastructures. Companies like Cisco and Juniper Networks have introduced advanced IPsec-enabled firewalls and routers, reinforcing their dominance in secure data transmission. Recent developments include Cisco’s IPsec support in SD-WAN and Juniper’s adaptive IPsec features tailored for hybrid networks. IPsec continues to serve as the backbone of enterprise-level secure communication in the Competing Protocols Market.

The SSL segment is witnessing the highest CAGR of 5.04% during the forecast period, propelled by increasing demand for secure web communications in cloud services, e-commerce, and remote work environments. SSL/TLS protocols ensure encrypted connections, protecting sensitive data exchanged between clients and servers. Companies like DigiCert and Microsoft have rolled out enhanced SSL certificate management tools and services to strengthen web and application security. Microsoft’s integration of SSL in its Azure services and DigiCert’s automated certificate lifecycle management highlight current trends. The segment’s growth aligns with the rising need for scalable, web-based encryption solutions in the Competing Protocols Market.

By End User

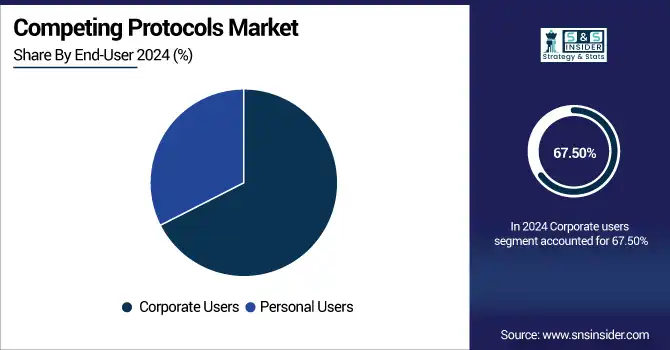
Corporate users dominated the market with a 67.50% revenue share in 2024 due to the widespread adoption of secure communication protocols to safeguard enterprise data and meet compliance standards. Enterprises across finance, healthcare, and IT deploy protocols like IPsec and SSL to support secure remote access, data sharing, and cloud integration. IBM and F5 Networks have launched enterprise-grade solutions incorporating multiple protocols to support hybrid workforces and zero-trust architectures. The growing threat landscape and regulatory pressure have compelled corporations to invest heavily in protocol-based security infrastructures, maintaining their leading role in the Competing Protocols Market.

The Personal Users segment is projected to grow at a CAGR of 4.95%, driven by rising individual awareness of data privacy and increased use of secure internet services like VPNs and encrypted browsers. Users are adopting SSL-based applications and IPsec-enabled VPNs for private browsing, streaming, and secure online communication. Companies like NordVPN and ExpressVPN have introduced advanced features such as multi-hop encryption and browser plug-in integration to enhance user privacy. These developments, coupled with frequent data breach news and global surveillance concerns, are prompting more individuals to adopt secure protocols, fueling growth in the personal user base of the Competing Protocols Market.

Regional Analysis

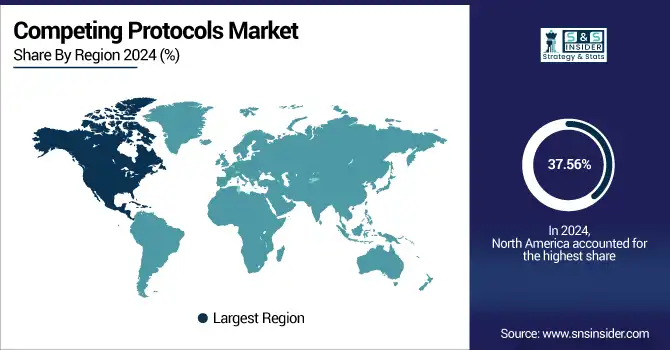
North America dominated the competing protocols market share of 37.56% in 2024. This leadership is attributed to the region’s advanced digital infrastructure, rapid adoption of cloud computing, and presence of competing protocols market companies such as Cisco, IBM, Microsoft, and Juniper Networks. The enforcement of strict data protection laws like HIPAA and CCPA, combined with rising cyber threats, has driven organizations to implement robust communication protocols across industries, including finance, healthcare, and government. The United States is the leading country in the region due to its mature cybersecurity framework, widespread cloud adoption, and heavy investments in secure protocol development and deployment.

According to research, between 2022 and 2024, over 78% of U.S. enterprises upgraded their communication protocols to meet compliance standards, with 81% of healthcare providers using SSL/TLS and 85% of government agencies adopting encrypted layers for zero-trust frameworks.

Europe accounted for a significant share of the market in 2024, driven by strict data privacy regulations under GDPR and increasing emphasis on cybersecurity in sectors like finance, manufacturing, and government. The region is witnessing consistent growth in the deployment of SSL/TLS and IPsec protocols. Investments in digital transformation, secure infrastructure modernization, and cross-border data security are contributing to Europe's strong market position. Germany leads the European market owing to its robust industrial base, strict regulatory adherence, and proactive investments in secure communication technologies.

Asia Pacific emerged as the fastest-growing region, capturing a market share of 21.39% in 2024. The region’s growth is driven by rapid digital transformation, expansion of cloud services, and increasing cybersecurity concerns across banking, telecom, and public sectors. The growing adoption of mobile and remote work solutions has accelerated the demand for secure protocols like IPsec and SSL, particularly in emerging economies undergoing technological advancement. China dominates the Asia Pacific market due to significant government-led cybersecurity initiatives, high enterprise cloud adoption, and large-scale digital infrastructure development.

The Middle East & Africa and Latin America regions are witnessing steady growth in the Competing Protocols Market, driven by national cybersecurity strategies, increased IT modernization, and rising digital services. Countries like the UAE and Brazil are leading their respective regions due to early adoption of encryption technologies, strong regulatory frameworks, and growing investments in secure, cloud-based digital infrastructure.

Key Players

The major key players of the competing protocols market are Ericsson, F5 Networks, Dialogic Corp, IBM, Cisco Systems, Inc., Synopsys, Inc., Juniper Networks, Inc., Microsoft Corporation, Huawei Technologies Co., Ltd., Nokia Corporation, and others.

Key Developments

  • In April 2024, Ericsson launched standardized security APIs in collaboration with U.S. telecom operators, aimed at strengthening authentication processes and enhancing fraud prevention for enterprise services, supporting the growing demand for secure communication protocols in digital networks.

  • In March 2024, IBM partnered with Telefónica Tech to integrate its quantum-safe encryption technologies into cybersecurity services, aiming to future-proof data protection against quantum computing threats and enhance secure communications across enterprise environments.

Competing Protocols Market Report Scope:

Report Attributes Details
Market Size in 2024 USD 107.10 Million 
Market Size by 2032 USD 147.93 Million 
CAGR CAGR of 4.13% From 2025 to 2032
Base Year 2024
Forecast Period 2025-2032
Historical Data 2021-2023
Report Scope & Coverage Market Size, Segments Analysis, Competitive Landscape, Regional Analysis, DROC & SWOT Analysis, Forecast Outlook
Key Segments •By Types (IPsec, 3Des, SSL, Others)
•By End-User (Personal Users, Corporate Users)
Regional Analysis/Coverage North America (US, Canada, Mexico), Europe (Germany, France, UK, Italy, Spain, Poland, Turkey, Rest of Europe), Asia Pacific (China, India, Japan, South Korea, Singapore, Australia, Rest of Asia Pacific), Middle East & Africa (UAE, Saudi Arabia, Qatar, South Africa, Rest of Middle East & Africa), Latin America (Brazil, Argentina, Rest of Latin America)
Company Profiles Ericsson, F5 Networks, Dialogic Corp, IBM, Cisco Systems, Inc., Synopsys, Inc., Juniper Networks, Inc., Microsoft Corporation, Huawei Technologies Co., Ltd., Nokia Corporation

Frequently Asked Questions

Ans: The market is expected to grow at a CAGR of 4.13% over the forecast period of 2025 to 2032.

Ans: The Competing Protocols Market was valued at USD 107.10 million in 2024.

Ans: The major growth factor is the rapid increase in cyber threats combined with the expansion of the remote and hybrid workforce, prompting enterprises to adopt secure communication protocols like SSL, IPsec, and TLS.

Ans: The IPsec segment dominated the market with the largest revenue share of 41.73% in 2024, driven by its robust encryption, secure tunneling features, and extensive use in enterprise VPNs and hybrid networks.

Ans: North America dominated the Competing Protocols Market in 2024 with a market share of 37.56%, attributed to its advanced digital infrastructure, widespread adoption of cloud computing, and the presence of key players such as Cisco, IBM, and Microsoft.

Table of Content

1. Introduction

1.1 Market Definition

1.2 Scope (Inclusion and Exclusions)

1.3 Research Assumptions

2. Executive Summary

2.1 Market Overview

2.2 Regional Synopsis

2.3 Competitive Summary

3. Research Methodology

3.1 Top-Down Approach

3.2 Bottom-up Approach

3.3. Data Validation

3.4 Primary Interviews

4. Market Dynamics Impact Analysis

4.1 Market Driving Factors Analysis

4.1.2 Drivers

4.1.2 Restraints

4.1.3 Opportunities

4.1.4 Challenges

4.2 PESTLE Analysis

4.3 Porter’s Five Forces Model

5. Statistical Insights and Trends Reporting

5.1 Protocol Redundancy Usage

5.2 Protocols in IoT and Edge Environments

5.3 Insider Threat Mitigation via Protocols

5.4 Multi-Layered Encryption Protocol Growth

6. Competitive Landscape

6.1 List of Major Companies, By Region

6.2 Market Share Analysis, By Region

6.3 Product Benchmarking

6.3.1 Product specifications and features

6.3.2 Pricing

6.4 Strategic Initiatives

6.4.1 Marketing and promotional activities

6.4.2 Distribution and supply chain strategies

6.4.3 Expansion plans and new product launches

6.4.4 Strategic partnerships and collaborations

6.5 Technological Advancements

6.6 Market Positioning and Branding

7. Competing Protocols Market Segmentation, By Type

7.1 Chapter Overview

7.2 IPsec

7.2.1 IPsec Market Trends Analysis (2021-2032)

7.2.2 IPsec Market Size Estimates and Forecasts to 2032 (USD Million)

7.3 3Des

7.3.1 3Des Market Trends Analysis (2021-2032)

7.3.2 3Des Market Size Estimates and Forecasts to 2032 (USD Million)

7.4 SSL

7.4.1 SSL Market Trends Analysis (2021-2032)

7.4.2 SSL Market Size Estimates and Forecasts to 2032 (USD Million)

7.5 Others

7.5.1 Others Market Trends Analysis (2021-2032)

7.5.2 Others Market Size Estimates and Forecasts to 2032 (USD Million)

8. Competing Protocols Market Segmentation, By End-User

8.1 Chapter Overview

8.2 Personal Users

8.2.1 Personal Users Market Trends Analysis (2021-2032)

8.2.2 Personal Users Market Size Estimates and Forecasts to 2032 (USD Million)

8.3 Corporate Users

8.3.1 Corporate Users Market Trends Analysis (2021-2032)

8.3.2 Corporate Users Market Size Estimates and Forecasts to 2032 (USD Million)

9. Regional Analysis

9.1 Chapter Overview

9.2 North America

9.2.1 Trends Analysis

9.2.2 North America Competing Protocols Market Estimates and Forecasts, by Country (2021-2032) (USD Million)

9.2.3 North America Competing Protocols Market Estimates and Forecasts, By Type (2021-2032) (USD Million) 

9.2.4 North America Competing Protocols Market Estimates and Forecasts, By End-User (2021-2032) (USD Million)

9.2.5 USA

9.2.5.1 USA Competing Protocols Market Estimates and Forecasts, By Type (2021-2032) (USD Million)

9.2.5.2 USA Competing Protocols Market Estimates and Forecasts, By End-User (2021-2032) (USD Million)

9.2.6 Canada

9.2.6.1 Canada Competing Protocols Market Estimates and Forecasts, By Type (2021-2032) (USD Million)

9.2.6.2 Canada Competing Protocols Market Estimates and Forecasts, By End-User (2021-2032) (USD Million)

9.2.7 Mexico

9.2.7.1 Mexico Competing Protocols Market Estimates and Forecasts, By Type (2021-2032) (USD Million)

9.2.7.2 Mexico Competing Protocols Market Estimates and Forecasts, By End-User (2021-2032) (USD Million)

9.3 Europe

9.3.1 Trends Analysis

9.3.2 Europe Competing Protocols Market Estimates and Forecasts, by Country (2021-2032) (USD Million)

9.3.3 Europe Competing Protocols Market Estimates and Forecasts, By Type (2021-2032) (USD Million) 

9.3.4 Europe Competing Protocols Market Estimates and Forecasts, By End-User (2021-2032) (USD Million)

9.3.5 Germany

9.3.5.1 Germany Competing Protocols Market Estimates and Forecasts, By Type (2021-2032) (USD Million)

9.3.5.2 Germany Competing Protocols Market Estimates and Forecasts, By End-User (2021-2032) (USD Million)

9.3.6 France

9.3.6.1 France Competing Protocols Market Estimates and Forecasts, By Type (2021-2032) (USD Million)

9.3.6.2 France Competing Protocols Market Estimates and Forecasts, By End-User (2021-2032) (USD Million)

9.3.7 UK

9.3.7.1 UK Competing Protocols Market Estimates and Forecasts, By Type (2021-2032) (USD Million)

9.3.7.2 UK Competing Protocols Market Estimates and Forecasts, By End-User (2021-2032) (USD Million)

9.3.8 Italy

9.3.8.1 Italy Competing Protocols Market Estimates and Forecasts, By Type (2021-2032) (USD Million)

9.3.8.2 Italy Competing Protocols Market Estimates and Forecasts, By End-User (2021-2032) (USD Million)

9.3.9 Spain

9.3.9.1 Spain Competing Protocols Market Estimates and Forecasts, By Type (2021-2032) (USD Million)

9.3.9.2 Spain Competing Protocols Market Estimates and Forecasts, By End-User (2021-2032) (USD Million)

9.3.10 Poland

9.3.10.1 Poland Competing Protocols Market Estimates and Forecasts, By Type (2021-2032) (USD Million)

9.3.10.2 Poland Competing Protocols Market Estimates and Forecasts, By End-User (2021-2032) (USD Million)

9.3.11 Turkey

9.3.11.1 France Competing Protocols Market Estimates and Forecasts, By Type (2021-2032) (USD Million)

9.3.11.2 France Competing Protocols Market Estimates and Forecasts, By End-User (2021-2032) (USD Million)

9.3.12 Rest of Europe

9.3.12.1 UK Competing Protocols Market Estimates and Forecasts, By Type (2021-2032) (USD Million)

9.3.12.2 UK Competing Protocols Market Estimates and Forecasts, By End-User (2021-2032) (USD Million)

9.4 Asia-Pacific

9.4.1 Trends Analysis

9.4.2 Asia-Pacific Competing Protocols Market Estimates and Forecasts, by Country (2021-2032) (USD Million)

9.4.3 Asia-Pacific Competing Protocols Market Estimates and Forecasts, By Type (2021-2032) (USD Million) 

9.4.4 Asia-Pacific Competing Protocols Market Estimates and Forecasts, By End-User (2021-2032) (USD Million)

9.4.5 China

9.4.5.1 China Competing Protocols Market Estimates and Forecasts, By Type (2021-2032) (USD Million)

9.4.5.2 China Competing Protocols Market Estimates and Forecasts, By End-User (2021-2032) (USD Million)

9.4.6 India

9.4.5.1 India Competing Protocols Market Estimates and Forecasts, By Type (2021-2032) (USD Million)

9.4.5.2 India Competing Protocols Market Estimates and Forecasts, By End-User (2021-2032) (USD Million)

9.4.5 Japan

9.4.5.1 Japan Competing Protocols Market Estimates and Forecasts, By Type (2021-2032) (USD Million)

9.4.5.2 Japan Competing Protocols Market Estimates and Forecasts, By End-User (2021-2032) (USD Million)

9.4.6 South Korea

9.4.6.1 South Korea Competing Protocols Market Estimates and Forecasts, By Type (2021-2032) (USD Million)

9.4.6.2 South Korea Competing Protocols Market Estimates and Forecasts, By End-User (2021-2032) (USD Million)

9.4.7 Singapore

9.4.7.1 Singapore Competing Protocols Market Estimates and Forecasts, By Type (2021-2032) (USD Million)

9.4.7.2 Singapore Competing Protocols Market Estimates and Forecasts, By End-User (2021-2032) (USD Million)

9.4.8 Australia

9.4.8.1 Australia Competing Protocols Market Estimates and Forecasts, By Type (2021-2032) (USD Million)

9.4.8.2 Australia Competing Protocols Market Estimates and Forecasts, By End-User (2021-2032) (USD Million)

9.4.9 Rest of Asia-Pacific

9.4.9.1 Rest of Asia-Pacific Competing Protocols Market Estimates and Forecasts, By Type (2021-2032) (USD Million)

9.4.9.2 Rest of Asia-Pacific Competing Protocols Market Estimates and Forecasts, By End-User (2021-2032) (USD Million)

9.5 Middle East and Africa

9.5.1 Trends Analysis

9.5.2 Middle East and Africa Competing Protocols Market Estimates and Forecasts, by Country (2021-2032) (USD Million)

9.5.3 Middle East and Africa Competing Protocols Market Estimates and Forecasts, By Type (2021-2032) (USD Million) 

9.5.4 Middle East and Africa Competing Protocols Market Estimates and Forecasts, By End-User (2021-2032) (USD Million)

9.5.5 UAE

9.5.5.1 UAE Competing Protocols Market Estimates and Forecasts, By Type (2021-2032) (USD Million)

9.5.5.2 UAE Competing Protocols Market Estimates and Forecasts, By End-User (2021-2032) (USD Million)

9.5.6 Saudi Arabia

9.5.6.1 Saudi Arabia Competing Protocols Market Estimates and Forecasts, By Type (2021-2032) (USD Million)

9.5.6.2 Saudi Arabia Competing Protocols Market Estimates and Forecasts, By End-User (2021-2032) (USD Million)

9.5.7 Qatar

9.5.7.1 Qatar Competing Protocols Market Estimates and Forecasts, By Type (2021-2032) (USD Million)

9.5.7.2 Qatar Competing Protocols Market Estimates and Forecasts, By End-User (2021-2032) (USD Million)

9.5.8 South Africa

9.5.8.1 South Africa Competing Protocols Market Estimates and Forecasts, By Type (2021-2032) (USD Million)

9.5.8.2 South Africa Competing Protocols Market Estimates and Forecasts, By End-User (2021-2032) (USD Million)

9.5.9 Rest of Middle East & Africa

9.5.9.1 Rest of Middle East & Africa Competing Protocols Market Estimates and Forecasts, By Type (2021-2032) (USD Million)

9.5.9.2 Rest of Middle East & Africa Competing Protocols Market Estimates and Forecasts, By End-User (2021-2032) (USD Million)

9.6 Latin America

9.6.1 Trends Analysis

9.6.2 Latin America Competing Protocols Market Estimates and Forecasts, by Country (2021-2032) (USD Million)

9.6.3 Latin America Competing Protocols Market Estimates and Forecasts, By Type (2021-2032) (USD Million) 

9.6.4 Latin America Competing Protocols Market Estimates and Forecasts, By End-User (2021-2032) (USD Million)

9.6.5 Brazil

9.6.5.1 Brazil Competing Protocols Market Estimates and Forecasts, By Type (2021-2032) (USD Million)

9.6.5.2 Brazil Competing Protocols Market Estimates and Forecasts, By End-User (2021-2032) (USD Million)

9.6.6 Argentina

9.6.6.1 Argentina Competing Protocols Market Estimates and Forecasts, By Type (2021-2032) (USD Million)

9.6.6.2 Argentina Competing Protocols Market Estimates and Forecasts, By End-User (2021-2032) (USD Million)

9.6.7 Rest of Latin America

9.6.7.1 Rest of Latin America Competing Protocols Market Estimates and Forecasts, By Type (2021-2032) (USD Million)

9.6.7.2 Rest of Latin America Competing Protocols Market Estimates and Forecasts, By End-User (2021-2032) (USD Million)

10. Company Profiles

10.1 Ericsson

              10.1.1 Company Overview

10.1.2 Financial

10.1.3 Products/ Services Offered

10.1.4 SWOT Analysis

10.2 F5 Networks

10.2.1 Company Overview

10.2.2 Financial

10.2.3 Products/ Services Offered

10.2.4 SWOT Analysis

10.3 Dialogic Corp

              10.3.1 Company Overview

10.3.2 Financial

10.3.3 Products/ Services Offered

10.3.4 SWOT Analysis

10.4 IBM

10.4.1 Company Overview

10.4.2 Financial

10.4.3 Products/ Services Offered

10.4.4 SWOT Analysis

10.5 Cisco Systems, Inc.

              10.5.1 Company Overview

10.5.2 Financial

10.5.3 Products/ Services Offered

10.5.4 SWOT Analysis

10.6 Synopsys, Inc.

10.6.1 Company Overview

10.6.2 Financial

10.6.3 Products/ Services Offered

10.6.4 SWOT Analysis

10.7 Juniper Networks, Inc.

              10.7.1 Company Overview

10.7.2 Financial

10.7.3 Products/ Services Offered

10.7.4 SWOT Analysis

10.8 Microsoft Corporation

              10.8.1 Company Overview

10.8.2 Financial

10.8.3 Products/ Services Offered

10.8.4 SWOT Analysis

10.9 Huawei Technologies Co., Ltd.

10.9.1 Company Overview

10.9.2 Financial

10.9.3 Products/ Services Offered

10.9.4 SWOT Analysis

10.10 Nokia Corporation

             10.10.1 Company Overview

10.10.2 Financial

10.10.3 Products/ Services Offered

10.10.4 SWOT Analysis

11. Use Cases and Best Practices

12. Conclusion

An accurate research report requires proper strategizing as well as implementation. There are multiple factors involved in the completion of good and accurate research report and selecting the best methodology to compete the research is the toughest part. Since the research reports we provide play a crucial role in any company’s decision-making process, therefore we at SNS Insider always believe that we should choose the best method which gives us results closer to reality. This allows us to reach at a stage wherein we can provide our clients best and accurate investment to output ratio.

Each report that we prepare takes a timeframe of 350-400 business hours for production. Starting from the selection of titles through a couple of in-depth brain storming session to the final QC process before uploading our titles on our website we dedicate around 350 working hours. The titles are selected based on their current market cap and the foreseen CAGR and growth.


The 5 steps process:

Step 1: Secondary Research:

Secondary Research or Desk Research is as the name suggests is a research process wherein, we collect data through the readily available information. In this process we use various paid and unpaid databases which our team has access to and gather data through the same. This includes examining of listed companies’ annual reports, Journals, SEC filling etc. Apart from this our team has access to various associations across the globe across different industries. Lastly, we have exchange relationships with various university as well as individual libraries.

Secondary Research

Step 2: Primary Research

When we talk about primary research, it is a type of study in which the researchers collect relevant data samples directly, rather than relying on previously collected data.  This type of research is focused on gaining content specific facts that can be sued to solve specific problems. Since the collected data is fresh and first hand therefore it makes the study more accurate and genuine.

We at SNS Insider have divided Primary Research into 2 parts.

Part 1 wherein we interview the KOLs of major players as well as the upcoming ones across various geographic regions. This allows us to have their view over the market scenario and acts as an important tool to come closer to the accurate market numbers. As many as 45 paid and unpaid primary interviews are taken from both the demand and supply side of the industry to make sure we land at an accurate judgement and analysis of the market.

This step involves the triangulation of data wherein our team analyses the interview transcripts, online survey responses and observation of on filed participants. The below mentioned chart should give a better understanding of the part 1 of the primary interview.

Primary Research

Part 2: In this part of primary research the data collected via secondary research and the part 1 of the primary research is validated with the interviews from individual consultants and subject matter experts.

Consultants are those set of people who have at least 12 years of experience and expertise within the industry whereas Subject Matter Experts are those with at least 15 years of experience behind their back within the same space. The data with the help of two main processes i.e., FGDs (Focused Group Discussions) and IDs (Individual Discussions). This gives us a 3rd party nonbiased primary view of the market scenario making it a more dependable one while collation of the data pointers.

Step 3: Data Bank Validation

Once all the information is collected via primary and secondary sources, we run that information for data validation. At our intelligence centre our research heads track a lot of information related to the market which includes the quarterly reports, the daily stock prices, and other relevant information. Our data bank server gets updated every fortnight and that is how the information which we collected using our primary and secondary information is revalidated in real time.

Data Bank Validation

Step 4: QA/QC Process

After all the data collection and validation our team does a final level of quality check and quality assurance to get rid of any unwanted or undesired mistakes. This might include but not limited to getting rid of the any typos, duplication of numbers or missing of any important information. The people involved in this process include technical content writers, research heads and graphics people. Once this process is completed the title gets uploader on our platform for our clients to read it.

Step 5: Final QC/QA Process:

This is the last process and comes when the client has ordered the study. In this process a final QA/QC is done before the study is emailed to the client. Since we believe in giving our clients a good experience of our research studies, therefore, to make sure that we do not lack at our end in any way humanly possible we do a final round of quality check and then dispatch the study to the client.

Key Segments: 

By Types

  • IPsec

  • 3Des

  • SSL

  • Others

By End-User

  • Personal Users

  • Corporate Users

Request for Segment Customization as per your Business Requirement: Segment Customization Request

Regional Coverage: 

North America

  • US

  • Canada

  • Mexico

Europe

  • Germany

  • France

  • UK

  • Italy

  • Spain

  • Poland

  • Turkey

  • Rest of Europe

Asia Pacific

  • China

  • India

  • Japan

  • South Korea

  • Singapore

  • Australia

  • Rest of Asia Pacific

Middle East & Africa

  • UAE

  • Saudi Arabia

  • Qatar

  • South Africa

  • Rest of Middle East & Africa

Latin America

  • Brazil

  • Argentina

  • Rest of Latin America

Request for Country Level Research Report: Country Level Customization Request

Available Customization 

With the given market data, SNS Insider offers customization as per the company’s specific needs. The following customization options are available for the report: 

  • Detailed Volume Analysis 

  • Criss-Cross segment analysis (e.g. Product X Application) 

  • Competitive Product Benchmarking 

  • Geographic Analysis 

  • Additional countries in any of the regions 

  • Customized Data Representation 

  • Detailed analysis and profiling of additional market players

Explore Key Insights.


  • Analyzes market trends, forecasts, and regional dynamics
  • Covers core offerings, innovations, and industry use cases
  • Profiles major players, value chains, and strategic developments
  • Highlights innovation trends, regulatory impacts, and growth opportunities
Request an Analyst Call