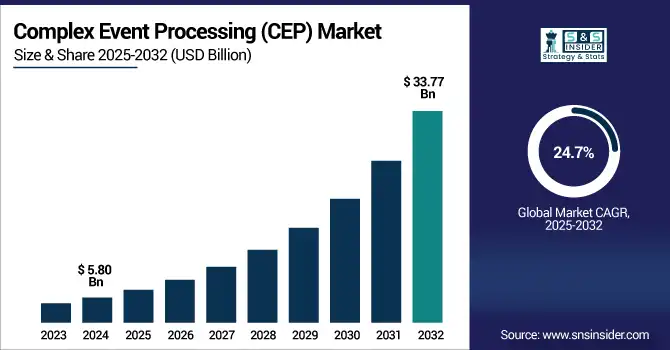
The Complex Event Processing (CEP) Market Size was valued at USD 5.80 billion in 2024 and is expected to reach USD 33.77 billion by 2032 and grow at a CAGR of 24.7% over the forecast period 2025-2032.
The Complex Event Processing (CEP) market is undergoing significant change as more organizations across industries increasingly use real-time analytics to discover patterns, anomalies, and trends from high-velocity data streams. Three major benefits of CEP are processing multiple events in parallel, allowing for faster decision making, which is used in applications like fraud detection, operational monitoring, and predictive maintenance. Increasing application in various sectors like financial services, healthcare, manufacturing, and retail, and growing elements of AI, IoT, and Edge computing are providing the market with considerable growth. It covers behavioural market dynamics, the advancements in technology, the various trends in deploying systems, as well as the strategies of key vendors.
The U.S. Complex Event Processing (CEP) market size was USD 1.53 billion in 2024 and is expected to reach USD 7.18 billion by 2032, growing at a CAGR of 21.30% over the forecast period of 2025–2032.
The U.S. CEP market is primarily driven by the growing need for real-time data analytics in sectors such, finance, healthcare, & manufacturing. As AI gets more sophisticated and the IoT proliferates, the demand for quick judgment and seamless operation is on the rise. North America is led by the U.S. on account of its advanced technology infrastructure, high IT expenditure, and presence of the major CEP vendors. These considerations sharpen the competitive CEP deployment and innovation advantage least in the U.S., the region best positioned to take advantage of CEP solutions.
Key Drivers:
Growing Demand for Real-Time Data Analytics in Finance and Healthcare Drives Complex Event Processing (CEP) Market Growth
The primary driver of the Complex Event Processing (CEP) market is the surging need for real-time data analytics across the finance and healthcare sectors. These industries generate massive volumes of fast-moving data from transactions, sensor networks, and patient monitoring systems that require immediate processing to enable quick, accurate decisions. For example, financial institutions use CEP to detect fraudulent transactions instantly, minimizing losses and enhancing security. Similarly, healthcare providers utilize CEP for continuous patient monitoring and emergency response. A significant development reinforcing this trend was IBM’s launch of its real-time event processing platform in March 2023, designed specifically for high-frequency financial data. This advancement underscores the importance of CEP in managing complex, high-velocity data streams efficiently.
Furthermore, the proliferation of IoT devices and AI-driven analytics intensifies the demand for CEP systems capable of processing and analyzing data on the fly. Consequently, organizations prioritize CEP adoption to gain competitive advantages through operational agility and improved customer experiences, fueling steady market expansion globally.
Restrains:
High Complexity in Integrating CEP Systems with Existing Legacy IT Infrastructure Restrains Market Growth
The CEP market is the high complexity and cost associated with integrating CEP solutions into existing legacy IT infrastructures. Many enterprises operate on outdated systems that lack compatibility with modern CEP technologies, making seamless integration a challenging and resource-intensive process. This complexity leads to extended deployment timelines, increased costs, and sometimes operational disruptions. Additionally, legacy systems often lack the scalability and flexibility required to handle large volumes of real-time event data, which diminishes the effectiveness of CEP implementations. Enterprises face difficulties in modifying or replacing these systems due to budget constraints and risk aversion, further delaying CEP adoption. Moreover, the need for specialized skills to design, configure, and maintain CEP solutions adds to the barrier. Without adequate integration frameworks or standardized protocols, many organizations hesitate to fully embrace CEP technology, slowing down its broader market penetration despite growing demand.
Opportunities:
Expanding Edge Computing Applications Present Lucrative Growth Opportunities for CEP Market
The increasing adoption of edge computing is creating substantial growth opportunities for the Complex Event Processing (CEP) market, particularly as enterprises seek to process data closer to the source to reduce latency and bandwidth use. Edge computing enables CEP to analyze event streams generated by IoT devices and sensors in real time, facilitating faster decision-making in industries like manufacturing, smart cities, and autonomous vehicles. A recent opportunity-strengthening development occurred in January 2025 when Microsoft Azure announced updates to its edge computing platform, enhancing native CEP support to handle complex event patterns efficiently at the network edge. This development allows businesses to deploy CEP applications directly on edge devices, reducing dependence on centralized cloud infrastructure and improving responsiveness. As more organizations adopt edge computing to manage their growing IoT ecosystems, CEP solutions will be critical for real-time analytics, anomaly detection, and predictive maintenance. This shift toward decentralized event processing offers CEP vendors a chance to innovate and expand their market share across emerging use cases.
Challenges:
Data Privacy and Security Concerns Pose Significant Challenges to Widespread CEP Adoption Across Industries
The Complex Event Processing (CEP) market is addressing increasing data privacy and security concerns amid real-time data collection and processing. CEP systems continuously ingest and analyze vast amounts of sensitive information from diverse sources, including personal user data, financial transactions, and critical infrastructure monitoring. This exposure creates vulnerabilities to cyberattacks, data breaches, and compliance risks with stringent data protection regulations like GDPR and CCPA. Ensuring that CEP solutions incorporate robust security frameworks, such as encryption, access controls, and real-time threat detection, is complex and costly. Furthermore, organizations must navigate evolving legal requirements, which vary across regions and industries, complicating CEP deployment strategies. These concerns lead some enterprises to delay or limit CEP implementation to avoid potential liabilities. Vendors must balance performance with security, investing heavily in secure architectures and compliance certifications. Overcoming these challenges is crucial to building trust and encouraging broader adoption of CEP technologies globally.
By Type
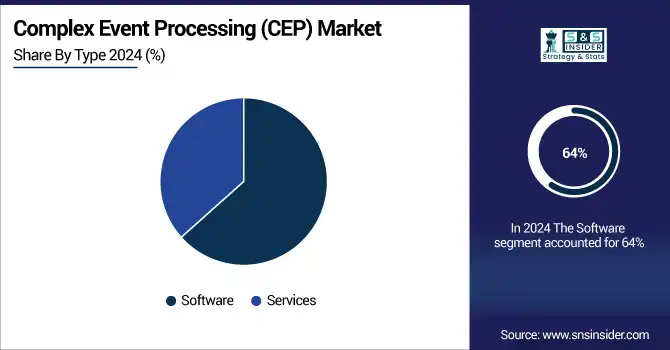
The Software segment holds the largest revenue share of 64% in 2024, driven by growing demand for advanced platforms that enable real-time processing of complex events. Continuous product enhancements focus on scalability, cloud integration, and improved event correlation, which support enterprises in handling high volumes of streaming data efficiently. The software solutions’ ability to provide fast analytics and decision-making capabilities makes this segment critical to the overall growth of the Complex Event Processing (CEP) market, as organizations prioritize data-driven agility and responsiveness.
The Services segment is expanding rapidly at a CAGR of 26.7%, fueled by increasing demand for professional consulting, system integration, and managed CEP solutions. Organizations require expert assistance to customize and deploy CEP platforms effectively, ensuring seamless integration with existing IT infrastructures. The complexity of real-time event processing drives the need for ongoing support and optimization services, making this segment vital in accelerating market adoption. Services enable businesses to maximize CEP benefits while overcoming technical and operational challenges.
By Enterprise Type
Large enterprises dominate with a 55% revenue share in 2024, leveraging extensive data resources and robust IT budgets to implement sophisticated CEP systems. Their need for high-volume data processing and real-time analytics supports complex use cases such as risk management and compliance. The scale and complexity of large organizations necessitate advanced CEP capabilities, reinforcing this segment’s leadership in the market. Continuous innovation in processing speed and event correlation further drives adoption among these enterprises.
The Small and Medium Enterprise (SME) segment is growing at a CAGR of 25.7%, benefiting from the increasing availability of affordable, scalable CEP solutions. SMEs are rapidly adopting real-time analytics to improve operational agility and customer responsiveness without heavy infrastructure investment. This segment’s expansion reflects the growing accessibility of CEP technologies, enabling smaller organizations to compete effectively in data-driven markets.
By End-user Vertical
The BFSI vertical leads the market with a 15% revenue share in 2024 due to its critical need for real-time fraud detection, risk management, and regulatory compliance. Real-time event processing is essential for monitoring financial transactions and identifying suspicious activities promptly. The vertical’s stringent operational requirements and data sensitivity drive demand for highly reliable and secure CEP solutions.
The Managed Mobility segment is growing rapidly at a CAGR of 27.13%, driven by the proliferation of IoT devices and connected vehicle technologies. Real-time event processing is crucial for managing distributed mobile networks, ensuring optimal resource utilization, and rapid issue resolution. The increasing complexity of mobile ecosystems fuels the demand for scalable CEP solutions that provide continuous monitoring and analytics. This vertical’s dynamic growth reflects expanding opportunities for CEP applications in emerging mobility and smart infrastructure domains.
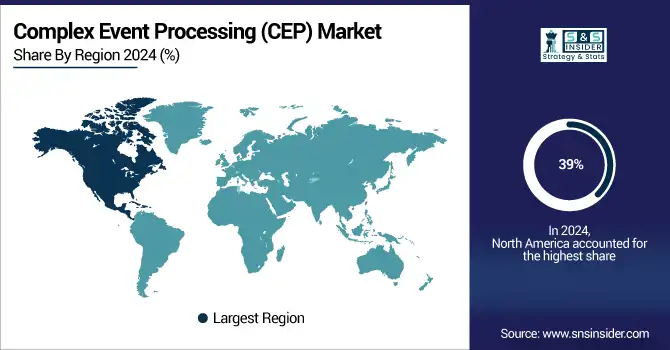
North America holds approximately 39% of the Complex Event Processing (CEP) market in 2024. Advanced technology infrastructure and high adoption of AI, IoT, and cloud computing drive CEP market dominance in North America. The United States dominates North America’s CEP market due to its robust IT ecosystem, extensive investments in research and development, and early adoption of cutting-edge technologies. Strong demand across financial services, healthcare, and manufacturing sectors for real-time analytics fuels growth. Additionally, the presence of major technology vendors and cloud service providers accelerates innovation and deployment of CEP solutions, reinforcing the U.S. leadership position in the regional market.
Asia Pacific is expected to grow at a CAGR of 31.01% during the forecast period. Rapid digital transformation, increasing IoT adoption, and government initiatives drive the fast growth of the CEP market in Asia Pacific. China leads the Asia Pacific CEP market due to its massive IoT deployment and digital infrastructure expansion. The government’s push for smart cities, Industry 4.0, and real-time data analytics accelerates CEP adoption. Growing industrial automation and e-commerce sectors increase demand for event processing to optimize operations and enhance customer experiences. Investments in AI and cloud technologies further strengthen China’s position as the regional CEP market leader.
Europe holds a significant share of the CEP market in 2024, driven by regulatory compliance needs and digital innovation across industries such as finance, manufacturing, and telecommunications. Strict data protection laws and Industry 4.0 adoption propel the CEP market growth in Europe, especially in Germany. Germany stands out as the dominant country due to its strong industrial base and early adoption of Industry 4.0 practices. The country’s emphasis on smart manufacturing and data-driven decision-making fuels CEP demand.
The Middle East & Africa and Latin America CEP markets are emerging regions witnessing steady growth in 2024. Increasing digital transformation initiatives and expanding IT infrastructure create new opportunities for CEP adoption. Governments are investing in smart city projects and improving data management capabilities to enhance public services. Though smaller compared to other regions, these markets show promising growth potential driven by rising demand for real-time analytics in sectors like telecommunications, energy, and finance.
The complex event processing (CEP) market includes IBM Corporation, SAP SE, Oracle Corporation, Tibco Software Inc., Software AG, SAS Institute Inc., Informatica Corporation, Nastel Technologies Inc., Espertech Inc., Cisco Systems Inc., and Others.
IBM announced the availability of the Event Processing Add-On for its Cloud Pak for Integration (CP4I). This add-on integrates Apache Flink-based event processing capabilities, allowing users to create and deploy event-driven solutions using a low-code visual editor.
SAP released SAP S/4HANA Cloud Private Edition 2023 FPS02, introducing advanced AI-assisted capabilities and expanding its digital assistant, Joule. Notably, the release includes AI-driven conversational planning in the transportation cockpit, allowing users to interact with the system using natural language for complex transportation decisions.
In 2024, Oracle announced the addition of AI Vector Search capabilities to its Database 23c. This feature introduces a new vector data type, vector indexes, and vector search SQL operators, enabling the database to store and query the semantic content of documents, images, and other unstructured data as vectors.
Report Attributes | Details |
---|---|
Market Size in 2024 | USD 5.80 Billion |
Market Size by 2032 | USD 33.77 Billion |
CAGR | CAGR of 24.7% From 2025 to 2032 |
Base Year | 2024 |
Forecast Period | 2025-2032 |
Historical Data | 2021-2023 |
Report Scope & Coverage | Market Size, Segments Analysis, Competitive Landscape, Regional Analysis, DROC & SWOT Analysis, Forecast Outlook |
Key Segments | • By Type (Software, Services) • By Enterprise Type (Small and Medium Enterprise, Large Enterprise) • By End-user Vertical (BFSI, Managed Mobility, Government and Defense, Retail, Healthcare, Telecom and IT Industry, Media and Entertainment, Manufacturing, Other End-user Verticals) |
Regional Analysis/Coverage | North America (US, Canada, Mexico), Europe (Germany, France, UK, Italy, Spain, Poland, Turkey, Rest of Europe), Asia Pacific (China, India, Japan, South Korea, Singapore, Australia, Taiwan, Rest of Asia Pacific), Middle East & Africa (UAE, Saudi Arabia, Qatar, South Africa, Rest of Middle East & Africa), Latin America (Brazil, Argentina, Rest of Latin America) |
Company Profiles | IBM Corporation, SAP SE, Oracle Corporation, Tibco Software Inc., Software AG, SAS Institute Inc., Informatica Corporation, Nastel Technologies Inc., Espertech Inc., Cisco Systems Inc., and Others. |
Ans: The Complex Event Processing (CEP) Market is expected to grow at a CAGR of 24.7% during 2025-2032.
Ans: The Complex Event Processing (CEP) Market size was USD 5.80 billion in 2024 and is expected to reach USD 33.77 billion by 2032.
Ans: The major growth factor of the Complex Event Processing (CEP) market is the increasing demand for real-time data analytics across various industries to enable faster, data-driven decision-making.
Ans: The BFSI segment dominated the Complex Event Processing (CEP) Market.
Ans: North America dominated the Complex Event Processing (CEP) Market in 2024.
Table of Contents
1. Introduction
1.1 Market Definition
1.2 Scope (Inclusion and Exclusions)
1.3 Research Assumptions
2. Executive Summary
2.1 Market Overview
2.2 Regional Synopsis
2.3 Competitive Summary
3. Research Methodology
3.1 Top-Down Approach
3.2 Bottom-up Approach
3.3. Data Validation
3.4 Primary Interviews
4. Market Dynamics Impact Analysis
4.1 Market Driving Factors Analysis
4.1.1 Drivers
4.1.2 Restraints
4.1.3 Opportunities
4.1.4 Challenges
4.2 PESTLE Analysis
4.3 Porter’s Five Forces Model
5. Statistical Insights and Trends Reporting
5.1 Latency Benchmarks and Performance SLAs
5.2 Interoperability Statistics
5.3 Pattern Detection Accuracy Rate
5.4 CEP Governance and Audit Metrics
6. Competitive Landscape
6.1 List of Major Companies, By Region
6.2 Market Share Analysis, By Region
6.3 Product Benchmarking
6.3.1 Product specifications and features
6.3.2 Pricing
6.4 Strategic Initiatives
6.4.1 Marketing and promotional activities
6.4.2 Distribution and Supply Chain Strategies
6.4.3 Expansion plans and new Product launches
6.4.4 Strategic partnerships and collaborations
6.5 Technological Advancements
6.6 Market Positioning and Branding
7. Complex Event Processing (CEP) Market Segmentation By Type
7.1 Chapter Overview
7.2 Software
7.2.1 Software Market Trends Analysis (2021-2032)
7.2.2 Software Market Size Estimates and Forecasts to 2032 (USD Billion)
7.3 Services
7.3.1 Services Market Trends Analysis (2021-2032)
7.3.2 Services Market Size Estimates and Forecasts to 2032 (USD Billion)
8. Complex Event Processing (CEP) Market Segmentation By Enterprise Size
8.1 Chapter Overview
8.2 Small & Mid-sized Enterprises
8.2.1 Small & Mid-sized Enterprises Market Trend Analysis (2021-2032)
8.2.2 Small & Mid-sized Enterprises Market Size Estimates and Forecasts to 2032 (USD Billion)
8.3 Large Enterprises
8.3.1 Large Enterprises Market Trends Analysis (2021-2032)
8.3.2 Large Enterprises Market Size Estimates and Forecasts to 2032 (USD Billion)
9. Complex Event Processing (CEP) Market Segmentation By End User Vertical
9.1 Chapter Overview
9.2 BFSI
9.2.1 BFSI Market Trends Analysis (2021-2032)
9.2.2 BFSI Market Size Estimates and Forecasts to 2032 (USD Billion)
9.3 Managed Mobility
9.3.1 Managed Mobility Market Trends Analysis (2021-2032)
9.3.2 Managed Mobility Market Size Estimates and Forecasts to 2032 (USD Billion)
9.4 Government and Defense
9.4.1 Government and Defense Market Trends Analysis (2021-2032)
9.4.2 Government and Defense Market Size Estimates and Forecasts to 2032 (USD Billion)
9.5 Retail
9.5.1 Retail Market Trends Analysis (2021-2032)
9.5.2 Retail Market Size Estimates and Forecasts to 2032 (USD Billion)
9.6 Healthcare
9.6.1 Healthcare Market Trends Analysis (2021-2032)
9.6.2 Healthcare Market Size Estimates and Forecasts to 2032 (USD Billion)
9.7 Telecom and IT Industry
9.7.1 Telecom and IT Industry Market Trends Analysis (2021-2032)
9.7.2 Telecom and IT Industry Market Size Estimates and Forecasts to 2032 (USD Billion)
9.8 Media and Entertainment
9.8.1 Media and Entertainment Market Trends Analysis (2021-2032)
9.8.2 Media and Entertainment Market Size Estimates and Forecasts to 2032 (USD Billion)
9.9 Manufacturing
9.9.1 Manufacturing Market Trends Analysis (2021-2032)
9.9.2 Manufacturing Market Size Estimates and Forecasts to 2032 (USD Billion)
9.10 Other
9.10.1 Other Market Trends Analysis (2021-2032)
9.10.2 Other Market Size Estimates and Forecasts to 2032 (USD Billion)
10. Regional Analysis
10.1 Chapter Overview
10.2 North America
10.2.1 Trends Analysis
10.2.2 North America Complex Event Processing (CEP) Market Estimates and Forecasts, by Country (2021-2032) (USD Billion)
10.2.3 North America Complex Event Processing (CEP) Market Estimates and Forecasts, By Type (2021-2032) (USD Billion)
10.2.4 North America Complex Event Processing (CEP) Market Estimates and Forecasts, By Enterprise Size (2021-2032) (USD Billion)
10.2.5 North America Complex Event Processing (CEP) Market Estimates and Forecasts, By End User Vertical (2021-2032) (USD Billion)
10.2.6 USA
10.2.6.1 USA Complex Event Processing (CEP) Market Estimates and Forecasts, By Type (2021-2032) (USD Billion)
10.2.6.2 USA Complex Event Processing (CEP) Market Estimates and Forecasts, By Enterprise Size (2021-2032) (USD Billion)
10.2.6.3 USA Complex Event Processing (CEP) Market Estimates and Forecasts, By End User Vertical (2021-2032) (USD Billion)
10.2.7 Canada
10.2.7.1 Canada Complex Event Processing (CEP) Market Estimates and Forecasts, By Type (2021-2032) (USD Billion)
10.2.7.2 Canada Complex Event Processing (CEP) Market Estimates and Forecasts, By Enterprise Size (2021-2032) (USD Billion)
10.2.7.3 Canada Complex Event Processing (CEP) Market Estimates and Forecasts, By End User Vertical (2021-2032) (USD Billion)
10.2.8 Mexico
10.2.8.1 Mexico Complex Event Processing (CEP) Market Estimates and Forecasts, By Type (2021-2032) (USD Billion)
10.2.8.2 Mexico Complex Event Processing (CEP) Market Estimates and Forecasts, By Enterprise Size (2021-2032) (USD Billion)
10.2.8.3 Mexico Complex Event Processing (CEP) Market Estimates and Forecasts, By End User Vertical (2021-2032) (USD Billion)
10.3 Europe
10.3.1 Trends Analysis
10.3.2 Europe Complex Event Processing (CEP) Market Estimates and Forecasts, by Country (2021-2032) (USD Billion)
10.3.3 Europe Complex Event Processing (CEP) Market Estimates and Forecasts, By Type (2021-2032) (USD Billion)
10.3.4 Europe Complex Event Processing (CEP) Market Estimates and Forecasts, By Enterprise Size (2021-2032) (USD Billion)
10.3.5 Europe Complex Event Processing (CEP) Market Estimates and Forecasts, By End User Vertical(2021-2032) (USD Billion)
10.3.6 Germany
10.3.1.6.1 Germany Complex Event Processing (CEP) Market Estimates and Forecasts, By Type (2021-2032) (USD Billion)
10.3.1.6.2 Germany Complex Event Processing (CEP) Market Estimates and Forecasts, By Enterprise Size (2021-2032) (USD Billion)
10.3.1.6.3 Germany Complex Event Processing (CEP) Market Estimates and Forecasts, By End User Vertical (2021-2032) (USD Billion)
10.3.7 France
10.3.7.1 France Complex Event Processing (CEP) Market Estimates and Forecasts, By Type (2021-2032) (USD Billion)
10.3.7.2 France a Complex Event Processing (CEP) Market Estimates and Forecasts, By Enterprise Size (2021-2032) (USD Billion)
10.3.7.3 France Complex Event Processing (CEP) Market Estimates and Forecasts, By End User Vertical (2021-2032) (USD Billion)
10.3.8 UK
10.3.8.1 UK Complex Event Processing (CEP) Market Estimates and Forecasts, By Type (2021-2032) (USD Billion)
10.3.8.2 UK Complex Event Processing (CEP) Market Estimates and Forecasts, By Enterprise Size (2021-2032) (USD Billion)
10.3.8.3 UK Complex Event Processing (CEP) Market Estimates and Forecasts, By End User Vertical (2021-2032) (USD Billion)
10.3.9 Italy
10.3.9.1 Italy Complex Event Processing (CEP) Market Estimates and Forecasts, By Type (2021-2032) (USD Billion)
10.3.9.2 Italy Complex Event Processing (CEP) Market Estimates and Forecasts, By Enterprise Size (2021-2032) (USD Billion)
10.3.9.3 Italy Complex Event Processing (CEP) Market Estimates and Forecasts, By End User Vertical (2021-2032) (USD Billion)
10.3.10 Spain
10.3.10.1 Spain Complex Event Processing (CEP) Market Estimates and Forecasts, By Type (2021-2032) (USD Billion)
10.3.10.2 Spain Complex Event Processing (CEP) Market Estimates and Forecasts, By Enterprise Size (2021-2032) (USD Billion)
10.3.10.3 Spain Complex Event Processing (CEP) Market Estimates and Forecasts, By End User Vertical (2021-2032) (USD Billion)
10.3.12 Poland
10.3.12.1 Poland Complex Event Processing (CEP) Market Estimates and Forecasts, by Country (2021-2032) (USD Billion)
10.3.12.1 Poland Complex Event Processing (CEP) Market Estimates and Forecasts, By Type (2021-2032) (USD Billion)
10.3.12.3 Poland Complex Event Processing (CEP) Market Estimates and Forecasts, By Enterprise Size (2021-2032) (USD Billion)
10.3.12.3 Poland Complex Event Processing (CEP) Market Estimates and Forecasts, By End User Vertical (2021-2032) (USD Billion)
10.3.13 Turkey
10.3.13.1 Turkey Complex Event Processing (CEP) Market Estimates and Forecasts, By Type (2021-2032) (USD Billion)
10.3.13.2 Turkey Complex Event Processing (CEP) Market Estimates and Forecasts, By Enterprise Size (2021-2032) (USD Billion)
10.3.13.3 Turkey Complex Event Processing (CEP) Market Estimates and Forecasts, By End User Vertical (2021-2032) (USD Billion)
10.3.14 Rest of Europe
10.3.14.1 Rest of Europe Complex Event Processing (CEP) Market Estimates and Forecasts, By Type (2021-2032) (USD Billion)
10.3.14.2 Rest of Europe Complex Event Processing (CEP) Market Estimates and Forecasts, By Enterprise Size (2021-2032) (USD Billion)
10.3.14.3 Rest of Europe Complex Event Processing (CEP) Market Estimates and Forecasts, By End User Vertical(2021-2032) (USD Billion)
10.4 Asia-Pacific
10.4.1 Trends Analysis
10.4.2 Asia-Pacific Complex Event Processing (CEP) Market Estimates and Forecasts, by Country (2021-2032) (USD Billion)
10.4.3 Asia-Pacific Complex Event Processing (CEP) Market Estimates and Forecasts, By Type (2021-2032) (USD Billion)
10.4.4 Asia-Pacific Complex Event Processing (CEP) Market Estimates and Forecasts, By Enterprise Size (2021-2032) (USD Billion)
10.4.5 Asia-Pacific Complex Event Processing (CEP) Market Estimates and Forecasts, By End User Vertical (2021-2032) (USD Billion)
10.4.6 China
10.4.6.1 China Complex Event Processing (CEP) Market Estimates and Forecasts, By Type (2021-2032) (USD Billion)
10.4.6.2 China Complex Event Processing (CEP) Market Estimates and Forecasts, By Enterprise Size (2021-2032) (USD Billion)
10.4.6.3 China Complex Event Processing (CEP) Market Estimates and Forecasts, By End User Vertical (2021-2032) (USD Billion)
10.4.7 India
10.4.7.1 India Complex Event Processing (CEP) Market Estimates and Forecasts, By Type (2021-2032) (USD Billion)
10.4.7.2 India Complex Event Processing (CEP) Market Estimates and Forecasts, By Enterprise Size (2021-2032) (USD Billion)
10.4.7.3 India Complex Event Processing (CEP) Market Estimates and Forecasts, By End User Vertical (2021-2032) (USD Billion)
10.4.8 Japan
10.4.8.1 Japan Complex Event Processing (CEP) Market Estimates and Forecasts, By Type (2021-2032) (USD Billion)
10.4.8.2 Japan Complex Event Processing (CEP) Market Estimates and Forecasts, By Enterprise Size (2021-2032) (USD Billion)
10.4.8.3 Japan Complex Event Processing (CEP) Market Estimates and Forecasts, By End User Vertical (2021-2032) (USD Billion)
10.4.9 South Korea
10.4.9.1 South Korea Complex Event Processing (CEP) Market Estimates and Forecasts, By Type (2021-2032) (USD Billion)
10.4.9.2 South Korea Complex Event Processing (CEP) Market Estimates and Forecasts, By Enterprise Size (2021-2032) (USD Billion)
10.4.9.3 South Korea Complex Event Processing (CEP) Market Estimates and Forecasts, By End User Vertical (2021-2032) (USD Billion)
10.4.10 Singapore
10.4.10.1 Singapore Complex Event Processing (CEP) Market Estimates and Forecasts, By Type (2021-2032) (USD Billion)
10.4.10.2 Singapore Complex Event Processing (CEP) Market Estimates and Forecasts, By Enterprise Size (2021-2032) (USD Billion)
10.4.10.3 Singapore Complex Event Processing (CEP) Market Estimates and Forecasts, By End User Vertical (2021-2032) (USD Billion)
10.4.11 Australia
10.4.11.1 Australia Complex Event Processing (CEP) Market Estimates and Forecasts, By Type (2021-2032) (USD Billion)
10.4.11.2 Australia Complex Event Processing (CEP) Market Estimates and Forecasts, By Enterprise Size (2021-2032) (USD Billion)
10.4.11.3 Australia Complex Event Processing (CEP) Market Estimates and Forecasts, By End User Vertical (2021-2032) (USD Billion)
10.4.12 Rest of Asia-Pacific
10.4.12.1 Rest of Asia-Pacific Complex Event Processing (CEP) Market Estimates and Forecasts, By Type (2021-2032) (USD Billion)
10.4.12.2 Rest of Asia-Pacific Complex Event Processing (CEP) Market Estimates and Forecasts, By Enterprise Size (2021-2032) (USD Billion)
10.4.12.3 Rest of Asia-Pacific Complex Event Processing (CEP) Market Estimates and Forecasts, By End User Vertical (2021-2032) (USD Billion)
10.5 Middle East and Africa
10.5.1 Trends Analysis
10.5.2 Middle East and Africa East Complex Event Processing (CEP) Market Estimates and Forecasts, by Country (2021-2032) (USD Billion)
10.5.3Middle East and Africa Complex Event Processing (CEP) Market Estimates and Forecasts, By Type (2021-2032) (USD Billion)
10.5.4 Middle East and Africa Complex Event Processing (CEP) Market Estimates and Forecasts, By Enterprise Size (2021-2032) (USD Billion)
10.5.5 Middle East and Africa Complex Event Processing (CEP) Market Estimates and Forecasts, By End User Vertical (2021-2032) (USD Billion)
10.5.6 UAE
10.5.6.1 UAE Complex Event Processing (CEP) Market Estimates and Forecasts, By Type (2021-2032) (USD Billion)
10.5.6.2 UAE Complex Event Processing (CEP) Market Estimates and Forecasts, By Enterprise Size (2021-2032) (USD Billion)
10.5.6.3 UAE Complex Event Processing (CEP) Market Estimates and Forecasts, By End User Vertical (2021-2032) (USD Billion)
10.5.7 Saudi Arabia
10.5.7.1 Saudi Arabia Complex Event Processing (CEP) Market Estimates and Forecasts, By Type (2021-2032) (USD Billion)
10.5.7.2 Saudi Arabia Complex Event Processing (CEP) Market Estimates and Forecasts, By Enterprise Size (2021-2032) (USD Billion)
10.5.7.3 Saudi Arabia Complex Event Processing (CEP) Market Estimates and Forecasts, By End User Vertical (2021-2032) (USD Billion)
10.5.8 Qatar
10.5.8.1 Qatar Complex Event Processing (CEP) Market Estimates and Forecasts, By Type (2021-2032) (USD Billion)
10.5.8.2 Qatar Complex Event Processing (CEP) Market Estimates and Forecasts, By Enterprise Size (2021-2032) (USD Billion)
10.5.8.3 Qatar Complex Event Processing (CEP) Market Estimates and Forecasts, By End User Vertical (2021-2032) (USD Billion)
10.5.9 South Africa
10.5.9 1 South Africa Complex Event Processing (CEP) Market Estimates and Forecasts, By Type (2021-2032) (USD Billion)
10.5.9 2 South Africa Complex Event Processing (CEP) Market Estimates and Forecasts By Enterprise Size (2021-2032) (USD Billion)
10.5.9 3 South Africa Complex Event Processing (CEP) Market Estimates and Forecasts, By End User Vertical (2021-2032) (USD Billion)
10.5.10 Rest of Middle East & Africa
10.5.10.1 Rest of Middle East & Africa Complex Event Processing (CEP) Market Estimates and Forecasts, By Type (2021-2032) (USD Billion)
10.5.10.2 Rest of Middle East & Africa Complex Event Processing (CEP) Market Estimates and Forecasts, By Enterprise Size (2021-2032) (USD Billion)
10.5.10.3 Rest of Middle East & Africa Complex Event Processing (CEP) Market Estimates and Forecasts, By End User Vertical (2021-2032) (USD Billion)
10.6 Latin America
10.6.1 Trends Analysis
10.6.2 Latin America Complex Event Processing (CEP) Market Estimates and Forecasts, by Country (2021-2032) (USD Billion)
10.6.3 Latin America Complex Event Processing (CEP) Market Estimates and Forecasts, By Type (2021-2032) (USD Billion)
10.6.4 Latin America Complex Event Processing (CEP) Market Estimates and Forecasts, By Enterprise Size (2021-2032) (USD Billion)
10.6.5 Latin America Complex Event Processing (CEP) Market Estimates and Forecasts, By End User Vertical (2021-2032) (USD Billion)
10.6.6 Brazil
10.6.6.1 Brazil Complex Event Processing (CEP) Market Estimates and Forecasts, By Type (2021-2032) (USD Billion)
10.6.6.2 Brazil Complex Event Processing (CEP) Market Estimates and Forecasts, By Enterprise Size (2021-2032) (USD Billion)
10.6.6.3 Brazil Complex Event Processing (CEP) Market Estimates and Forecasts, By End User Vertical (2021-2032) (USD Billion)
10.6.7 Argentina
10.6.7.1 Argentina Complex Event Processing (CEP) Market Estimates and Forecasts, By Type (2021-2032) (USD Billion)
10.6.7.2 Argentina Complex Event Processing (CEP) Market Estimates and Forecasts, By Enterprise Size (2021-2032) (USD Billion)
10.6.7.3 Argentina Complex Event Processing (CEP) Market Estimates and Forecasts, By End User Vertical (2021-2032) (USD Billion)
10.6.8 Rest of Latin America
10.6.8.1 Rest of Latin America Complex Event Processing (CEP) Market Estimates and Forecasts, By Type (2021-2032) (USD Billion)
10.6.8.2 Rest of Latin America Complex Event Processing (CEP) Market Estimates and Forecasts, By Enterprise Size (2021-2032) (USD Billion)
10.6.8.3 Rest of Latin America Complex Event Processing (CEP) Market Estimates and Forecasts, By End User Vertical (2021-2032) (USD Billion)
12. Company Profiles
12.1 IBM Corporation
12.1.1 Company Overview
12.1.2 Financial
12.1.3 Products/ Services Offered
12.1.4 SWOT Analysis
12.2 SAP SE
12.2.1 Company Overview
12.2.2 Financial
12.2.3 Products/ Services Offered
12.2.4 SWOT Analysis
12.3 Oracle Corporation
12.3.1 Company Overview
12.3.2 Financial
12.3.3 Products/ Services Offered
12.3.4 SWOT Analysis
12.4 Tibco Software Inc.
12.4.1 Company Overview
12.4.2 Financial
12.4.3 Products/ Services Offered
12.4.4 SWOT Analysis
12.5 Software AG
12.5.1 Company Overview
12.5.2 Financial
12.5.3 Products/ Services Offered
12.5.4 SWOT Analysis
12.6 SAS Institute Inc.
12.6.1 Company Overview
12.6.2 Financial
12.6.3 Products/ Services Offered
12.6.4 SWOT Analysis
12.7 Informatica Corporation
12.7.1 Company Overview
12.7.2 Financial
12.7.3 Products/ Services Offered
12.7.4 SWOT Analysis
12.8 Nastel Technologies Inc.
12.8.1 Company Overview
12.8.2 Financial
12.8.3 Products/ Services Offered
12.8.4 SWOT Analysis
12.9 Espertech Inc.
12.9.1 Company Overview
12.9.2 Financial
12.9.3 Products/ Services Offered
12.9.4 SWOT Analysis
12.10 Cisco Systems Inc.
12.10.1 Company Overview
12.10.2 Financial
12.10.3 Products/ Services Offered
12.10.4 SWOT Analysi
12. Use Cases and Best Practices
13. Conclusion
An accurate research report requires proper strategizing as well as implementation. There are multiple factors involved in the completion of good and accurate research report and selecting the best methodology to compete the research is the toughest part. Since the research reports we provide play a crucial role in any company’s decision-making process, therefore we at SNS Insider always believe that we should choose the best method which gives us results closer to reality. This allows us to reach at a stage wherein we can provide our clients best and accurate investment to output ratio.
Each report that we prepare takes a timeframe of 350-400 business hours for production. Starting from the selection of titles through a couple of in-depth brain storming session to the final QC process before uploading our titles on our website we dedicate around 350 working hours. The titles are selected based on their current market cap and the foreseen CAGR and growth.
The 5 steps process:
Step 1: Secondary Research:
Secondary Research or Desk Research is as the name suggests is a research process wherein, we collect data through the readily available information. In this process we use various paid and unpaid databases which our team has access to and gather data through the same. This includes examining of listed companies’ annual reports, Journals, SEC filling etc. Apart from this our team has access to various associations across the globe across different industries. Lastly, we have exchange relationships with various university as well as individual libraries.
Step 2: Primary Research
When we talk about primary research, it is a type of study in which the researchers collect relevant data samples directly, rather than relying on previously collected data. This type of research is focused on gaining content specific facts that can be sued to solve specific problems. Since the collected data is fresh and first hand therefore it makes the study more accurate and genuine.
We at SNS Insider have divided Primary Research into 2 parts.
Part 1 wherein we interview the KOLs of major players as well as the upcoming ones across various geographic regions. This allows us to have their view over the market scenario and acts as an important tool to come closer to the accurate market numbers. As many as 45 paid and unpaid primary interviews are taken from both the demand and supply side of the industry to make sure we land at an accurate judgement and analysis of the market.
This step involves the triangulation of data wherein our team analyses the interview transcripts, online survey responses and observation of on filed participants. The below mentioned chart should give a better understanding of the part 1 of the primary interview.
Part 2: In this part of primary research the data collected via secondary research and the part 1 of the primary research is validated with the interviews from individual consultants and subject matter experts.
Consultants are those set of people who have at least 12 years of experience and expertise within the industry whereas Subject Matter Experts are those with at least 15 years of experience behind their back within the same space. The data with the help of two main processes i.e., FGDs (Focused Group Discussions) and IDs (Individual Discussions). This gives us a 3rd party nonbiased primary view of the market scenario making it a more dependable one while collation of the data pointers.
Step 3: Data Bank Validation
Once all the information is collected via primary and secondary sources, we run that information for data validation. At our intelligence centre our research heads track a lot of information related to the market which includes the quarterly reports, the daily stock prices, and other relevant information. Our data bank server gets updated every fortnight and that is how the information which we collected using our primary and secondary information is revalidated in real time.
Step 4: QA/QC Process
After all the data collection and validation our team does a final level of quality check and quality assurance to get rid of any unwanted or undesired mistakes. This might include but not limited to getting rid of the any typos, duplication of numbers or missing of any important information. The people involved in this process include technical content writers, research heads and graphics people. Once this process is completed the title gets uploader on our platform for our clients to read it.
Step 5: Final QC/QA Process:
This is the last process and comes when the client has ordered the study. In this process a final QA/QC is done before the study is emailed to the client. Since we believe in giving our clients a good experience of our research studies, therefore, to make sure that we do not lack at our end in any way humanly possible we do a final round of quality check and then dispatch the study to the client.
Key Segments:
By Type
Software
Services
By Enterprise Type
Small and Medium Enterprise
Large Enterprise
By End-user Vertical
BFSI
Managed Mobility
Government and Defense
Retail
Healthcare
Telecom and IT Industry
Media and Entertainment
Manufacturing
Other End-user Verticals
Request for Segment Customization as per your Business Requirement: Segment Customization Request
Regional Coverage:
North America
US
Canada
Mexico
Europe
Germany
France
UK
Italy
Spain
Poland
Turkey
Rest of Europe
Asia Pacific
China
India
Japan
South Korea
Singapore
Australia
Rest of Asia Pacific
Middle East & Africa
UAE
Saudi Arabia
Qatar
South Africa
Rest of Middle East & Africa
Latin America
Brazil
Argentina
Rest of Latin America
Request for Country Level Research Report: Country Level Customization Request
Available Customization
With the given market data, SNS Insider offers customization as per the company’s specific needs. The following customization options are available for the report:
Detailed Volume Analysis
Criss-Cross segment analysis (e.g. Product X Application)
Competitive Product Benchmarking
Geographic Analysis
Additional countries in any of the regions
Customized Data Representation
Detailed analysis and profiling of additional market players