Compression Therapy Market Report Scope & Overview:
Get more information on Compression Therapy Market - Request Free Sample Report
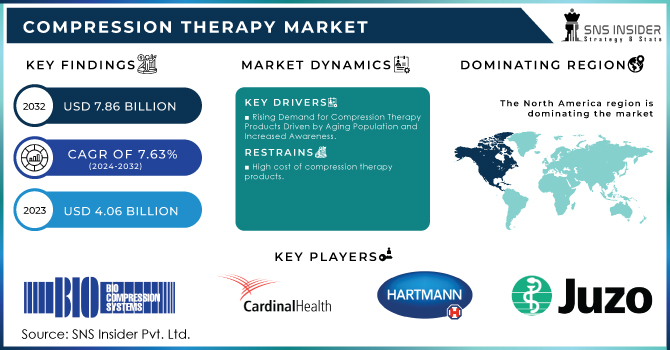
The Compression Therapy Market size was valued at USD 4.06 Billion in 2023 & is estimated to reach USD 7.86 Billion by 2032 with a growing CAGR of 7.63% over the forecast period of 2024-2032.
Compression therapy is a burgeoning market propelled by the convergence of an aging population, escalating chronic disease prevalence, and rising healthcare expenditures. The market encompasses a diverse product range, from stockings and sleeves to garments and pumps, designed to exert controlled pressure on limbs, enhancing circulation and mitigating swelling. Key applications span across venous insufficiency, lymphedema, DVT prevention, and post-surgical recovery—the increasing incidence of obesity and diabetes, both circulatory risk factors, further fuels market expansion. Growing awareness among healthcare providers and patients about compression therapy's benefits is driving adoption. According to a Frontiers Media S.A. report from September 2023, the global incidence is five cases per 100,000 people. This figure is significantly higher in older populations, with rates reaching approximately 20 cases per 100,000 among those aged 70-79. Consequently, the demand for treatment options like compression stockings and bandages is on the rise.
Market demand is robust, driven by a growing geriatric population susceptible to circulatory disorders, and the expanding prevalence of chronic diseases like diabetes and obesity. The rising incidence of sedentary lifestyles and occupations that involve prolonged standing or sitting also contribute to the demand for compression therapy products. Osteoporosis, a condition affecting one in three women and one in five men over 50, significantly increases the risk of fractures, creating a substantial demand for effective treatment and prevention solutions such as compression therapy. The prevalence of osteoporosis is significantly elevated in patients with underlying health conditions like inflammatory bowel disease, celiac disease, and various cancers, among others. Nearly 40 million Americans suffer from varicose veins according to Chicago Vein Institute. Moreover, chronic venous insufficiency affects approximately 150,000 new patients annually, with healthcare costs reaching nearly USD 500 million according to NCBI, 2024.
Orthopedic surgeries and obesity are key drivers of compression therapy demand. The surge in orthopedic procedures, driven by an aging population, sports injuries, and advanced surgical techniques, has significantly increased the need for postoperative compression therapy. For instance, the American College of Rheumatology reports over 790,000 knee and 544,000 hip replacements annually.
Post-surgery swelling and inflammation make compression therapy essential for recovery. Concurrently, the global obesity epidemic is escalating. With over 2.5 billion overweight adults worldwide according to WHO, 2022 and obesity linked to a six-fold increased risk of venous insufficiency, the demand for compression therapy for managing related conditions is on the rise.
Supply is generally adequate to meet current demand, with various manufacturers offering products across various price points and compression levels. However, ensuring consistent product quality and availability can be challenging, particularly in regions with limited healthcare infrastructure.
Government initiatives and regulatory approvals significantly influence the compression therapy market. Reimbursement policies for compression therapy products vary across different healthcare systems, impacting product accessibility and affordability. Regulatory frameworks governing product safety, efficacy, and labeling are crucial for consumer protection and market integrity. Additionally, government-funded research and development initiatives can drive innovation and market growth.
Tactile Medical has conducted over 25 clinical studies involving 2,100+ patients to evaluate the safety and efficacy of its Flexitouch System. These studies assessed clinical outcomes, cost-effectiveness, patient satisfaction, and quality-of-life improvements associated with the product.
The year 2023 saw significant advancements in patient-centric compression therapy. A notable example is the Hosiery Hunter app, launched by medi UK. This mobile application aids clinicians in selecting optimal compression hosiery for patients with lower limb conditions. By simplifying the decision-making process and providing quick access to prescriptions, the app addresses challenges like time constraints and knowledge gaps, ultimately improving patient care.
Despite challenges such as reimbursement hurdles and product efficacy concerns, technological advancements like gradient compression and smart compression garments are introducing innovative solutions. Overall, the compression therapy market presents substantial growth opportunities, especially in regions with aging populations and robust healthcare systems.
MARKET DYNAMICS
Drivers
-
Rising Demand for Compression Therapy Products Driven by Aging Population and Increased Awareness
The aging population, characterized by a higher prevalence of chronic conditions such as venous insufficiency, lymphedema, and diabetes, is a primary driver. Additionally, the rising incidence of obesity, a risk factor for circulatory issues, is contributing to increased demand. The surge in orthopedic surgeries, necessitating post-operative care, has also boosted market growth. Furthermore, heightened awareness of compression therapy's benefits in managing various ailments, coupled with technological advancements in product design and functionality, are expanding market opportunities. Rising disposable incomes are enabling greater access to these products, further stimulating market expansion.
Restraints
-
High cost of compression therapy products
-
Lack of awareness
In certain regions, there is insufficient knowledge about the benefits of compression therapy, hindering adoption rates.
-
Incorrect product usage
Improper application of compression garments can lead to discomfort and reduced efficacy, affecting patient compliance.
-
Reimbursement challenges
Obtaining insurance coverage for compression therapy products can be complex and time-consuming, impacting patient affordability.
-
Product availability
Limited availability of specific compression products, especially in rural or underserved areas, can pose challenges.
-
Skin irritations
Some patients may experience skin reactions due to prolonged use of compression garments, affecting product compliance.
KEY SEGMENTATION
By Technology
Static compression therapy dominated the market in 2023, capturing a 69.2% share. This method includes consistent pressure to improve circulation and reduce swelling. Its ease of use and effectiveness in treating conditions like varicose veins and DVT have made it popular. However, the dynamic compression therapy segment is projected to grow at a CAGR of 4.3%, driven by its adjustable pressure levels and suitability for post-surgical recovery.
By Distribution Channel
Institutional sales dominated the compression therapy market in 2023, capturing a 60.4% share. This channel, encompassing hospitals, clinics, and nursing homes, benefits from bulk purchases, reduced marketing costs, and strong customer relationships. The growing elderly population and rising chronic diseases are driving demand for compression therapy products in these settings.
Conversely, retail sales are projected to expand at a CAGR of 4.7%. Offering direct consumer access, product variety, and convenience, this channel is gaining traction.
By End-use
Hospitals led the compression therapy market in 2023 with a 32.6% share. Their comprehensive care capabilities and access to advanced resources make them preferred treatment centers. The home healthcare segment is projected to grow at a CAGR of 5.0%, driven by patient preference for at-home management and advancements in wearable technology.
Regional Analysis
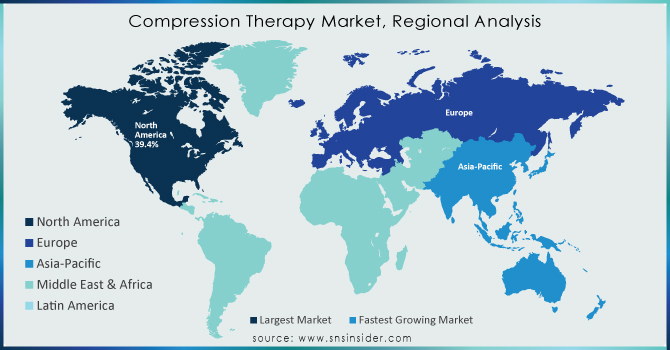
North America dominated the compression therapy market in 2023, holding a 42.77% revenue share. Technological advancements, high prevalence of chronic diseases, and robust healthcare infrastructure fueled growth. The U.S., with over 25 million varicose vein sufferers, is a key market. Europe is also a significant market, driven by aging populations and advanced healthcare systems. The UK and Germany are notable contributors. Asia Pacific is the fastest-growing region, led by China and India due to rising chronic disease burdens and increasing geriatric populations. Middle East and Africa offer emerging opportunities, with Saudi Arabia showing particular promise due to high CVI prevalence. Overall, the global compression therapy market is characterized by regional disparities in market maturity, with North America and Europe leading and Asia Pacific demonstrating rapid growth.
Need any customization research on Compression Therapy Market - Enquiry Now
Key Players
Some major key players in Compression Therapy Market are Bio Compression Systems, Inc., Cardinal Health, Hartmann AG, Julius Zorn GmbH, SIGVARIS, Medi GmbH & Co., ArjoHuntleigh, BSN Medical GmbH, Spectrum Healthcare, 3M Health Care and other players.
RECENT DEVELOPMENT
-
Medi GmbH Co. extended its compression therapy helps in June 2023 with new circular and flat-knit variants.
-
MediWound partnered with 3M in October 2023 for a phase III clinical trial of EscharEx.
-
Tactile Medical secured a patent in September 2023 for a novel compression garment system with adjustable pressure.
| Report Attributes | Details |
| Market Size in 2023 | US$ 4.06 Bn |
| Market Size by 2032 | US$ 7.86 Bn |
| CAGR | CAGR of 7.63% From 2024 to 2032 |
| Base Year | 2023 |
| Forecast Period | 2024-2032 |
| Historical Data | 2020-2022 |
| Report Scope & Coverage | Market Size, Segments Analysis, Competitive Landscape, Regional Analysis, DROC & SWOT Analysis, Forecast Outlook |
| Key Segments | • By Technology [Static Compression Therapy (Compression Bandages, Compression Stockings, Compression Tape, Others Compression Garments), Dynamic Compression Therapy (Compression Pumps, Compression Sleeves) • By Distribution Channel [Institutional Sales, Retail Sales] • By End-use [Hospitals, Specialty Clinics, Home healthcare, Physician’s Office, Nursing Homes, Others] |
| Regional Analysis/Coverage | North America (US, Canada, Mexico), Europe (Eastern Europe [Poland, Romania, Hungary, Turkey, Rest of Eastern Europe] Western Europe] Germany, France, UK, Italy, Spain, Netherlands, Switzerland, Austria, Rest of Western Europe]). Asia Pacific (China, India, Japan, South Korea, Vietnam, Singapore, Australia, Rest of Asia Pacific), Middle East & Africa (Middle East [UAE, Egypt, Saudi Arabia, Qatar, Rest of Middle East], Africa [Nigeria, South Africa, Rest of Africa], Latin America (Brazil, Argentina, Colombia Rest of Latin America) |
| Company Profiles | Bio Compression Systems, Inc., Cardinal Health, Hartmann AG, Julius Zorn GmbH, SIGVARIS, Medi GmbH & Co., ArjoHuntleigh, BSN Medical GmbH, Spectrum Healthcare, 3M Health Care |
| Key Drivers | • Rising Demand for Compression Therapy Products Driven by Aging Population and Increased Awareness |
| Market Restraints | • High cost of compression therapy products • Lack of awareness • Incorrect product usage • Reimbursement challenges • Product availability • Skin irritations |
Frequently Asked Questions
Ans. Some of the top market trends include the increasing use of compression bandages and stockings for the treatment of venous leg ulcers and lymphedema, as well as strategic expenditures by key companies in extending treatment alternatives.
Ans. The rising frequency of venous and lymphatic illnesses, as well as increased research and development activity in this industry, are driving market expansion.
Ans. By product type, the compression garment category is the market leader.
Ans. USD 7.86 Billion is the projected Compression Therapy Market size of the market by 2032.
Ans. The Compound Annual Growth rate for Compression Therapy Market over the forecast period is 7.63%.
Get in Touch
