Computational Fluid Dynamics Market Report Scope & Overview:
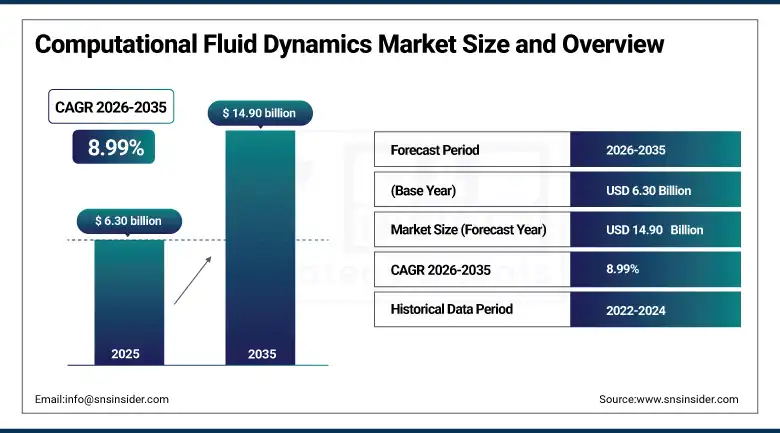
The Computational Fluid Dynamics Market was valued at USD 6.30 billion in 2025 and is expected to reach 14.90 billion by 2035, growing at a CAGR of 8.99% from 2026–2035.
The market for computational fluid dynamics (CFD) includes all of the software tools, computer hardware, and professional services involved in modeling fluid dynamics and heat transfer systems, including turbulent flows and multiphase systems, for industrial and scientific purposes. This market involves software solutions for conducting CFD simulations of aerodynamics and hydraulics systems, as well as for designing thermal systems using virtual prototyping techniques. Computer hardware necessary for running such large simulations includes powerful computers with multiple CPUs, Graphics Processing Units (GPUs), or even computer systems operating via the cloud environment. Professional services include consulting, implementation, and training activities related to the introduction and usage of CFD software in organizations.
Market Size and Forecast
-
Market Size in 2026E: USD 6.86 Billion
-
Market Size by 2035: USD 14.90 Billion
-
CAGR: 8.99% from 2026 to 2035
-
Fastest Growing Region: Asia Pacific
-
Largest Region: North America
To Get more information On Computational Fluid Dynamics Market - Request Free Sample Report
Computational Fluid Dynamics Market Trends
-
Adoption of CFD software is accelerating for energy-efficient product designs globally.
-
Cloud-based CFD platforms enable faster simulations and reduced infrastructure investment requirements.
-
AI and ML integration in CFD improves accuracy and simulation efficiency significantly.
-
SMEs increasingly access advanced CFD tools through cloud-based and subscription models.
-
CFD optimizes aerodynamics and fluid flow, reducing energy consumption and operational costs.
-
Cross-industry digital transformation drives higher adoption of CFD for complex engineering simulations.
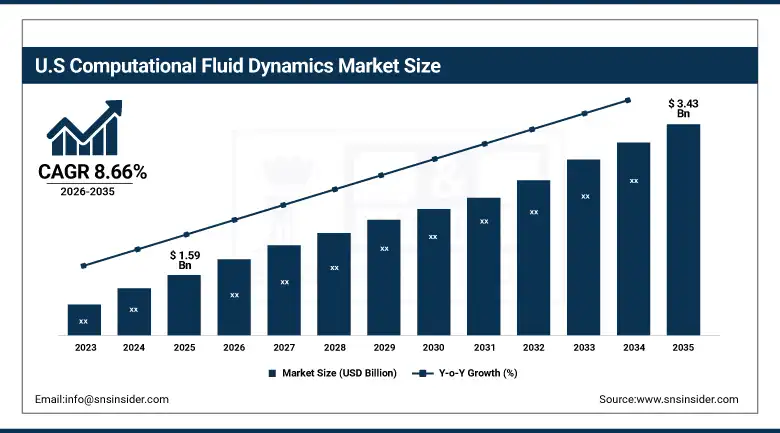
The U.S. Computational Fluid Dynamics Market Outlook
The U.S. Computational Fluid Dynamics Market was valued at approximately USD 1.59 billion in 2025 and is expected to reach approximately USD 3.43 billion by 2035, growing at a CAGR of 8.66%
The computational fluid dynamics market in the United States is expanding owing to increased use of simulation-based design across aerospace, automotive, energy, semiconductors, and the healthcare sectors. The increasing focus on developing electric vehicles, new generation aircraft, renewable energy solutions, and performance electronics drives the need for analysis of fluid flow and heat transfer. Growing use of cloud infrastructure, artificial intelligence, and digital twins enhances growth, and robust research and development spending by the government and defense sectors fosters innovation and commercialization.
Computational Fluid Dynamics Market Segment Analysis
-
By Deployment Mode: In 2025, On-Premise led the market with share 60.30%, while Cloud-Based is the fastest-growing segment with a CAGR 12.50%.
-
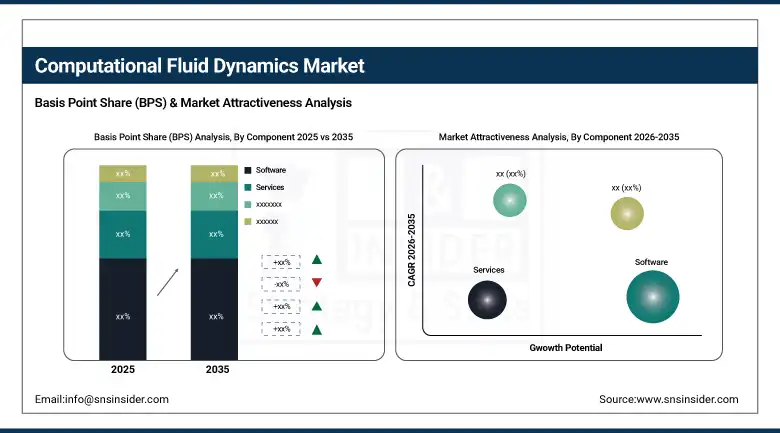
By Component: In 2025, Software led the market with share 55.50%, while Services are the fastest-growing segment with a CAGR 11.20%.
-
By Application: In 2025, Aerodynamics & Hydrodynamics led the market with share 28.40%, while Multiphase Flow is the fastest-growing segment with a CAGR 11.80%.
-
By End-User Industry: In 2025, Aerospace & Defense led the market with share 32.60%, while Energy & Power is the fastest-growing segment with a CAGR 12.40%.
By Deployment Mode, on-premise deployment dominates while cloud-based adoption accelerates rapidly
The on-premise deployment category emerged as the largest segment for computational fluid dynamics (CFD) with a 60.30% share in 2025 owing to rising demand from the aerospace and defense sector, the automotive industry, and the energy sector for enhanced levels of data security, reduced latency in computing, and control over the infrastructure needed to conduct the simulation process. The need for conducting complex simulations associated with turbulence, thermal, and Multiphysics models in high performance computing (HPC) is driving large enterprises to invest in their own computing platforms. Cloud CFD emerges as the fastest growing deployment format with a compound annual growth rate of 12.50%, owing to benefits like cost savings and easy access to cloud based HPC platforms.
By Component, Software segment leads the market while services witness strong growth
The software component dominated the computational fluid dynamics market in 2025, contributing 55.50% of overall revenue owing to the increasing use of simulation software in engineering-centric industries. CFD simulation software provides virtual testing, optimization of designs, analysis of thermal management and aerodynamics, and other simulations, thus facilitating reduced costs of physical prototypes and fast product development. The increasing adoption of artificial intelligence, automation, digital twins, and Multiphysics simulation further augments software adoption. Industries like aerospace, automotive, electronics, and industrial manufacturing continue to make huge investments in simulation-based product design and development. Services represent the most rapidly growing segment in terms of CAGR at 11.20% driven by high demand for consulting, customization, technical services, validation, and simulation services from enterprises that lack in-house skills for CFD simulation.
By Application, aerodynamics & hydrodynamics applications lead while multiphase flow gains momentum
The aerodynamics and hydrodynamics applications accounted for the largest share of the computational fluid dynamics market at 28.40% in 2025. The use of CFD simulations is significant in the optimization of airflow, drag reduction, fuel consumption, lift efficiency, and fluid dynamics surrounding cars, airplanes, and marine systems. The growing number of electric cars, advanced aircraft, unmanned aerial vehicles, and high-efficiency machinery is continually contributing to increased demands for aerodynamic modeling software. On the other hand, multiphase flows are the fastest-growing application of CFD in 2025, with a compound annual growth rate of 11.80%. Multiphase flows refer to the analysis of fluid dynamics involving liquids, gases, and particulates in various processes. This application of CFD simulations has been growing steadily due to the rising application in the oil & gas industry, chemical manufacturing, pharmaceuticals, energy, and biomedical devices.
Regional Analysis
|
Region |
Major Country |
Share within Region, 2025 (%) |
|---|---|---|
|
North America |
United States |
84.2% |
|
Europe |
France |
35.4% |
|
Asia Pacific |
China |
43.6% |
|
Middle East & Africa |
UAE |
37.7% |
|
Latin America |
Brazil |
43.3% |
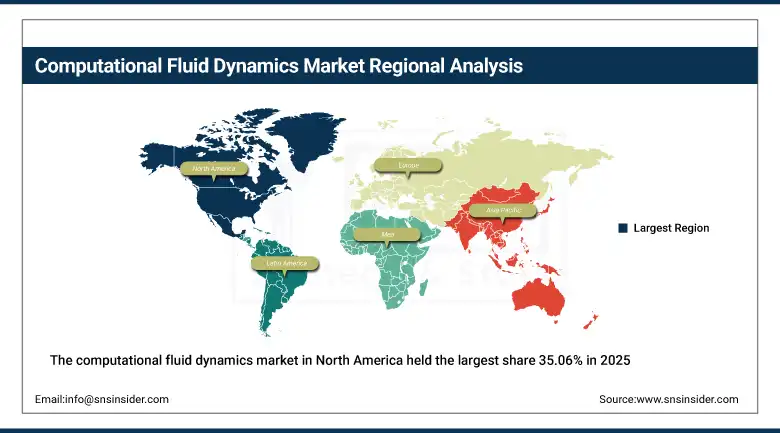
North America Computational Fluid Dynamics Market Insights
The computational fluid dynamics market in North America held the largest share 35.06% in 2025, due to the large number of aerospace, automotive, and defense companies. Highly developed R&D infrastructure, early adoption of next-gen technologies, and strong investments in simulation-based product development further drives growth in the region. Today, more and more North American companies are using CFD to reduce prototyping costs and speed new product development cycles for analyzing aerodynamics, thermal management, and fluid flow. Top providers like ANSYS, Siemens, Dassault Systèmes, and Altair Engineering dominate this area with high-end solutions. Apart from this, market growth is also driven by energy efficiency and convenience of digital transformation in industries.
Get Customized Report as per Your Business Requirement - Enquiry Now
Europe Computational Fluid Dynamics Market Insights
The computational fluid dynamics (CFD) market in Europe accounts for a considerable portion, due to high adoption in aerospace, automotive and energy. Due to energy-efficient and sustainable product designs, this region focuses on thermal management, fluid flow optimization, and aerodynamic analysis using CFD solutions. AI, machine learning, and cloud-based platform integration makes simulation more accurate, speeds up development cycles, and cuts computational costs as well. Major players in the industry keep on innovating and providing advanced software and services in the domain of CFD. Continuous efforts of digital transformation and green engineering boost the acceptance of CFD solutions among European industries, thereby bolstering the overall market growth.
Asia Pacific Computational Fluid Dynamics Market Insights
In 2025, Asia-Pacific is the fastest-growing region in the computational fluid dynamics market with a CAGR 10.14%, due to major factors such as the rapid industrialization in this region, increased research and development investments, and increasing aerospace, automotive, and energy sectors in many countries like in particular China, India, and Japan. Cloud-based &AI/ML-powered CFD solutions are becoming more popular in the region as they allow faster simulations, and reduced infrastructure costs while enhancing the product development cycle. Small and medium enterprises (SMEs) and startups are integrating more efficient computational fluid dynamics (CFD) tools into their workflow at an incredible rate to optimize designs economically while conducting thermal, fluid, and aerodynamic analysis. Government initiatives focusing on innovation, renewable energy projects as well as digital transformation will further boost the market, and Asia-Pacific is a significant growth region for CFD software and services.
MEA & Latin America Computational Fluid Dynamics Market Insights
The Latin America (LATAM) and Middle East & Africa (MEA) regions are emerging economies in computational fluid dynamics (CFD), spurred by industrialization and energy infrastructure improvements, as well as a growing demand for advanced engineering solutions. CFD software is used by organizations to optimize fluid flow, thermal management, and aerodynamic designs while minimizing the costs of prototyping and enhancing the efficiency of the products. Cloud-based, AI-powered CFD solutions are increasingly having demand for fast simulations and the ability to run efficiently on-demand. Despite a comparatively smaller market share than North America and Europe, further investment in renewable energy, digital transformation programs, and the growth of industry provides a compelling potential market for CFD to LATAM and MEA.
Market Dynamics
Growth Drivers: Rising demand for energy-efficient engineering designs accelerates global computational fluid dynamics market growth.
One of the key reasons behind the rising popularity and expansion of the CFD market is the requirement for energy efficient products from various sectors such as aerospace, automotive, and energy. Companies must design systems that consume less fuel and manage heat efficiently while operating at maximum efficiency. The use of CFD software helps in simulation of flow of liquids and gases along with heat transfer and aerodynamics without making any physical prototypes. Automotive companies, for example, can reduce drag coefficients and increase the efficiency of their products with the help of CFD based aerodynamic simulation. Energy companies make the best use of CFD technology by optimizing their cooling systems, which not only reduces cost but minimizes environmental pollution as well.
Energy and power plants leveraging CFD for cooling system optimization can reduce operational costs by 15–20%.
Restraints: High costs and technical complexity continue to restrict widespread adoption of advanced computational fluid dynamics solutions.
Despite the benefits, High cost and technical complexity are key restraints hampering the growth of the computational fluid dynamics market. Particularly for commercial CFD software which not only demands costly licenses but also a large amount of investment in high-performance computing hardware. CFD also requires specialized knowledge in various topics such as, but not limited to, fluid dynamics, numerical modeling, and solver setups, creating an additional barrier for small and medium businesses to using these solutions. And mistreatment of CFD can result in erroneous findings, speeding up reluctance from firms lacking skilled workforce. These high-end CFD tools require frequent software updates, training, and maintenance, which in turn adds to the operational costs, as a result of which they become less accessible to smaller organizations thereby limiting market penetration.
Opportunities: Cloud-Based deployment and ai integration create strong growth opportunities for the computational fluid dynamics market.
There remains a huge opportunity in moving computational fluid dynamics market solutions to the cloud and enhancing the capabilities by integrating AI/ML. Cloud deployment mitigates the costly on-premise hardware and permits engineers to run complex simulations with higher speed and flexibility. Faster iterations of the product and increasing collaboration across geographies as companies can scale their computational resources as demand grows. In parallel, the integration of AI and machine learning enhances solver performance, follows complex flow phenomena, and automates repetitive work, compressing simulation duration. The trend emerges as an opportunity that helps broaden the market and penetrates the small and medium-sized enterprises (SMEs), Start-ups and research institutions and enables them to purchase advanced CFD capabilities without, up-front capital expenditure making innovation and discovery possible.
Cloud-based deployment reduces the need for expensive on-premise hardware, lowering capital expenditure by 25–40%.
Recent Developments:
-
In February 2025, ANSYS introduced the Flamelet-Generated Manifold (FGM) model in its Fluent 2025 R1 release, significantly reducing simulation times from weeks to a single working day while maintaining high fidelity.
-
In June 2025, Siemens expanded its partnership with NVIDIA to integrate AI capabilities into Simcenter Star-CCM+, enhancing simulation accuracy and efficiency.
-
In August 2025, Dassault Systèmes launched the 2025 edition of SIMULIA's Computational Fluid Dynamics simulations, offering fast, high-fidelity solutions for applications like eVTOL flight and automotive fuel efficiency certification.
Computational Fluid Dynamics Market Key Players
-
Siemens Digital Industries Software
-
Dassault Systèmes
-
Autodesk Inc.
-
Comsol Inc.
-
Altair Engineering Inc.
-
Hexagon Ab
-
Cadence Design Systems Inc.
-
Simscale Gmbh
-
Convergent Science Inc.
-
Avl List Gmbh
-
Gamma Technologies Inc.
-
Flow Science Inc.
-
Cpfd Software Llc
-
Tecplot Inc.
-
Opencfd Ltd.
-
Beta Cae Systems
-
Cham Ltd.
-
Cradle Cfd
-
Flexcompute Inc.
-
Rescale Inc.
Computational Fluid Dynamics Market Report Scope:
| Report Attributes | Details |
|---|---|
| Market Size in 2025 | USD 6.30 Billion |
| Market Size by 2035 | USD 14.90 Billion |
| CAGR | CAGR of 8.99% From 2026 to 2035 |
| Base Year | 2025 |
| Forecast Period | 2026-2035 |
| Historical Data | 2022-2024 |
| Report Scope & Coverage | Market Size, Segments Analysis, Competitive Landscape, Regional Analysis, DROC & SWOT Analysis, Forecast Outlook |
| Key Segments | • By Component (Software, Services, Hardware) • By Deployment Mode (On-Premises, Cloud-Based, Hybrid) • By Application (Aerospace & Defense, Automotive, Energy & Power, Electronics & Semiconductor, Industrial Manufacturing, Healthcare & Biomedical) • By End-User (Aerospace & Defense Companies, Automotive OEMs & Suppliers, Energy & Utility Companies, Manufacturing & Industrial Enterprises, Academic & Research Institutions, Healthcare & Life Sciences Organizations) |
| Regional Analysis/Coverage | North America (US, Canada), Europe (Germany, UK, France, Italy, Spain, Russia, Poland, Rest of Europe), Asia Pacific (China, India, Japan, South Korea, Australia, ASEAN Countries, Rest of Asia Pacific), Middle East & Africa (UAE, Saudi Arabia, Qatar, South Africa, Rest of Middle East & Africa), Latin America (Brazil, Argentina, Mexico, Colombia, Rest of Latin America). |
| Company Profiles | Siemens Digital Industries Software, Dassault Systèmes, Autodesk Inc., COMSOL Inc., Altair Engineering Inc., Hexagon AB, Cadence Design Systems Inc., SimScale GmbH, Convergent Science Inc., AVL List GmbH, Gamma Technologies Inc., Flow Science Inc., CPFD Software LLC, Tecplot Inc., OpenCFD Ltd., Beta CAE Systems, CHAM Ltd., Cradle CFD, Flexcompute Inc., Rescale Inc.. |
Frequently Asked Questions
Ans: North America dominated the Computational Fluid Dynamics Market in 2025.
Ans: The software segment dominated the Computational Fluid Dynamics Market.
Ans: The major growth factor of the Computational Fluid Dynamics (CFD) market is the increasing demand for accurate, efficient, and cost-effective simulation tools across industries.
The Computational Fluid Dynamics Market was valued at USD 6.30 billion in 2025.
The Computational Fluid Dynamics Market is expected to grow at a CAGR of 8.99% from 2026 to 2035.
Get in Touch
