Computer Aided Engineering Market Report Scope & Overview:
To get more information on Computer Aided Engineering Market - Request Free Sample Report
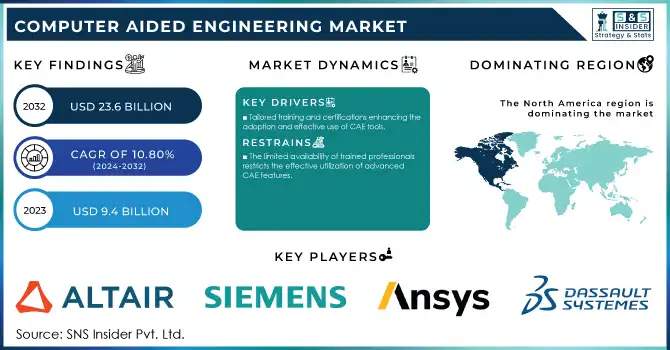
The Computer Aided Engineering Market was valued at USD 9.4 Billion in 2023 and is expected to reach USD 23.6 Billion by 2032, growing at a CAGR of 10.80% from 2024-2032.
The CAE Market is experiencing significant growth due to its ability to transform product design, simulation, and analysis. CAE tools play an important role because they allow engineers to test and optimize designs virtually before building any physical prototype making the process both time and cost-effective. That has rendered them invaluable to different sectors that desire operational efficiency and enhanced quality of products. The transition to cloud-based solutions from on-premise software is a significant contributing factor to market growth. The cloud-based CAE platforms provide more scalability, affordability, and accessibility as organizations of every size can now utilize advanced engineering tools for their most complex problems powered by the cloud without investing heavily in infrastructure. The same change also facilitates collaborative workflows, which allows teams to work seamlessly across locations. In industries like automotive, aerospace, and electronics, accuracy and innovation count with CAE penetration. CAE tools are used by automotive manufacturers to refine designs to meet aerodynamic, thermal, and structural performance limits. The aerospace and electronics industries, for example, depend on a sophisticated CAE that ensures high performance and reliability of value chain products.
The adoption of new technologies is another important growth driver. With the incorporation of AI and ML into CAE solutions, predictive analytics and automating engineering processes are enabling early detection of potential design issues. The availability of high-performance computing and network infrastructure, along with requirements for rapid design cycles, is further expanding the horizons of CAE applications. Value-added resellers (VARs) have become a key enabler in driving greater adoption of CAE tools through customized training, support, and certifications. These services assist organizations in fully leveraging the CAE solution with optimum implementation and utilization. The increasing availability of these resources is another factor driving the growth of the market.
The CAE market is powered by the need for efficient and cost-effective design processes, along with the growing incorporation of advanced technologies. With industries placing an increasing emphasis on innovation and quality, CAE tools are expected to be in more demand, firmly establishing CAE tools as a fundamental element of modern engineering and product development.
Market Dynamics
Drivers
-
Tailored training and certifications enhancing the adoption and effective use of CAE tools.
Industry-specific training and certifications are critical in enabling organizations to embrace and make the most out of Computer-Aided Engineering tools. Offered by value-added resellers or software vendors, these programs are designed to train engineers and technical teams on how to extract maximum capabilities from CAE solutions. With its customized courses catering to the specific needs of industries, such training is aimed at ensuring maximum integration of CAE tools with the design and simulation workflows in use, thus improving accuracy and productivity while reducing errors. Having some certification in this area only strengthens your professional expertise and credibility, allowing you to execute complex simulations and analyses with ease. This is especially important for industries where precision is key, such as automotive, aerospace, and electronics. With sophisticated CAE functionalities, certified professionals can maximize product quality, reduce compliance risks, and accelerate development cycles.
Training developed specifically for small and medium-sized enterprises builds confidence to use advanced technologies when SMEs had limited previous interaction with CAEs. It fills the chasm between technology providers and users by enabling the seamless integration of CAE tools into user workflows. This allows organizations to get the most value from all of the benefits of CAE including the reduced cost, higher design accuracy, and more efficient operations. Specialized training and certifications play a key role in increasing the number of users in the dynamic CAE market. Thus, these programs help industries maintain their competitiveness by embracing next-generation engineering solutions to propel innovation in product design and development.
-
Increased adoption of cloud platforms for scalability, cost-effectiveness, and enhanced collaboration.
-
Rising need to reduce costs and time associated with physical prototyping through virtual simulations.
Restraints
-
The limited availability of trained professionals restricts the effective utilization of advanced CAE features.
The lack of trained professionals is one of the main challenges to effectively leveraging the newer advanced Computer-Aided Engineering tools. CAE solutions are niche objects requiring a good understanding of engineering fundamentals, and functional knowledge of software and simulation methodologies. The techniques are complex simulations, optimization, and real-time data analysis, and require engineers and designers, who can take full advantage of these tools. However, unskilled professionals who cannot get used to the advanced features can be a hindrance to the proliferation of CAE tools and hence limit the benefits of CAE.
The demand for CAE professionals is even more high in industries such as automotive, aerospace, and electronics where accuracy and innovation are a matter of high concern. Contemporary CAE tools, considering those blended with AI, ML, and other high-end simulation techniques, call for professionals with a blend of technical and domain knowledge. Unless properly trained some of the employees might not be able to use these tools effectively leading to poor design, longer development time, and increased cost.
This is a particularly difficult gap for small and medium-sized enterprises to bridge, as many simply do not have the resources to dedicate to special training programs. Consequently, these companies may encounter challenges when implementing and using CAE tools, ultimately restricting their capability to remain competitive. To learn more about CAE solutions, many companies resort to training programs, certifications, and VAR partnerships to overcome this hurdle and fill the skills gap to harness the full potential of CAE solutions.
-
The substantial investment required for software licenses, hardware, and training limits adoption, especially for SMEs.
-
Cloud-based CAE solutions raise issues about data privacy and intellectual property protection.
Segment Analysis
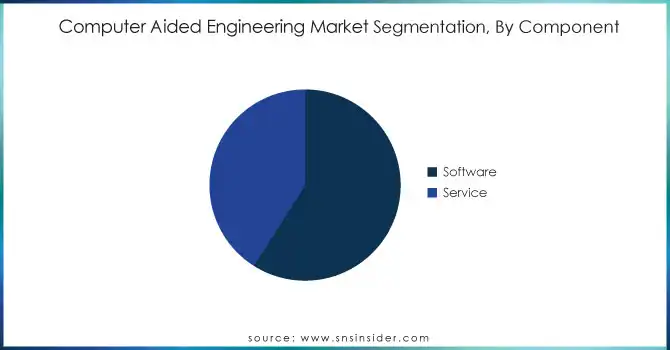
By Component
In 2023, the software segment dominated the market and represented revenue share of more than 59% in 2023. driven by advantages like data safety and reliability along with non-escalating testing. Bringing all this scalable engineering work together, the software optimizes the engineering tasks and is primarily used for robustness, and performance checks of the components and assemblies.
The sector is further divided based on software types including Finite Element Analysis, Computational Fluid Dynamics, multi-body dynamics, as well as optimization & simulation. FEA is a computational analysis method used to calculate product strength concerning the loading. FEA is done on real components and can simulate heat transfer in solid bodies, the structural analysis steps involved in the manufacturing process, problems in electromagnetic potential, and the steps involving mass transport between domains.
The service segment is expected to register the fastest CAGR during the forecast period. The segment growth is attributed to increasing awareness among companies and governments, of processes for product development using virtually enabled procedures. Enterprises are adopting design and consulting, implementation, and maintenance services are also becoming one of the preferred service options.
By Deployment
The on-premise segment dominated the market and accounted for a revenue share of more than 65% in 2023, Software is a fast-paced industry, and timely development and introducing new products to the market is critical to any firm in this sector. Companies are acquiring new technologies, It brings flexibility, security, scalability, and of course easy access to data. Additionally, it delivers a solution to the CAE users that is specific to their application as a cloud-based CAE, which is delivered to the CAE users as Software-as-a-Service. Thus, based on the deployment model, cloud-based is expected to depict the highest growth over the forecast period.
The cloud segment is expected to register the fastest CAGR during the forecast period, deploying a cloud basis allows you to distribute quickly, maintain less, reduce cost as well as create more scalable. While the costs to implement software on-premise raised an additional expense on the software deployment and up-gradation costs.
Regional Analysis
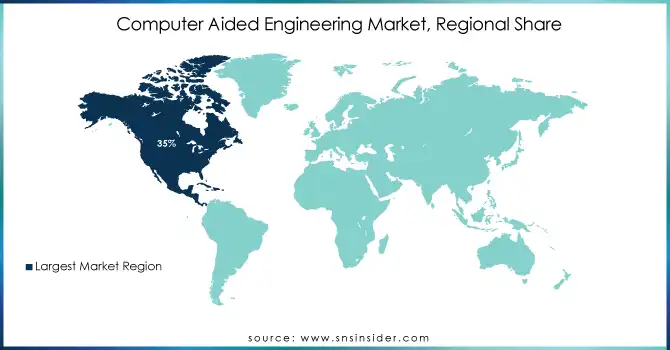
North America dominated the market and accounted for more than 35.0% share in 2023 and the region is expected to continue to dominate over the forecast period, due to the presence of bio-diverse cultures and integration of automation into the manufacturing sector. Shifting focus toward greenhouse gas emissions and innovations in newer battery technologies is expected to stimulate the North American regional market. Other factors also supporting the North American regional market share are the high penetration rate of IoT and the rising cost of defense.
The APAC regional market revenue is estimated to grow at the fastest CAGR during the forecast period. The positive outlook is due to increasing investment in the developing manufacturing sector in most of the countries, both in developed and developing nations, Expected to grow owing to growing government investments for capacity expansion of renewable energy generation. This is expected to propel the industry demand owing to the increasing automation of industrial equipment.
Get Customized Report as per Your Business Requirement - Enquiry Now
Key Players:
Major players in the market are Altair Engineering, Siemens AG, ANSYS Inc., Dassault Systèmes, Autodesk Inc., PTC Inc., MSC Software Corporation, COMSOL Inc., MathWorks, Oracle Corporation others in the final report.
Recent development
In October 2024, Autodesk, a leader in computer-aided design software, received an overweight rating and a $340 price target from Wells Fargo analyst Michael Turrin. This rating was attributed to Autodesk's potential for reaccelerating revenue growth and achieving a 30%+ free cash flow margin, following successful business model transitions.
|
Report Attributes |
Details |
|
Market Size in 2023 |
USD 9.4 Billion |
|
Market Size by 2032 |
USD 23.6 Billion |
|
CAGR |
CAGR of 10.80 % From 2024 to 2032 |
|
Base Year |
2023 |
|
Forecast Period |
2024-2032 |
|
Historical Data |
2020-2022 |
|
Report Scope & Coverage |
Market Size, Segments Analysis, Competitive Landscape, Regional Analysis, DROC & SWOT Analysis, Forecast Outlook |
|
Key Segments |
• By Component (Software, Services) |
|
Regional Analysis/Coverage |
North America (USA, Canada, Mexico), Europe |
|
Company Profiles |
ANSYS Inc., Siemens PLM Software, Dassault Systèmes, Autodesk Inc., PTC Inc., Altair Engineering, MSC Software Corporation, COMSOL Inc., MathWorks, Oracle Corporation |
|
Key Drivers |
• Increased adoption of cloud platforms for scalability, cost-effectiveness, and enhanced collaboration. |
|
Restraints |
• The substantial investment required for software licenses, hardware, and training limits adoption, especially for SMEs. |
Frequently Asked Questions
The Computer-Aided Engineering Market was valued at USD 9.4 Billion in 2023 and is expected to reach USD 23.6 Billion by 2032, growing at a CAGR of 10.80% from 2024-2032.
The CAGR of the Computer Aided Engineering Market during the forecast period is 10.80% from 2024-2032.
The Asia-Pacific is expected to register the fastest CAGR during the forecast period.
Rising need to reduce costs and time associated with physical prototyping through virtual simulations
Cloud-based CAE solutions raise issues about data privacy and intellectual property protection.
Get in Touch
