Get More Information on Enterprise Governance, Risk, and Compliance Market - Request Sample Report
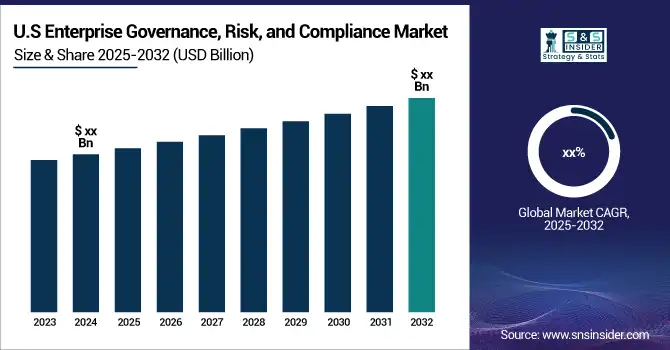
The Enterprise Governance, Risk, and Compliance Market Size was valued at USD 18.1 Billion in 2023 and is expected to reach USD 55.4 Billion by 2032 and grow at a CAGR of 13.22% from 2024-2032.
The Enterprise Governance, Risk, and Compliance (eGRC) market is experiencing significant growth, fueled by organizations' rising need to navigate regulatory requirements, mitigate risks, and maintain corporate governance. eGRC solutions integrate various components of risk management, compliance processes, and governance frameworks into a cohesive system, offering organizations a thorough view of their risk landscape. A major driver of the eGRC market is the increasing number of regulatory mandates across diverse industries. For example, the European Union's Digital Operational Resilience Act (DORA), which took effect in 2023, requires financial firms to enhance their cybersecurity resilience and manage operational risks. This regulation has motivated organizations to adopt eGRC solutions to ensure compliance and avoid substantial penalties.
Furthermore, the heightened emphasis on data privacy and security-especially following several high-profile data breaches-has escalated the demand for eGRC tools. According to a 2023 report, 60% of organizations are prioritizing investments in data governance and compliance solutions to protect sensitive information. Companies like Zoom have implemented eGRC platforms to bolster their data protection efforts and adhere to global privacy regulations, including the GDPR. In addition, the COVID-19 pandemic has accelerated the trend toward digital transformation, encouraging businesses to invest in eGRC solutions to optimize their operations and improve adaptability. As organizations face a rapidly changing risk environment, the need for real-time risk assessments and compliance monitoring has become increasingly critical. A survey conducted in 2024 found that 70% of enterprises are actively seeking integrated eGRC solutions to enhance their risk management capabilities and operational efficiency.
In conclusion, the eGRC market is well-positioned for substantial growth, driven by regulatory pressures, the demand for improved data security, and ongoing digital transformation initiatives. Organizations are increasingly adopting eGRC solutions to ensure compliance, mitigate risks, and foster a culture of accountability within their operations.
Drivers
The rise in cyberattacks and data breaches drives the need for robust risk management and compliance frameworks.
Stricter data protection regulations, such as GDPR, push organizations to invest in data governance and compliance tools.
Organizations seek to improve transparency and accountability in their operations, necessitating effective governance frameworks.
Organizations are increasingly prioritizing transparency and accountability in their operations, which is crucial within the Enterprise Governance, Risk, and Compliance (eGRC) market. Strong governance frameworks not only ensure compliance with regulations but also build trust among stakeholders, including customers, employees, and investors.
The emergence of global regulatory standards, such as the Sarbanes-Oxley Act in the U.S. and the General Data Protection Regulation (GDPR) in Europe, has prompted companies to adopt eGRC solutions that offer a comprehensive approach to governance, risk management, and compliance. These frameworks facilitate the standardization of processes, simplifying the tracking and reporting of compliance activities and thereby enhancing transparency. For instance, a multinational corporation like Unilever, which operates across various global markets, has implemented a comprehensive eGRC system to enhance transparency and accountability. This system integrates its risk management and compliance processes, enabling the company to effectively monitor compliance across different regulatory environments and ensure adherence to both local laws and international standards. By utilizing eGRC tools, Unilever can provide real-time insights into its governance practices, thus boosting stakeholder confidence.
Furthermore, fostering accountability involves ensuring that employees at all levels understand their responsibilities regarding compliance and governance. Companies are increasingly leveraging eGRC solutions to educate staff on compliance protocols and ethical standards. For instance, a financial services firm may deploy an eGRC platform that includes automated training modules on anti-money laundering (AML) practices. This approach ensures that employees are well-informed and accountable for complying with regulatory requirements, significantly reducing the risk of non-compliance.
In conclusion, as organizations aim to enhance transparency and accountability, effective governance frameworks enabled by eGRC solutions are essential. These frameworks help businesses navigate complex regulatory environments, cultivate trust with stakeholders, and promote sustainable business practices.
Restraints
Organizational culture and resistance from employees to adopt new technologies and processes can hinder the successful implementation of eGRC solutions.
A shortage of professionals with expertise in eGRC frameworks and technologies can restrict organizations from effectively utilizing these solutions.
Over-reliance on automated systems may lead to complacency in manual oversight, increasing the risk of overlooking potential compliance issues.
Excessive reliance on automated systems within the Enterprise Governance, Risk, and Compliance (eGRC) market can lead to complacency in manual oversight, heightening the risk of overlooking compliance issues. While eGRC solutions are designed to enhance process efficiency, organizations must remain vigilant to ensure that these automated tools do not replace critical human judgment and oversight.
For instance, take a financial institution that implements an advanced eGRC platform to automate its compliance reporting and risk assessment functions. Although the system is capable of generating reports and flagging potential issues, the absence of human oversight can result in overlooked nuances in the data. If compliance officers depend entirely on automated alerts without conducting thorough reviews, they may miss emerging risks or misinterpret findings, potentially leading to non-compliance with regulatory requirements.
A notable example involves a large multinational bank that faced hefty penalties due to compliance failures linked to its automated monitoring systems. Despite investing heavily in eGRC technology to manage its anti-money laundering (AML) processes, the automated system generated alerts based on predetermined thresholds, causing compliance staff to become desensitized over time. As a result, genuine alerts were ignored or dismissed, ultimately leading to significant fines from regulators for failing to report suspicious activities. To mitigate these risks, organizations should pursue a balanced approach that integrates automated systems with robust human oversight. This might include ongoing training for compliance teams to foster a culture of diligence and critical thinking. Additionally, creating a feedback loop that reintegrates human insights into the automated systems can enhance their effectiveness over time.
In conclusion, while eGRC solutions play a vital role in managing governance, risk, and compliance, organizations must recognize the crucial importance of human oversight. Finding the right balance between automation and manual intervention is essential for effectively identifying and addressing compliance challenges in a complex regulatory landscape.
By Component
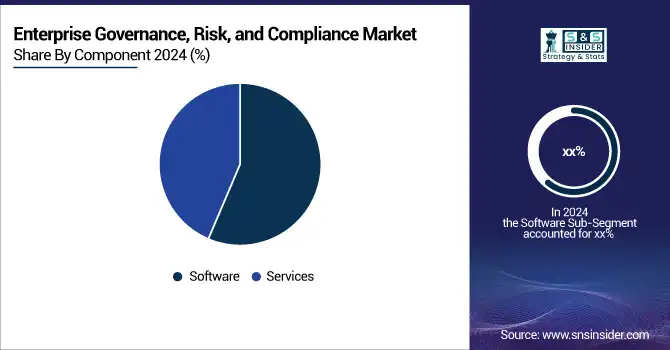
The software segment dominated the market and represented a significant revenue share in 2023, fueled by the many players in the eGRC market offering software solutions. Moreover, the global footprint of several of these companies has enabled wider software adoption during the forecast period. For instance, as of 2023, SAP reported having over 400,000 customers in more than 180 countries, which includes 25 million users in its business software communities. This widespread adoption of SAP's solutions is expected to play a significant role in driving market growth in the eGRC sector.
The services segment is projected to see substantial growth during the forecast period. This expansion is mainly due to the benefits provided by services, such as accessibility, cost-effectiveness, scalability, analytics, data storage, enhanced security, and operational management. The rising popularity of Software as a Service (SaaS) GRC solutions from eGRC providers has also propelled the growth of this segment. For example, Archer Technologies LLC, a GRC solution provider based in the U.S., offers SaaS GRC solutions. The ongoing presence of such companies meeting market demand is likely to drive further growth throughout the forecast period.
By Organization Size
The largest enterprise segment dominated the market and represented a significant revenue share in 2023. This segment is witnessing growth during the forecast period due to the benefits offered by eGRC solutions. They offer customization, 24/7 automation, frictionless onboarding and integration, complete visibility and management, greater data security as well as real-time reporting and monitoring. As large enterprises usually have massive customer bases, complex operating mechanisms, big workforces, and larger organizational networks this segment became an area of necessity for implementing GRC which considerably grow the enterprise size subsector from 2024 to 2032
The small and medium-sized enterprises (SMEs) segment is expected to grow at a faster rate during this period. The growth is due to focus of SMEs on cloud-based advanced risk compliance solutions and affordable services. In the current competitive scenario, SMEs primarily rely on quick turnaround time and cost efficiency to strengthen their position in the market.
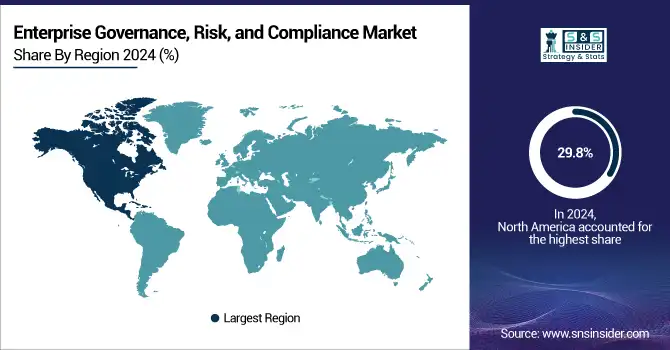
North America dominated the market and represented over 29.8% of revenue share. This region is home to prominent eGRC market players, including Dell Inc., IBM, Microsoft, and Oracle, whose presence has significantly bolstered regional growth. Furthermore, businesses in North America typically demonstrate more favorable attitudes toward digitalization, cybersecurity, and data protection.
The Asia Pacific region is expected to experience the highest growth rate from 2024 to 2032, driven largely by technological advancements in countries like China and Japan, which are leaders in innovations such as 5G and automation. The continued embrace of cutting-edge technologies is anticipated to further enhance the adoption of GRC solutions in the Asia Pacific region in the coming years. Additionally, fast-growing economies like India are witnessing increased eGRC digitalization and more stringent data protection regulations, requiring compliance from businesses. These elements combined are driving the growth of GRC adoption in India and promoting overall development in the Asia Pacific region.
Need Any Customization Research On Enterprise Governance, Risk, and Compliance Market - Inquiry Now
The major key Players are with their services
IBM - IBM OpenPages
Microsoft - Microsoft Compliance Manager
Oracle - Oracle Governance Risk and Compliance
SAP - SAP GRC Solutions
Dell Inc. - Dell EMC Governance and Compliance Solutions
Wolters Kluwer - OneSumX Regulatory Reporting
RSA Security - RSA Archer Suite
MetricStream - MetricStream GRC Platform
ServiceNow - ServiceNow Governance, Risk, and Compliance
SAS Institute - SAS Risk Management
LogicManager - LogicManager GRC Software
SailPoint Technologies - SailPoint Identity Governance
CyberSaint - CyberStrong Platform
NAVEX Global - NAVEX Risk Management Software
Bwise (a Nasdaq Company) - BWise GRC Software
RiskWatch - RiskWatch Compliance Solutions
Galvanize (now Diligent) - HighBond Platform
Trustwave - Trustwave Compliance Solutions
Apex Analytix - Apex Analytix Compliance Solutions
Cura Software Solutions - Cura GRC Software
March 2024: Credo AI launched governance, risk, and compliance solutions for AI, promoting safe technology adoption. This updated platform includes a user-friendly redesign and various new features that simplify the responsibilities of AI Governance Custodians, ensuring ethical AI usage.
February 2024: Swiss GRC, a European software company specializing in governance, risk, and compliance, announced its expansion into the Indian market. The company will offer on-premise and private cloud deployment options tailored to the Indian sector, with a focus on BFSI players and government entities.
February 2024: iOPEX introduced a compliance and governance add-on for ServiceNow's creator workflows. This innovative add-on enhances ServiceNow's functionality by seamlessly integrating comprehensive governance and compliance features, including advanced integrated risk management strategies.
January 2024: Anecdotes, a California-based company specializing in AI technology, secured USD 25 million in funding to expand its governance, risk management, and compliance operations. The investment will support the enhancement of GRC functions through automated workflows, plugins, and application integrations for more efficient processes.
Report Attributes | Details |
---|---|
Market Size in 2023 | USD 18.1 billion |
Market Size by 2032 | USD 55.4 billion |
CAGR | CAGR of 13.22% From 2024 to 2032 |
Base Year | 2023 |
Forecast Period | 2024-2032 |
Historical Data | 2020-2022 |
Report Scope & Coverage | Market Size, Segments Analysis, Competitive Landscape, Regional Analysis, DROC & SWOT Analysis, Forecast Outlook |
Key Segments | • By Component (Software, Services) • By Deployment (Cloud, On-premises) • By Organization size (Large Enterprise, Small & Medium Enterprise) • By Vertical (BFSI, Healthcare, Government, Energy & Utilities, Manufacturing, Retail & Consumer Goods, Telecom & IT, Others) |
Regional Analysis/Coverage | North America (US, Canada, Mexico), Europe (Eastern Europe [Poland, Romania, Hungary, Turkey, Rest of Eastern Europe] Western Europe [Germany, France, UK, Italy, Spain, Netherlands, Switzerland, Austria, Rest of Western Europe]), Asia Pacific (China, India, Japan, South Korea, Vietnam, Singapore, Australia, Rest of Asia Pacific), Middle East & Africa (Middle East [UAE, Egypt, Saudi Arabia, Qatar, Rest of Middle East], Africa [Nigeria, South Africa, Rest of Africa], Latin America (Brazil, Argentina, Colombia, Rest of Latin America) |
Company Profiles | IBM, Microsoft, Oracle, SAP, Dell Inc., Wolters Kluwer, RSA Security, MetricStream, ServiceNow, SAS Institute |
Key Drivers | • The rise in cyberattacks and data breaches drives the need for robust risk management and compliance frameworks. •Stricter data protection regulations, such as GDPR, push organizations to invest in data governance and compliance tools. |
RESTRAINTS | • Organizational culture and resistance from employees to adopt new technologies and processes can hinder the successful implementation of eGRC solutions. •A shortage of professionals with expertise in eGRC frameworks and technologies can restrict organizations from effectively utilizing these solutions. |
Ans- Enterprise Governance, Risk, and Compliance (eGRC) Market was valued at USD 18.1 Billion in 2023 and is expected to reach USD 55.4 Billion by 2032 and grow at a CAGR of 13.22% from 2024-2032.
Ans- the CAGR of the Enterprise Governance, Risk, and Compliance (eGRC) market during the forecast period is of 13.22% from 2024-2032.
Ans- In 2023, North America dominated the market and held a significant revenue share.
Ans- one main growth factor for the Enterprise Governance, Risk, and Compliance (eGRC) market is
Ans- Challenges in the Enterprise Governance, Risk, and Compliance (eGRC) market are
1. Introduction
1.1 Market Definition
1.2 Scope (Inclusion and Exclusions)
1.3 Research Assumptions
2. Executive Summary
2.1 Market Overview
2.2 Regional Synopsis
2.3 Competitive Summary
3. Research Methodology
3.1 Top-Down Approach
3.2 Bottom-up Approach
3.3. Data Validation
3.4 Primary Interviews
4. Market Dynamics Impact Analysis
4.1 Market Driving Factors Analysis
4.1.1 Drivers
4.1.2 Restraints
4.1.3 Opportunities
4.1.4 Challenges
4.2 PESTLE Analysis
4.3 Porter’s Five Forces Model
5. Statistical Insights and Trends Reporting
5.1 Adoption Rates of Emerging Technologies
5.2 Network Infrastructure Expansion, by Region
5.3 Cybersecurity Incidents, by Region (2020-2023)
5.4 Cloud Services Usage, by Region
6. Competitive Landscape
6.1 List of Major Companies, By Region
6.2 Market Share Analysis, By Region
6.3 Product Benchmarking
6.3.1 Product specifications and features
6.3.2 Pricing
6.4 Strategic Initiatives
6.4.1 Marketing and promotional activities
6.4.2 Distribution and supply chain strategies
6.4.3 Expansion plans and new product launches
6.4.4 Strategic partnerships and collaborations
6.5 Technological Advancements
6.6 Market Positioning and Branding
7. Enterprise Governance, Risk, and Compliance Market Segmentation, by Component
7.1 Chapter Overview
7.2 Services
7.2.1 Services Market Trends Analysis (2020-2032)
7.2.2 Services Market Size Estimates and Forecasts to 2032 (USD Billion)
7.3 Software
7.3.1 Software Market Trends Analysis (2020-2032)
7.3.2 Software Market Size Estimates and Forecasts to 2032 (USD Billion)
8. Enterprise Governance, Risk, and Compliance Market Segmentation, by Application
8.1 Chapter Overview
8.2 BFSI
8.2.1 BFSI Market Trends Analysis (2020-2032)
8.2.2 BFSI Market Size Estimates and Forecasts to 2032 (USD Billion)
8.3Retail & Consumer Goods
8.3.1 Retail & Consumer Goods Market Trends Analysis (2020-2032)
8.3.2 Retail & Consumer Goods Market Size Estimates and Forecasts to 2032 (USD Billion)
8.4 Healthcare
8.4.1 Healthcare Market Trends Analysis (2020-2032)
8.4.2 Healthcare Market Size Estimates and Forecasts to 2032 (USD Billion)
8.5 Telecom & IT
8.5.1 Telecom & IT Market Trends Analysis (2020-2032)
8.5.2 Telecom & IT Market Size Estimates and Forecasts to 2032 (USD Billion)
8.6 Government
8.6.1 Government Market Trends Analysis (2020-2032)
8.6.2 Government Market Size Estimates and Forecasts to 2032 (USD Billion)
8.7 Manufacturing
8.7.1 Manufacturing Market Trends Analysis (2020-2032)
8.7.2 Manufacturing Market Size Estimates and Forecasts to 2032 (USD Billion)
8.8 Energy & Utilities
8.8.1 Energy & Utilities Market Trends Analysis (2020-2032)
8.8.2 Energy & Utilities Market Size Estimates and Forecasts to 2032 (USD Billion)
8.9 Others
8.9.1 Others Market Trends Analysis (2020-2032)
8.9.2 Others Market Size Estimates and Forecasts to 2032 (USD Billion)
9. Enterprise Governance, Risk, and Compliance Market Segmentation, by Deployment
9.1 Chapter Overview
9.2 Cloud-based
9.2.1 Cloud-based Market Trends Analysis (2020-2032)
9.2.2 Cloud-based Market Size Estimates and Forecasts to 2032 (USD Billion)
9.3 On-premise
9.3.1 On-premise Market Trends Analysis (2020-2032)
9.3.2 On-premise Market Size Estimates and Forecasts to 2032 (USD Billion)
10. Enterprise Governance, Risk, and Compliance Market Segmentation, by Organization Size
10.1 Chapter Overview
10.2 Large Enterprise
10.2.1 Large Enterprise Market Trends Analysis (2020-2032)
10.2.2 Large Enterprise Market Size Estimates and Forecasts to 2032 (USD Billion)
10.3Small & Medium Enterprise
10.3.1 Small & Medium Enterprise Market Trends Analysis (2020-2032)
10.3.2 Small & Medium Enterprise Market Size Estimates and Forecasts to 2032 (USD Billion)
11. Regional Analysis
11.1 Chapter Overview
11.2 North America
11.2.1 Trends Analysis
11.2.2 North America Enterprise Governance, Risk, and Compliance Market Estimates and Forecasts, by Country (2020-2032) (USD Billion)
11.2.3 North America Enterprise Governance, Risk, and Compliance Market Estimates and Forecasts, by Component (2020-2032) (USD Billion)
11.2.4 North America Enterprise Governance, Risk, and Compliance Market Estimates and Forecasts, by Application (2020-2032) (USD Billion)
11.2.5 North America Enterprise Governance, Risk, and Compliance Market Estimates and Forecasts, by Deployment (2020-2032) (USD Billion)
11.2.6 North America Enterprise Governance, Risk, and Compliance Market Estimates and Forecasts, by Organization Size (2020-2032) (USD Billion)
11.2.7 USA
11.2.7.1 USA Enterprise Governance, Risk, and Compliance Market Estimates and Forecasts, by Component (2020-2032) (USD Billion)
11.2.7.2 USA Enterprise Governance, Risk, and Compliance Market Estimates and Forecasts, by Application (2020-2032) (USD Billion)
11.2.7.3 USA Enterprise Governance, Risk, and Compliance Market Estimates and Forecasts, by Deployment (2020-2032) (USD Billion)
11.2.7.4 USA Enterprise Governance, Risk, and Compliance Market Estimates and Forecasts, by Organization Size (2020-2032) (USD Billion)
11.2.8 Canada
11.2.8.1 Canada Enterprise Governance, Risk, and Compliance Market Estimates and Forecasts, by Component (2020-2032) (USD Billion)
11.2.8.2 Canada Enterprise Governance, Risk, and Compliance Market Estimates and Forecasts, by Application (2020-2032) (USD Billion)
11.2.8.3 Canada Enterprise Governance, Risk, and Compliance Market Estimates and Forecasts, by Deployment (2020-2032) (USD Billion)
11.2.8.4 Canada Enterprise Governance, Risk, and Compliance Market Estimates and Forecasts, by Organization Size (2020-2032) (USD Billion)
11.2.9 Mexico
11.2.9.1 Mexico Enterprise Governance, Risk, and Compliance Market Estimates and Forecasts, by Component (2020-2032) (USD Billion)
11.2.9.2 Mexico Enterprise Governance, Risk, and Compliance Market Estimates and Forecasts, by Application (2020-2032) (USD Billion)
11.2.9.3 Mexico Enterprise Governance, Risk, and Compliance Market Estimates and Forecasts, by Deployment (2020-2032) (USD Billion)
11.2.9.4 Mexico Enterprise Governance, Risk, and Compliance Market Estimates and Forecasts, by Organization Size (2020-2032) (USD Billion)
11.3 Europe
11.3.1 Eastern Europe
11.3.1.1 Trends Analysis
11.3.1.2 Eastern Europe Enterprise Governance, Risk, and Compliance Market Estimates and Forecasts, by Country (2020-2032) (USD Billion)
11.3.1.3 Eastern Europe Enterprise Governance, Risk, and Compliance Market Estimates and Forecasts, by Component (2020-2032) (USD Billion)
11.3.1.4 Eastern Europe Enterprise Governance, Risk, and Compliance Market Estimates and Forecasts, by Application (2020-2032) (USD Billion)
11.3.1.5 Eastern Europe Enterprise Governance, Risk, and Compliance Market Estimates and Forecasts, by Deployment (2020-2032) (USD Billion)
11.3.1.6 Eastern Europe Enterprise Governance, Risk, and Compliance Market Estimates and Forecasts, by Organization Size (2020-2032) (USD Billion)
11.3.1.7 Poland
11.3.1.7.1 Poland Enterprise Governance, Risk, and Compliance Market Estimates and Forecasts, by Component (2020-2032) (USD Billion)
11.3.1.7.2 Poland Enterprise Governance, Risk, and Compliance Market Estimates and Forecasts, by Application (2020-2032) (USD Billion)
11.3.1.7.3 Poland Enterprise Governance, Risk, and Compliance Market Estimates and Forecasts, by Deployment (2020-2032) (USD Billion)
11.3.1.7.4 Poland Enterprise Governance, Risk, and Compliance Market Estimates and Forecasts, by Organization Size (2020-2032) (USD Billion)
11.3.1.8 Romania
11.3.1.8.1 Romania Enterprise Governance, Risk, and Compliance Market Estimates and Forecasts, by Component (2020-2032) (USD Billion)
11.3.1.8.2 Romania Enterprise Governance, Risk, and Compliance Market Estimates and Forecasts, by Application (2020-2032) (USD Billion)
11.3.1.8.3 Romania Enterprise Governance, Risk, and Compliance Market Estimates and Forecasts, by Deployment (2020-2032) (USD Billion)
11.3.1.8.4 Romania Enterprise Governance, Risk, and Compliance Market Estimates and Forecasts, by Organization Size (2020-2032) (USD Billion)
11.3.1.9 Hungary
11.3.1.9.1 Hungary Enterprise Governance, Risk, and Compliance Market Estimates and Forecasts, by Component (2020-2032) (USD Billion)
11.3.1.9.2 Hungary Enterprise Governance, Risk, and Compliance Market Estimates and Forecasts, by Application (2020-2032) (USD Billion)
11.3.1.9.3 Hungary Enterprise Governance, Risk, and Compliance Market Estimates and Forecasts, by Deployment (2020-2032) (USD Billion)
11.3.1.9.4 Hungary Enterprise Governance, Risk, and Compliance Market Estimates and Forecasts, by Organization Size (2020-2032) (USD Billion)
11.3.1.10 Turkey
11.3.1.10.1 Turkey Enterprise Governance, Risk, and Compliance Market Estimates and Forecasts, by Component (2020-2032) (USD Billion)
11.3.1.10.2 Turkey Enterprise Governance, Risk, and Compliance Market Estimates and Forecasts, by Application (2020-2032) (USD Billion)
11.3.1.10.3 Turkey Enterprise Governance, Risk, and Compliance Market Estimates and Forecasts, by Deployment (2020-2032) (USD Billion)
11.3.1.10.4 Turkey Enterprise Governance, Risk, and Compliance Market Estimates and Forecasts, by Organization Size (2020-2032) (USD Billion)
11.3.1.11 Rest of Eastern Europe
11.3.1.11.1 Rest of Eastern Europe Enterprise Governance, Risk, and Compliance Market Estimates and Forecasts, by Component (2020-2032) (USD Billion)
11.3.1.11.2 Rest of Eastern Europe Enterprise Governance, Risk, and Compliance Market Estimates and Forecasts, by Application (2020-2032) (USD Billion)
11.3.1.11.3 Rest of Eastern Europe Enterprise Governance, Risk, and Compliance Market Estimates and Forecasts, by Deployment (2020-2032) (USD Billion)
11.3.1.11.4 Rest of Eastern Europe Enterprise Governance, Risk, and Compliance Market Estimates and Forecasts, by Organization Size (2020-2032) (USD Billion)
11.3.2 Western Europe
11.3.2.1 Trends Analysis
11.3.2.2 Western Europe Enterprise Governance, Risk, and Compliance Market Estimates and Forecasts, by Country (2020-2032) (USD Billion)
11.3.2.3 Western Europe Enterprise Governance, Risk, and Compliance Market Estimates and Forecasts, by Component (2020-2032) (USD Billion)
11.3.2.4 Western Europe Enterprise Governance, Risk, and Compliance Market Estimates and Forecasts, by Application (2020-2032) (USD Billion)
11.3.2.5 Western Europe Enterprise Governance, Risk, and Compliance Market Estimates and Forecasts, by Deployment (2020-2032) (USD Billion)
11.3.2.6 Western Europe Enterprise Governance, Risk, and Compliance Market Estimates and Forecasts, by Organization Size (2020-2032) (USD Billion)
11.3.2.7 Germany
11.3.2.7.1 Germany Enterprise Governance, Risk, and Compliance Market Estimates and Forecasts, by Component (2020-2032) (USD Billion)
11.3.2.7.2 Germany Enterprise Governance, Risk, and Compliance Market Estimates and Forecasts, by Application (2020-2032) (USD Billion)
11.3.2.7.3 Germany Enterprise Governance, Risk, and Compliance Market Estimates and Forecasts, by Deployment (2020-2032) (USD Billion)
11.3.2.7.4 Germany Enterprise Governance, Risk, and Compliance Market Estimates and Forecasts, by Organization Size (2020-2032) (USD Billion)
11.3.2.8 France
11.3.2.8.1 France Enterprise Governance, Risk, and Compliance Market Estimates and Forecasts, by Component (2020-2032) (USD Billion)
11.3.2.8.2 France Enterprise Governance, Risk, and Compliance Market Estimates and Forecasts, by Application (2020-2032) (USD Billion)
11.3.2.8.3 France Enterprise Governance, Risk, and Compliance Market Estimates and Forecasts, by Deployment (2020-2032) (USD Billion)
11.3.2.8.4 France Enterprise Governance, Risk, and Compliance Market Estimates and Forecasts, by Organization Size (2020-2032) (USD Billion)
11.3.2.9 UK
11.3.2.9.1 UK Enterprise Governance, Risk, and Compliance Market Estimates and Forecasts, by Component (2020-2032) (USD Billion)
11.3.2.9.2 UK Enterprise Governance, Risk, and Compliance Market Estimates and Forecasts, by Application (2020-2032) (USD Billion)
11.3.2.9.3 UK Enterprise Governance, Risk, and Compliance Market Estimates and Forecasts, by Deployment (2020-2032) (USD Billion)
11.3.2.9.4 UK Enterprise Governance, Risk, and Compliance Market Estimates and Forecasts, by Organization Size (2020-2032) (USD Billion)
11.3.2.10 Italy
11.3.2.10.1 Italy Enterprise Governance, Risk, and Compliance Market Estimates and Forecasts, by Component (2020-2032) (USD Billion)
11.3.2.10.2 Italy Enterprise Governance, Risk, and Compliance Market Estimates and Forecasts, by Application (2020-2032) (USD Billion)
11.3.2.10.3 Italy Enterprise Governance, Risk, and Compliance Market Estimates and Forecasts, by Deployment (2020-2032) (USD Billion)
11.3.2.10.4 Italy Enterprise Governance, Risk, and Compliance Market Estimates and Forecasts, by Organization Size (2020-2032) (USD Billion)
11.3.2.11 Spain
11.3.2.11.1 Spain Enterprise Governance, Risk, and Compliance Market Estimates and Forecasts, by Component (2020-2032) (USD Billion)
11.3.2.11.2 Spain Enterprise Governance, Risk, and Compliance Market Estimates and Forecasts, by Application (2020-2032) (USD Billion)
11.3.2.11.3 Spain Enterprise Governance, Risk, and Compliance Market Estimates and Forecasts, by Deployment (2020-2032) (USD Billion)
11.3.2.11.4 Spain Enterprise Governance, Risk, and Compliance Market Estimates and Forecasts, by Organization Size (2020-2032) (USD Billion)
11.3.2.12 Netherlands
11.3.2.12.1 Netherlands Enterprise Governance, Risk, and Compliance Market Estimates and Forecasts, by Component (2020-2032) (USD Billion)
11.3.2.12.2 Netherlands Enterprise Governance, Risk, and Compliance Market Estimates and Forecasts, by Application (2020-2032) (USD Billion)
11.3.2.12.3 Netherlands Enterprise Governance, Risk, and Compliance Market Estimates and Forecasts, by Deployment (2020-2032) (USD Billion)
11.3.2.12.4 Netherlands Enterprise Governance, Risk, and Compliance Market Estimates and Forecasts, by Organization Size (2020-2032) (USD Billion)
11.3.2.13 Switzerland
11.3.2.13.1 Switzerland Enterprise Governance, Risk, and Compliance Market Estimates and Forecasts, by Component (2020-2032) (USD Billion)
11.3.2.13.2 Switzerland Enterprise Governance, Risk, and Compliance Market Estimates and Forecasts, by Application (2020-2032) (USD Billion)
11.3.2.13.3 Switzerland Enterprise Governance, Risk, and Compliance Market Estimates and Forecasts, by Deployment (2020-2032) (USD Billion)
11.3.2.13.4 Switzerland Enterprise Governance, Risk, and Compliance Market Estimates and Forecasts, by Organization Size (2020-2032) (USD Billion)
11.3.2.14 Austria
11.3.2.14.1 Austria Enterprise Governance, Risk, and Compliance Market Estimates and Forecasts, by Component (2020-2032) (USD Billion)
11.3.2.14.2 Austria Enterprise Governance, Risk, and Compliance Market Estimates and Forecasts, by Application (2020-2032) (USD Billion)
11.3.2.14.3 Austria Enterprise Governance, Risk, and Compliance Market Estimates and Forecasts, by Deployment (2020-2032) (USD Billion)
11.3.2.14.4 Austria Enterprise Governance, Risk, and Compliance Market Estimates and Forecasts, by Organization Size (2020-2032) (USD Billion)
11.3.2.15 Rest of Western Europe
11.3.2.15.1 Rest of Western Europe Enterprise Governance, Risk, and Compliance Market Estimates and Forecasts, by Component (2020-2032) (USD Billion)
11.3.2.15.2 Rest of Western Europe Enterprise Governance, Risk, and Compliance Market Estimates and Forecasts, by Application (2020-2032) (USD Billion)
11.3.2.15.3 Rest of Western Europe Enterprise Governance, Risk, and Compliance Market Estimates and Forecasts, by Deployment (2020-2032) (USD Billion)
11.3.2.15.4 Rest of Western Europe Enterprise Governance, Risk, and Compliance Market Estimates and Forecasts, by Organization Size (2020-2032) (USD Billion)
11.4 Asia Pacific
11.4.1 Trends Analysis
11.4.2 Asia Pacific Enterprise Governance, Risk, and Compliance Market Estimates and Forecasts, by Country (2020-2032) (USD Billion)
11.4.3 Asia Pacific Enterprise Governance, Risk, and Compliance Market Estimates and Forecasts, by Component (2020-2032) (USD Billion)
11.4.4 Asia Pacific Enterprise Governance, Risk, and Compliance Market Estimates and Forecasts, by Application (2020-2032) (USD Billion)
11.4.5 Asia Pacific Enterprise Governance, Risk, and Compliance Market Estimates and Forecasts, by Deployment (2020-2032) (USD Billion)
11.4.6 Asia Pacific Enterprise Governance, Risk, and Compliance Market Estimates and Forecasts, by Organization Size (2020-2032) (USD Billion)
11.4.7 China
11.4.7.1 China Enterprise Governance, Risk, and Compliance Market Estimates and Forecasts, by Component (2020-2032) (USD Billion)
11.4.7.2 China Enterprise Governance, Risk, and Compliance Market Estimates and Forecasts, by Application (2020-2032) (USD Billion)
11.4.7.3 China Enterprise Governance, Risk, and Compliance Market Estimates and Forecasts, by Deployment (2020-2032) (USD Billion)
11.4.7.4 China Enterprise Governance, Risk, and Compliance Market Estimates and Forecasts, by Organization Size (2020-2032) (USD Billion)
11.4.8 India
11.4.8.1 India Enterprise Governance, Risk, and Compliance Market Estimates and Forecasts, by Component (2020-2032) (USD Billion)
11.4.8.2 India Enterprise Governance, Risk, and Compliance Market Estimates and Forecasts, by Application (2020-2032) (USD Billion)
11.4.8.3 India Enterprise Governance, Risk, and Compliance Market Estimates and Forecasts, by Deployment (2020-2032) (USD Billion)
11.4.8.4 India Enterprise Governance, Risk, and Compliance Market Estimates and Forecasts, by Organization Size (2020-2032) (USD Billion)
11.4.9 Japan
11.4.9.1 Japan Enterprise Governance, Risk, and Compliance Market Estimates and Forecasts, by Component (2020-2032) (USD Billion)
11.4.9.2 Japan Enterprise Governance, Risk, and Compliance Market Estimates and Forecasts, by Application (2020-2032) (USD Billion)
11.4.9.3 Japan Enterprise Governance, Risk, and Compliance Market Estimates and Forecasts, by Deployment (2020-2032) (USD Billion)
11.4.9.4 Japan Enterprise Governance, Risk, and Compliance Market Estimates and Forecasts, by Organization Size (2020-2032) (USD Billion)
11.4.10 South Korea
11.4.10.1 South Korea Enterprise Governance, Risk, and Compliance Market Estimates and Forecasts, by Component (2020-2032) (USD Billion)
11.4.10.2 South Korea Enterprise Governance, Risk, and Compliance Market Estimates and Forecasts, by Application (2020-2032) (USD Billion)
11.4.10.3 South Korea Enterprise Governance, Risk, and Compliance Market Estimates and Forecasts, by Deployment (2020-2032) (USD Billion)
11.4.10.4 South Korea Enterprise Governance, Risk, and Compliance Market Estimates and Forecasts, by Organization Size (2020-2032) (USD Billion)
11.4.11 Vietnam
11.4.11.1 Vietnam Enterprise Governance, Risk, and Compliance Market Estimates and Forecasts, by Component (2020-2032) (USD Billion)
11.4.11.2 Vietnam Enterprise Governance, Risk, and Compliance Market Estimates and Forecasts, by Application (2020-2032) (USD Billion)
11.4.11.3 Vietnam Enterprise Governance, Risk, and Compliance Market Estimates and Forecasts, by Deployment (2020-2032) (USD Billion)
11.4.11.4 Vietnam Enterprise Governance, Risk, and Compliance Market Estimates and Forecasts, by Organization Size (2020-2032) (USD Billion)
11.4.12 Singapore
11.4.12.1 Singapore Enterprise Governance, Risk, and Compliance Market Estimates and Forecasts, by Component (2020-2032) (USD Billion)
11.4.12.2 Singapore Enterprise Governance, Risk, and Compliance Market Estimates and Forecasts, by Application (2020-2032) (USD Billion)
11.4.12.3 Singapore Enterprise Governance, Risk, and Compliance Market Estimates and Forecasts, by Deployment (2020-2032) (USD Billion)
11.4.12.4 Singapore Enterprise Governance, Risk, and Compliance Market Estimates and Forecasts, by Organization Size (2020-2032) (USD Billion)
11.4.13 Australia
11.4.13.1 Australia Enterprise Governance, Risk, and Compliance Market Estimates and Forecasts, by Component (2020-2032) (USD Billion)
11.4.13.2 Australia Enterprise Governance, Risk, and Compliance Market Estimates and Forecasts, by Application (2020-2032) (USD Billion)
11.4.13.3 Australia Enterprise Governance, Risk, and Compliance Market Estimates and Forecasts, by Deployment (2020-2032) (USD Billion)
11.4.13.4 Australia Enterprise Governance, Risk, and Compliance Market Estimates and Forecasts, by Organization Size (2020-2032) (USD Billion)
11.4.14 Rest of Asia Pacific
11.4.14.1 Rest of Asia Pacific Enterprise Governance, Risk, and Compliance Market Estimates and Forecasts, by Component (2020-2032) (USD Billion)
11.4.14.2 Rest of Asia Pacific Enterprise Governance, Risk, and Compliance Market Estimates and Forecasts, by Application (2020-2032) (USD Billion)
11.4.14.3 Rest of Asia Pacific Enterprise Governance, Risk, and Compliance Market Estimates and Forecasts, by Deployment (2020-2032) (USD Billion)
11.4.14.4 Rest of Asia Pacific Enterprise Governance, Risk, and Compliance Market Estimates and Forecasts, by Organization Size (2020-2032) (USD Billion)
11.5 Middle East and Africa
11.5.1 Middle East
11.5.1.1 Trends Analysis
11.5.1.2 Middle East Enterprise Governance, Risk, and Compliance Market Estimates and Forecasts, by Country (2020-2032) (USD Billion)
11.5.1.3 Middle East Enterprise Governance, Risk, and Compliance Market Estimates and Forecasts, by Component (2020-2032) (USD Billion)
11.5.1.4 Middle East Enterprise Governance, Risk, and Compliance Market Estimates and Forecasts, by Application (2020-2032) (USD Billion)
11.5.1.5 Middle East Enterprise Governance, Risk, and Compliance Market Estimates and Forecasts, by Deployment (2020-2032) (USD Billion)
11.5.1.6 Middle East Enterprise Governance, Risk, and Compliance Market Estimates and Forecasts, by Organization Size (2020-2032) (USD Billion)
11.5.1.7 UAE
11.5.1.7.1 UAE Enterprise Governance, Risk, and Compliance Market Estimates and Forecasts, by Component (2020-2032) (USD Billion)
11.5.1.7.2 UAE Enterprise Governance, Risk, and Compliance Market Estimates and Forecasts, by Application (2020-2032) (USD Billion)
11.5.1.7.3 UAE Enterprise Governance, Risk, and Compliance Market Estimates and Forecasts, by Deployment (2020-2032) (USD Billion)
11.5.1.7.4 UAE Enterprise Governance, Risk, and Compliance Market Estimates and Forecasts, by Organization Size (2020-2032) (USD Billion)
11.5.1.8 Egypt
11.5.1.8.1 Egypt Enterprise Governance, Risk, and Compliance Market Estimates and Forecasts, by Component (2020-2032) (USD Billion)
11.5.1.8.2 Egypt Enterprise Governance, Risk, and Compliance Market Estimates and Forecasts, by Application (2020-2032) (USD Billion)
11.5.1.8.3 Egypt Enterprise Governance, Risk, and Compliance Market Estimates and Forecasts, by Deployment (2020-2032) (USD Billion)
11.5.1.8.4 Egypt Enterprise Governance, Risk, and Compliance Market Estimates and Forecasts, by Organization Size (2020-2032) (USD Billion)
11.5.1.9 Saudi Arabia
11.5.1.9.1 Saudi Arabia Enterprise Governance, Risk, and Compliance Market Estimates and Forecasts, by Component (2020-2032) (USD Billion)
11.5.1.9.2 Saudi Arabia Enterprise Governance, Risk, and Compliance Market Estimates and Forecasts, by Application (2020-2032) (USD Billion)
11.5.1.9.3 Saudi Arabia Enterprise Governance, Risk, and Compliance Market Estimates and Forecasts, by Deployment (2020-2032) (USD Billion)
11.5.1.9.4 Saudi Arabia Enterprise Governance, Risk, and Compliance Market Estimates and Forecasts, by Organization Size (2020-2032) (USD Billion)
11.5.1.10 Qatar
11.5.1.10.1 Qatar Enterprise Governance, Risk, and Compliance Market Estimates and Forecasts, by Component (2020-2032) (USD Billion)
11.5.1.10.2 Qatar Enterprise Governance, Risk, and Compliance Market Estimates and Forecasts, by Application (2020-2032) (USD Billion)
11.5.1.10.3 Qatar Enterprise Governance, Risk, and Compliance Market Estimates and Forecasts, by Deployment (2020-2032) (USD Billion)
11.5.1.10.4 Qatar Enterprise Governance, Risk, and Compliance Market Estimates and Forecasts, by Organization Size (2020-2032) (USD Billion)
11.5.1.11 Rest of Middle East
11.5.1.11.1 Rest of Middle East Enterprise Governance, Risk, and Compliance Market Estimates and Forecasts, by Component (2020-2032) (USD Billion)
11.5.1.11.2 Rest of Middle East Enterprise Governance, Risk, and Compliance Market Estimates and Forecasts, by Application (2020-2032) (USD Billion)
11.5.1.11.3 Rest of Middle East Enterprise Governance, Risk, and Compliance Market Estimates and Forecasts, by Deployment (2020-2032) (USD Billion)
11.5.1.11.4 Rest of Middle East Enterprise Governance, Risk, and Compliance Market Estimates and Forecasts, by Organization Size (2020-2032) (USD Billion)
11.5.2 Africa
11.5.2.1 Trends Analysis
11.5.2.2 Africa Enterprise Governance, Risk, and Compliance Market Estimates and Forecasts, by Country (2020-2032) (USD Billion)
11.5.2.3 Africa Enterprise Governance, Risk, and Compliance Market Estimates and Forecasts, by Component (2020-2032) (USD Billion)
11.5.2.4 Africa Enterprise Governance, Risk, and Compliance Market Estimates and Forecasts, by Application (2020-2032) (USD Billion)
11.5.2.5 Africa Enterprise Governance, Risk, and Compliance Market Estimates and Forecasts, by Deployment (2020-2032) (USD Billion)
11.5.2.6 Africa Enterprise Governance, Risk, and Compliance Market Estimates and Forecasts, by Organization Size (2020-2032) (USD Billion)
11.5.2.7 South Africa
11.5.2.7.1 South Africa Enterprise Governance, Risk, and Compliance Market Estimates and Forecasts, by Component (2020-2032) (USD Billion)
11.5.2.7.2 South Africa Enterprise Governance, Risk, and Compliance Market Estimates and Forecasts, by Application (2020-2032) (USD Billion)
11.5.2.7.3 South Africa Enterprise Governance, Risk, and Compliance Market Estimates and Forecasts, by Deployment (2020-2032) (USD Billion)
11.5.2.7.4 South Africa Enterprise Governance, Risk, and Compliance Market Estimates and Forecasts, by Organization Size (2020-2032) (USD Billion)
11.5.2.8 Nigeria
11.5.2.8.1 Nigeria Enterprise Governance, Risk, and Compliance Market Estimates and Forecasts, by Component (2020-2032) (USD Billion)
11.5.2.8.2 Nigeria Enterprise Governance, Risk, and Compliance Market Estimates and Forecasts, by Application (2020-2032) (USD Billion)
11.5.2.8.3 Nigeria Enterprise Governance, Risk, and Compliance Market Estimates and Forecasts, by Deployment (2020-2032) (USD Billion)
11.5.2.8.4 Nigeria Enterprise Governance, Risk, and Compliance Market Estimates and Forecasts, by Organization Size (2020-2032) (USD Billion)
11.5.2.9 Rest of Africa
11.5.2.9.1 Rest of Africa Enterprise Governance, Risk, and Compliance Market Estimates and Forecasts, by Component (2020-2032) (USD Billion)
11.5.2.9.2 Rest of Africa Enterprise Governance, Risk, and Compliance Market Estimates and Forecasts, by Application (2020-2032) (USD Billion)
11.5.2.9.3 Rest of Africa Enterprise Governance, Risk, and Compliance Market Estimates and Forecasts, by Deployment (2020-2032) (USD Billion)
11.5.2.9.4 Rest of Africa Enterprise Governance, Risk, and Compliance Market Estimates and Forecasts, by Organization Size (2020-2032) (USD Billion)
11.6 Latin America
11.6.1 Trends Analysis
11.6.2 Latin America Enterprise Governance, Risk, and Compliance Market Estimates and Forecasts, by Country (2020-2032) (USD Billion)
11.6.3 Latin America Enterprise Governance, Risk, and Compliance Market Estimates and Forecasts, by Component (2020-2032) (USD Billion)
11.6.4 Latin America Enterprise Governance, Risk, and Compliance Market Estimates and Forecasts, by Application (2020-2032) (USD Billion)
11.6.5 Latin America Enterprise Governance, Risk, and Compliance Market Estimates and Forecasts, by Deployment (2020-2032) (USD Billion)
11.6.6 Latin America Enterprise Governance, Risk, and Compliance Market Estimates and Forecasts, by Organization Size (2020-2032) (USD Billion)
11.6.7 Brazil
11.6.7.1 Brazil Enterprise Governance, Risk, and Compliance Market Estimates and Forecasts, by Component (2020-2032) (USD Billion)
11.6.7.2 Brazil Enterprise Governance, Risk, and Compliance Market Estimates and Forecasts, by Application (2020-2032) (USD Billion)
11.6.7.3 Brazil Enterprise Governance, Risk, and Compliance Market Estimates and Forecasts, by Deployment (2020-2032) (USD Billion)
11.6.7.4 Brazil Enterprise Governance, Risk, and Compliance Market Estimates and Forecasts, by Organization Size (2020-2032) (USD Billion)
11.6.8 Argentina
11.6.8.1 Argentina Enterprise Governance, Risk, and Compliance Market Estimates and Forecasts, by Component (2020-2032) (USD Billion)
11.6.8.2 Argentina Enterprise Governance, Risk, and Compliance Market Estimates and Forecasts, by Application (2020-2032) (USD Billion)
11.6.8.3 Argentina Enterprise Governance, Risk, and Compliance Market Estimates and Forecasts, by Deployment (2020-2032) (USD Billion)
11.6.8.4 Argentina Enterprise Governance, Risk, and Compliance Market Estimates and Forecasts, by Organization Size (2020-2032) (USD Billion)
11.6.9 Colombia
11.6.9.1 Colombia Enterprise Governance, Risk, and Compliance Market Estimates and Forecasts, by Component (2020-2032) (USD Billion)
11.6.9.2 Colombia Enterprise Governance, Risk, and Compliance Market Estimates and Forecasts, by Application (2020-2032) (USD Billion)
11.6.9.3 Colombia Enterprise Governance, Risk, and Compliance Market Estimates and Forecasts, by Deployment (2020-2032) (USD Billion)
11.6.9.4 Colombia Enterprise Governance, Risk, and Compliance Market Estimates and Forecasts, by Organization Size (2020-2032) (USD Billion)
11.6.10 Rest of Latin America
11.6.10.1 Rest of Latin America Enterprise Governance, Risk, and Compliance Market Estimates and Forecasts, by Component (2020-2032) (USD Billion)
11.6.10.2 Rest of Latin America Enterprise Governance, Risk, and Compliance Market Estimates and Forecasts, by Application (2020-2032) (USD Billion)
11.6.10.3 Rest of Latin America Enterprise Governance, Risk, and Compliance Market Estimates and Forecasts, by Deployment (2020-2032) (USD Billion)
11.6.10.4 Rest of Latin America Enterprise Governance, Risk, and Compliance Market Estimates and Forecasts, by Organization Size (2020-2032) (USD Billion)
12. Company Profiles
12.1 IBM
12.1.1 Company Overview
12.1.2 Financial
12.1.3 Products/ Verticals Offered
12.1.4 SWOT Analysis
12.2 Microsoft
12.2.1 Company Overview
12.2.2 Financial
12.2.3 Products/ Verticals Offered
12.2.4 SWOT Analysis
12.3 Oracle
12.3.1 Company Overview
12.3.2 Financial
12.3.3 Products/ Verticals Offered
12.3.4 SWOT Analysis
12.4 SAP
12.4.1 Company Overview
12.4.2 Financial
12.4.3 Products/ Verticals Offered
12.4.4 SWOT Analysis
12.5 Dell Inc.
12.5.1 Company Overview
12.5.2 Financial
12.5.3 Products/ Verticals Offered
12.5.4 SWOT Analysis
12.6 Wolters Kluwer
12.6.1 Company Overview
12.6.2 Financial
12.6.3 Products/ Verticals Offered
12.6.4 SWOT Analysis
12.7 RSA Security
12.7.1 Company Overview
12.7.2 Financial
12.7.3 Products/ Verticals Offered
12.7.4 SWOT Analysis
12.8 MetricStream
12.8.1 Company Overview
12.8.2 Financial
12.8.3 Products/ Verticals Offered
12.8.4 SWOT Analysis
12.9 ServiceNow
12.9.1 Company Overview
12.9.2 Financial
12.9.3 Products/ Verticals Offered
12.9.4 SWOT Analysis
12.10 SAS Institute
12.10.1 Company Overview
12.10.2 Financial
12.10.3 Products/ Verticals Offered
12.10.4 SWOT Analysis
12.11 LogicManager
12.12 SailPoint Technologies
12.13 CyberSaint
12.14 NAVEX Global
12.15 Bwise (a Nasdaq Company)
12.16 RiskWatch
12.17 Galvanize (now Diligent)
12.18 Trustwave
12.19 Apex Analytix
12.20 Cura Software Solutions
13. Use Cases and Best Practices
14. Conclusion
An accurate research report requires proper strategizing as well as implementation. There are multiple factors involved in the completion of good and accurate research report and selecting the best methodology to compete the research is the toughest part. Since the research reports we provide play a crucial role in any company’s decision-making process, therefore we at SNS Insider always believe that we should choose the best method which gives us results closer to reality. This allows us to reach at a stage wherein we can provide our clients best and accurate investment to output ratio.
Each report that we prepare takes a timeframe of 350-400 business hours for production. Starting from the selection of titles through a couple of in-depth brain storming session to the final QC process before uploading our titles on our website we dedicate around 350 working hours. The titles are selected based on their current market cap and the foreseen CAGR and growth.
The 5 steps process:
Step 1: Secondary Research:
Secondary Research or Desk Research is as the name suggests is a research process wherein, we collect data through the readily available information. In this process we use various paid and unpaid databases which our team has access to and gather data through the same. This includes examining of listed companies’ annual reports, Journals, SEC filling etc. Apart from this our team has access to various associations across the globe across different industries. Lastly, we have exchange relationships with various university as well as individual libraries.
Step 2: Primary Research
When we talk about primary research, it is a type of study in which the researchers collect relevant data samples directly, rather than relying on previously collected data. This type of research is focused on gaining content specific facts that can be sued to solve specific problems. Since the collected data is fresh and first hand therefore it makes the study more accurate and genuine.
We at SNS Insider have divided Primary Research into 2 parts.
Part 1 wherein we interview the KOLs of major players as well as the upcoming ones across various geographic regions. This allows us to have their view over the market scenario and acts as an important tool to come closer to the accurate market numbers. As many as 45 paid and unpaid primary interviews are taken from both the demand and supply side of the industry to make sure we land at an accurate judgement and analysis of the market.
This step involves the triangulation of data wherein our team analyses the interview transcripts, online survey responses and observation of on filed participants. The below mentioned chart should give a better understanding of the part 1 of the primary interview.
Part 2: In this part of primary research the data collected via secondary research and the part 1 of the primary research is validated with the interviews from individual consultants and subject matter experts.
Consultants are those set of people who have at least 12 years of experience and expertise within the industry whereas Subject Matter Experts are those with at least 15 years of experience behind their back within the same space. The data with the help of two main processes i.e., FGDs (Focused Group Discussions) and IDs (Individual Discussions). This gives us a 3rd party nonbiased primary view of the market scenario making it a more dependable one while collation of the data pointers.
Step 3: Data Bank Validation
Once all the information is collected via primary and secondary sources, we run that information for data validation. At our intelligence centre our research heads track a lot of information related to the market which includes the quarterly reports, the daily stock prices, and other relevant information. Our data bank server gets updated every fortnight and that is how the information which we collected using our primary and secondary information is revalidated in real time.
Step 4: QA/QC Process
After all the data collection and validation our team does a final level of quality check and quality assurance to get rid of any unwanted or undesired mistakes. This might include but not limited to getting rid of the any typos, duplication of numbers or missing of any important information. The people involved in this process include technical content writers, research heads and graphics people. Once this process is completed the title gets uploader on our platform for our clients to read it.
Step 5: Final QC/QA Process:
This is the last process and comes when the client has ordered the study. In this process a final QA/QC is done before the study is emailed to the client. Since we believe in giving our clients a good experience of our research studies, therefore, to make sure that we do not lack at our end in any way humanly possible we do a final round of quality check and then dispatch the study to the client.
Key Segments:
By Component
Software
Services
By Deployment
Cloud
On-premises
By Organization size
Large Enterprise
Small & Medium Enterprise
By Vertical
BFSI
Healthcare
Government
Energy & Utilities
Manufacturing
Retail & Consumer Goods
Telecom & IT
Others (Transportation & Logistics, Construction, etc.)
Request for Segment Customization as per your Business Requirement: Segment Customization Request
REGIONAL COVERAGE:
North America
US
Canada
Mexico
Europe
Eastern Europe
Poland
Romania
Hungary
Turkey
Rest of Eastern Europe
Western Europe
Germany
France
UK
Italy
Spain
Netherlands
Switzerland
Austria
Rest of Western Europe
Asia Pacific
China
India
Japan
South Korea
Vietnam
Singapore
Australia
Rest of Asia Pacific
Middle East & Africa
Middle East
UAE
Egypt
Saudi Arabia
Qatar
Rest of the Middle East
Africa
Nigeria
South Africa
Rest of Africa
Latin America
Brazil
Argentina
Colombia
Rest of Latin America
Request for Country Level Research Report: Country Level Customization Request
Available Customization
With the given market data, SNS Insider offers customization as per the company’s specific needs. The following customization options are available for the report:
Product Analysis
Criss-Cross segment analysis (e.g. Product X Application)
Product Matrix which gives a detailed comparison of product portfolio of each company
Geographic Analysis
Additional countries in any of the regions
Company Information
Detailed analysis and profiling of additional market players (Up to five)
The AI Agents Market Size was valued at USD 3.7 Billion in 2023 and is expected to reach USD 103.6 Billion by 2032, growing at a CAGR of 44.9% by 2024-2032.
The Streaming Analytics Market size was valued at USD 22.97 Billion in 2023 and is expected to reach USD 231.35 Billion by 2032, and grow at a CAGR of 29.26 % over the forecast period 2024-2032.
The Intelligent Process Automation Market Size was valued at USD 13.80 Billion in 2023 and is expected to reach USD 47.02 Billion by 2032 and grow at a CAGR of 15.40% over the forecast period 2024-2032.
The Digital Farming Market size was valued at USD 23.9 Billion in 2023 and is expected to grow to USD 74.70 Billion by 2032 and grow at a CAGR of 13.5% over the forecast period of 2024-2032.
The Alternative Data Market size was USD 7.18 Billion in 2023 and is expected to Reach USD 289.56 Billion by 2032 and grow at a CAGR of 50.8% over the forecast period of 2024-2032.
The Hyper Converged Infrastructure Market was worth USD 12.87 billion in 2022 and is anticipated to be worth USD 92.50 billion by 2030, growing at a 27.96% CAGR between 2023 and 2030.
Hi! Click one of our member below to chat on Phone