Copper Mining Market Size Analysis
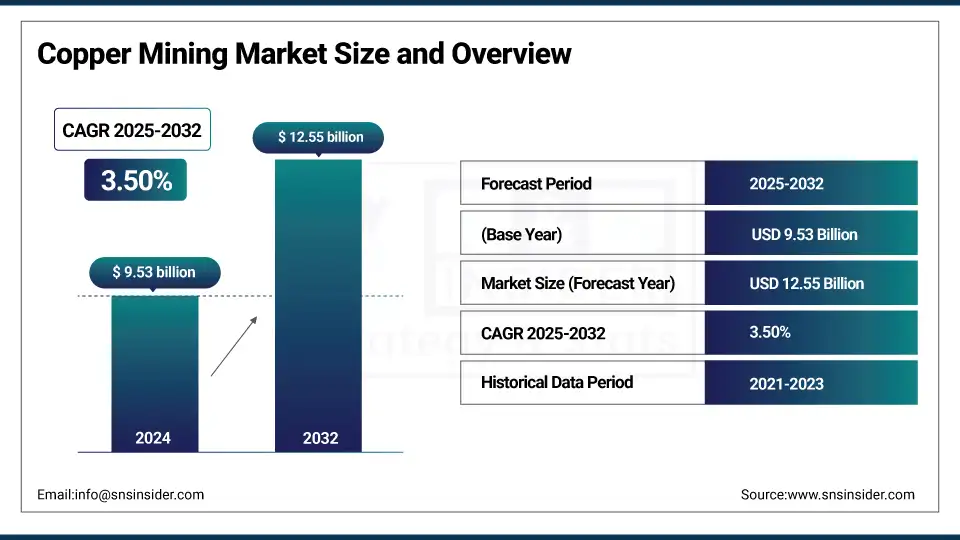
The Copper Mining Market size was valued at USD 9.53 billion in 2024 and is expected to reach USD 12.55 billion by 2032, growing at a CAGR of 3.50% over the forecast period 2025-2032.
The copper mining market continues to experience robust growth driven by increasing demand from industries such as construction, electronics, and renewable energy. The market's dynamics are influenced by technological advancements, sustainability initiatives, and strategic acquisitions. In January 2025, BHP and Lundin Mining completed the acquisition of Filo Corp, underscoring their intent to expand resource bases and meet rising global demand. Similarly, Metso secured a $30 million contract in January 2025 to supply critical equipment for a copper plant in Oman, emphasizing infrastructure development and technological innovation. The industry's shift toward eco-friendly mining practices was evident in Vedanta Resources reclaiming control of Zambian copper mines in July 2024, showcasing their commitment to sustainable operations and local community benefits. In December 2024, Hindalco Industries highlighted the growing role of copper in the electric vehicle sector, reflecting the metal’s importance in energy and technological transformations.
Global developments continue to shape the copper mining landscape. In November 2024, MDO celebrated the groundbreaking of the Mazoon Copper Project, signaling efforts to expand regional production capacities. In January 2025, Zambia sought investments from the UAE and Saudi Arabia to boost its copper industry, emphasizing international collaboration to strengthen production. Companies are also reevaluating asset portfolios; Barrick Gold Corporation considered selling its stake in the Zaldivar copper mine in January 2025 to optimize its assets strategically. Furthermore, copper experienced its longest rally since 2017 due to strong demand signals from China, as reported in January 2025, which bolstered market optimism. These developments showcase how major players are adapting to evolving market demands, enhancing production capacities, and navigating geopolitical and environmental challenges to maintain their competitive edge.
Copper Mining Market Size and Forecast
-
Market Size in 2024: USD 9.53 Billion
-
Market Size by 2032: USD 12.55 Billion
-
CAGR: 3.50% from 2025 to 2032
-
Base Year: 2024
-
Forecast Period: 2025–2032
-
Historical Data: 2022–2024
To Get more information On Copper Mining Market - Request Free Sample Report
Copper Mining Market Trends
-
Rising demand from the electric vehicle (EV) sector is accelerating copper consumption, as EVs use 2–4 times more copper than internal combustion engine vehicles, with EV sales growing at over 20% annually.
-
Expansion of renewable energy infrastructure is boosting copper demand, with solar and wind installations accounting for nearly 30% of incremental copper consumption globally.
-
Declining ore grades are increasing production costs, as average copper ore grades have fallen by around 25% over the past decade, driving investment in advanced extraction technologies.
-
Growing investments in mine automation and digitalization are improving productivity, reducing operational costs by 10–15% through AI-based monitoring and autonomous haulage systems.
-
Strong focus on sustainability and recycling is shaping the market, with recycled copper contributing over 30% of global supply, helping offset primary mining constraints.
Copper Mining Market Drivers
-
Rising Demand for Copper in Renewable Energy Projects Accelerates Market Expansion
-
Increasing Urbanization and Infrastructure Development Fuels Copper Demand
-
Expanding Electric Vehicle Market Propels Copper Consumption
The increasing shift towards electric vehicles (EVs) is a significant driver for copper demand, as EVs require three to four times more copper than traditional vehicles. Copper is extensively used in EV batteries, motors, charging stations, and wiring. For instance, an average EV contains approximately 80 kg of copper, compared to 20 kg in a gasoline-powered vehicle. The rising adoption of EVs is fueled by stringent emission regulations and government incentives promoting cleaner transportation alternatives. Leading automakers like Tesla and Volkswagen are scaling up EV production, while countries like the U.S. and China are heavily investing in EV charging infrastructure. As the global EV market continues to expand, copper mining companies are witnessing increasing opportunities to cater to this rapidly growing segment. This trend is further amplified by advancements in EV battery technology, which relies on copper for enhanced efficiency and conductivity.
Copper Mining Market Restraints
-
Environmental Concerns and Stringent Regulations Limit Expansion of Copper Mining Activities Globally
Copper mining operations are often associated with significant environmental challenges, including deforestation, soil degradation, and water contamination. These activities can disrupt local ecosystems and adversely affect biodiversity. In response to these environmental impacts, governments and regulatory bodies worldwide have imposed stringent environmental regulations, limiting the expansion of mining activities. For instance, environmental clearances for new mining projects often involve lengthy and complex processes, which delay operations and increase costs. Additionally, growing public awareness and activism against large-scale mining have added further pressure on companies to adopt more sustainable practices. While many mining companies are exploring eco-friendly alternatives, such as recycling and low-impact mining techniques, these solutions require substantial investments. Consequently, the industry faces challenges in balancing profitability with sustainability, which may limit growth in the copper mining sector.
Copper Mining Market Opportunities
-
Increasing Investment in Smart Grids and IoT Infrastructure Drives Copper Consumption
-
Development of Circular Economy Initiatives Creates New Growth Avenues for Copper Recycling
The increasing focus on circular economy practices has created lucrative opportunities for copper recycling. Recycled copper requires up to 85% less energy to process compared to mined copper, aligning with global sustainability goals. Governments and organizations worldwide are promoting copper recycling programs to reduce dependency on raw material extraction. For example, the European Union has implemented stringent recycling regulations, encouraging industries to use secondary copper in manufacturing. Additionally, advancements in recycling technology have improved the efficiency of extracting copper from discarded electronics and industrial waste. As industries shift towards environmentally responsible practices, the demand for recycled copper is expected to rise significantly, providing a sustainable growth avenue for copper mining companies.
Copper Mining Market Challenges
-
Volatility in Copper Prices Due to Geopolitical and Macroeconomic Factors Affects Market Stability
Copper prices are highly susceptible to fluctuations driven by geopolitical tensions, trade disputes, and macroeconomic conditions. For instance, trade restrictions between major copper-producing and consuming nations can disrupt supply chains, leading to price volatility. Similarly, economic downturns or currency fluctuations impact global demand and profitability for mining companies. Recent geopolitical events, such as trade tensions between the U.S. and China, have underscored the vulnerability of copper prices to external factors. Such instability makes it challenging for mining companies to plan long-term investments and operations, posing a significant hurdle to market growth.
Environmental and Regulatory Landscape in the Copper Mining Market
Copper mining operations are increasingly influenced by stringent environmental regulations and sustainability goals. Governments and organizations globally are adopting policies to mitigate the ecological impact of mining activities. Key initiatives focus on reducing emissions, managing waste, and implementing sustainable practices. The table below summarizes significant environmental and regulatory insights shaping the industry.
| Insight | Description |
|---|---|
| Emission Reduction Policies | Governments mandate emission limits for mining operations to curb greenhouse gases and pollutants. |
| Waste Management Standards | Regulations enforce proper disposal of tailings and waste to minimize environmental contamination. |
| Sustainable Mining Certification | Industry initiatives promote certifications for sustainable mining practices, ensuring eco-friendly operations. |
| Water Usage Restrictions | Laws regulate water consumption and recycling in arid regions to prevent resource depletion. |
| Rehabilitation and Reclamation Laws | Companies are required to restore mined land to its natural state after operations. |
These regulations reflect the global drive towards eco-friendly mining practices, with companies adopting technologies and policies to comply. By addressing environmental concerns, the copper mining industry aligns with the growing emphasis on sustainability while navigating evolving regulatory frameworks.
Copper Mining Market Segment Highlights
By Mining Method
Open-pit mining dominated the copper mining market in 2024 with a market share of approximately 75%. This mining method involves extracting ore from a large, stepped excavation, which allows for the efficient removal of large quantities of ore from the earth’s surface. Open-pit mining is favored due to its relatively low operational costs and the ability to access large, shallow ore bodies. Many of the world’s largest copper mines, such as the Escondida mine in Chile, use open-pit mining because of the vast ore deposits located near the surface. This technique maximizes resource extraction at a lower cost compared to underground mining, making it more economically viable for large-scale copper production. Furthermore, advancements in mining equipment, such as larger haul trucks and automated drills, have significantly boosted the efficiency of open-pit mining. With the increasing demand for copper in industries like electrical equipment, construction, and transportation, open-pit mining continues to be the preferred method for copper extraction due to its scalability and cost-effectiveness.
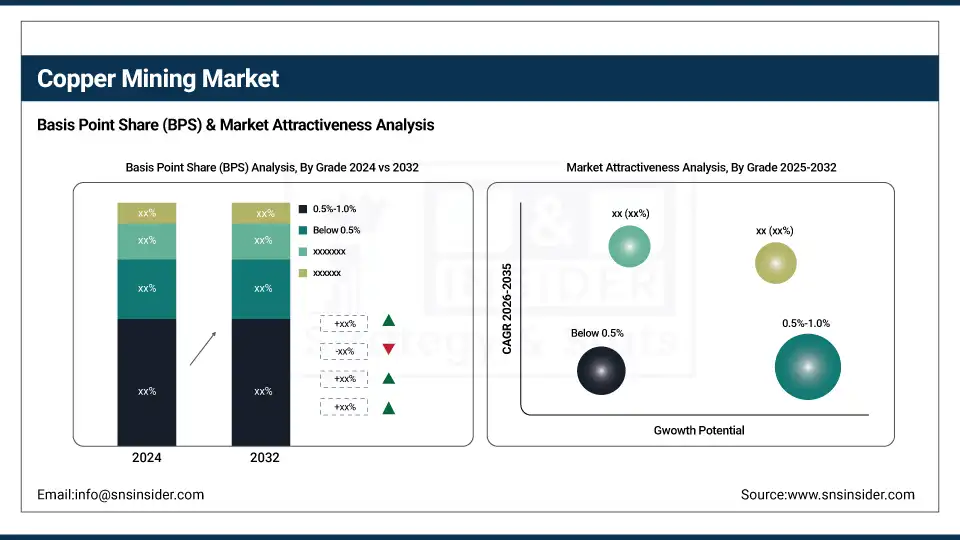
By Grade
The 0.5%-1.0% grade segment dominated the copper mining market in 2024, with a market share of around 55%. This grade represents a balanced extraction method, where copper concentrations are moderate enough to ensure efficient processing without excessive costs. Copper ore in this grade range can be mined in large quantities, making it an attractive option for major copper-producing companies that require the steady output to meet industrial demand. This grade is commonly found in large copper mines like the Morenci mine in Arizona, USA, where copper is extracted through open-pit mining. Mines in regions like Chile, which host significant copper reserves, also often target this grade range due to its economic viability. The advantage of mining copper in the 0.5%-1.0% range is that it ensures consistent, predictable yields, which helps to maintain a stable supply chain for copper-consuming industries, including electronics, construction, and transportation. As the demand for copper rises, especially with the shift toward renewable energy technologies, copper with this grade remains a key resource.
By Application
The electrical industry dominated the copper mining market in 2024 with a market share of approximately 50%. Copper’s exceptional electrical conductivity makes it a vital material for electrical wiring, power generation, and distribution. The surge in demand for renewable energy technologies, such as solar panels and electric vehicles, has significantly increased the need for copper in the electrical industry. For instance, the growing shift to electric vehicles (EVs) has led to a substantial increase in copper demand, as each EV uses several times more copper than conventional vehicles due to the high copper content in batteries, motors, and wiring systems. Similarly, copper is essential in electrical grids and renewable energy systems, where its superior conductivity ensures the efficient transmission of power. Copper's use in wiring and connectors for consumer electronics further bolsters its position in the electrical sector. As global efforts to transition to cleaner energy sources intensify, copper’s role in the electrical industry is expected to expand, solidifying its dominance in the copper mining market.
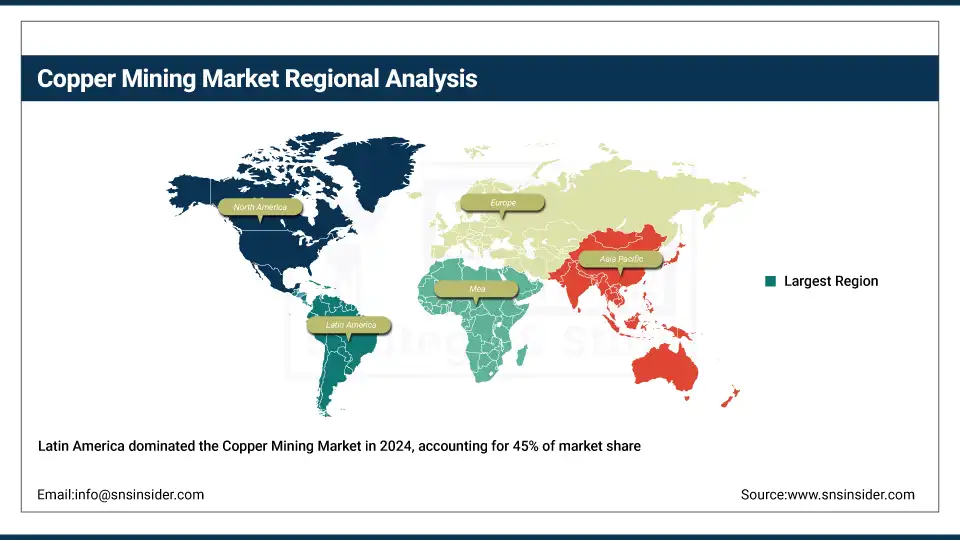
Copper Mining Market Regional Insights
Latin America Copper Mining Market Insights
Latin America dominated the copper mining market in 2024, with a market share of approximately 45%. This region is home to some of the world’s largest and most productive copper mines, particularly in countries like Chile and Peru. Chile, in particular, remains the world’s largest producer of copper, accounting for around 28% of the global copper supply, with significant operations such as the Escondida mine, the largest copper mine globally. The country’s vast open-pit mining operations and advanced mining technologies continue to ensure its dominance in the copper market. Peru also plays a crucial role in Latin America’s dominance, with copper mines like the Antamina mine, one of the largest copper and zinc mines in the world. Other notable contributors from the region include Mexico, which has been increasing its copper output due to rising demand from the electrical and renewable energy sectors. Latin America’s dominance is further supported by a favorable regulatory environment, abundant copper reserves, and a well-established mining infrastructure that attracts significant investments. The region’s established market presence and future potential ensure its continued leadership in copper production.
Get Customized Report as per Your Business Requirement - Enquiry Now
Asia Pacific Copper Mining Market Insights
Asia Pacific emerged as the fastest-growing region in the copper mining market in 2024, with a CAGR of around 6%. This growth is primarily driven by the rapid industrialization, urbanization, and growing demand for copper in countries like China and India. China, the largest consumer of copper globally, has seen a significant rise in its demand for copper, primarily due to its booming electrical, construction, and renewable energy sectors. As the nation continues its transition towards green technologies, such as electric vehicles and solar power, the need for copper has soared. India, on the other hand, is investing heavily in infrastructure development and is seeing increased demand for copper for use in electrical wiring, electronics, and transportation. China’s continued expansion of electric vehicle production, alongside the rise in copper-intensive renewable energy projects, has further propelled the region’s growth. Countries like Indonesia and the Philippines are also emerging as significant players in the copper mining sector, with investments flowing into mining projects due to their rich copper deposits. The rapid growth in Asia Pacific is further amplified by the increasing number of mining operations and the region's focus on meeting the global demand for copper, making it the fastest-growing region in 2024.
North America Copper Mining Market Insights
The North America copper mining market is driven by strong demand from electrical, construction, and renewable energy sectors. Countries like the U.S., Canada, and Mexico are major contributors, with large-scale copper mines and extensive exploration activities. Growing adoption of electric vehicles and renewable energy infrastructure, such as wind and solar power, is increasing the consumption of copper. Regulatory frameworks focusing on environmental protection and sustainable mining practices are influencing operational strategies. Key players are investing in modern extraction technologies, recycling initiatives, and process optimization to meet rising demand while reducing environmental impact, supporting long-term market growth.
Europe Copper Mining Market Insights
Europe’s copper mining market is shaped by limited domestic resources and high import reliance, particularly from Africa and South America. Countries such as Spain, Poland, and Sweden have active mining operations but focus primarily on high-grade ore extraction. The growing need for copper in electronics, power transmission, and electric vehicles is driving demand, while stringent EU environmental regulations promote sustainable mining and recycling initiatives. Mining companies are adopting advanced extraction techniques and automation to increase efficiency and minimize ecological impact. Investments in secondary copper production and strategic partnerships are expected to strengthen Europe’s position in the global copper market.
Middle East & Africa Copper Mining Market Insights
The Middle East & Africa copper mining market benefits from abundant reserves in countries like Zambia, Democratic Republic of Congo, and Morocco. Copper is crucial for construction, power generation, and industrial applications, with global demand driving mining expansions. Investment in modern mining technologies and infrastructure is increasing productivity and efficiency. Environmental and safety regulations are influencing operational practices, encouraging sustainable extraction. Export opportunities to Europe and Asia are strong, while local governments incentivize mining investments to boost economic growth. Continuous exploration, coupled with foreign investments, is expected to sustain the region’s market expansion and strengthen its global copper supply role.
Competitive Landscape for Copper Mining Market
African Copper Plc, headquartered in London, UK, focuses on the exploration and development of copper deposits in Botswana. Its primary asset, the Mowana Mine in the Kalahari Copper Belt, contains significant copper reserves. The company specializes in sustainable and efficient mining operations, aiming to expand its exploration footprint in the region. By integrating advanced mining technologies and environmental management practices, African Copper Plc seeks to optimize production, reduce operational costs, and strengthen its position as a leading copper developer in Southern Africa.
-
In August 2025, African Copper Plc partnered with a local energy firm to implement renewable power solutions at the Mowana Mine, reducing operational costs and improving environmental performance.
Amerigo Resources Ltd., based in Vancouver, Canada, produces copper and molybdenum concentrates from tailings at Chile’s El Teniente Mine. Through its subsidiary, Minera Valle Central, it uses a gravity-based system for sustainable copper recovery. The company emphasizes environmentally responsible operations, cost-efficient production, and innovation in tailings management. Amerigo Resources leverages strategic partnerships, advanced technologies, and continuous process improvements to maximize copper extraction, reduce environmental impact, and ensure long-term resource sustainability while maintaining strong relationships with stakeholders in the mining sector.
-
In September 2025, Amerigo Resources reported a 15% production increase at its MVC operations, driven by upgraded processing technology and operational efficiency improvements.
Anglo American, headquartered in London, UK, is a leading global mining company with extensive copper operations, including Los Bronces and Collahuasi in Chile. The company focuses on sustainable mining practices, operational efficiency, and maximizing ore recovery. Its copper division is integral to supplying essential metals for infrastructure, electrical, and renewable energy sectors. Anglo American invests in advanced technologies, environmental stewardship, and workforce development to enhance productivity, extend mine life, and maintain a competitive advantage in the global copper market.
-
In October 2025, Anglo American committed $3 billion to expand underground operations at Los Bronces, targeting higher-grade ores and a 20% increase in annual copper output.
Copper Mining Market Key Players
-
African Copper Plc. (Copper concentrate, Copper cathodes)
-
Amerigo Resources Ltd. (Copper concentrates, Molybdenum concentrates)
-
Anglo American (Copper cathodes, Copper concentrates)
-
Advance SCT Limited (Copper concentrate, Mining projects)
-
Bougainville Copper Limited (Copper concentrate, Gold)
-
BHP Billiton Ltd. (Copper concentrate, Refined copper)
-
Caribou King Resources Limited (Copper-gold concentrates, Exploration projects)
-
Codelco (Refined copper, Copper cathodes)
-
Dot Resources Ltd. (Copper concentrate, Copper exploration)
-
First Quantum Minerals (Copper concentrate, Copper cathodes)
-
Freeport-McMoRan Inc. (Copper concentrate, Molybdenum concentrate)
-
Glencore International AG (Copper cathodes, Copper concentrate)
-
Global Hunter Corp. (Copper exploration, Copper concentrate)
-
Grupo Mexico (Copper concentrate, Refined copper)
-
Hindalco Industries (Copper cathodes, Copper rods)
-
Hindustan Copper (Copper concentrate, Refined copper)
-
KGHM (Copper concentrate, Refined copper)
-
McMoRan Inc. (Copper concentrate, Molybdenum concentrate)
-
Rio Tinto (Copper concentrate, Refined copper)
-
Southern Copper Corp. (Copper concentrate, Copper cathodes)
| Report Attributes | Details |
|---|---|
| Market Size in 2024 | US$ 9.53 Billion |
| Market Size by 2032 | US$ 12.55 Billion |
| CAGR | CAGR of 3.50% From 2025 to 2032 |
| Base Year | 2024 |
| Forecast Period | 2025-2032 |
| Historical Data | 2021-2023 |
| Report Scope & Coverage | Market Size, Segments Analysis, Competitive Landscape, Regional Analysis, DROC & SWOT Analysis, Forecast Outlook |
| Key Segments | •By Mining Method (Open-pit Mining, Underground Mining) •By Grade (Below 0.5%, 0.5%-1.0%, 1.0%-1.5%, Above 1.5%) •By Application (Electrical Industry, Construction Industry, Transportation Industry, Industrial Equipment, Others) |
| Regional Analysis/Coverage | North America (US, Canada, Mexico), Europe (Eastern Europe [Poland, Romania, Hungary, Turkey, Rest of Eastern Europe] Western Europe] Germany, France, UK, Italy, Spain, Netherlands, Switzerland, Austria, Rest of Western Europe]), Asia Pacific (China, India, Japan, South Korea, Vietnam, Singapore, Australia, Rest of Asia Pacific), Middle East & Africa (Middle East [UAE, Egypt, Saudi Arabia, Qatar, Rest of Middle East], Africa [Nigeria, South Africa, Rest of Africa], Latin America (Brazil, Argentina, Colombia, Rest of Latin America) |
| Company Profiles |
African Copper Plc., Amerigo Resources Ltd., Anglo American, Advance SCT Limited, Bougainville Copper Limited, BHP Billiton Ltd., Caribou King Resources Limited, Codelco, Dot Resources Ltd., First Quantum Minerals, Freeport-McMoRan Inc., Glencore International AG, Global Hunter Corp., Grupo Mexico, Hindalco Industries, Hindustan Copper, KGHM, McMoRan Inc., Rio Tinto, and Southern Copper Corp. |
Frequently Asked Questions
Ans: Geopolitical tensions, trade disputes, and macroeconomic conditions cause copper price fluctuations, creating market instability and challenging long-term planning for mining companies.
Ans: Circular economy initiatives, smart grid and IoT investments, and untapped copper reserves in emerging markets are driving growth opportunities for copper recycling and mining.
Ans: The Copper Mining Market size was valued at USD 9.53 billion in 2024 and is expected to reach USD 12.55 billion by 2032.
Ans: In 2023, Latin America, led by Chile and Peru, dominated the copper mining market with a 45% share, driven by major mines like Escondida and Antamina, and supported by favorable regulations and investments.
Ans: The Copper Mining Market is expected to grow at a CAGR of 3.50%
Get in Touch
