image

Corporate Social Responsibility Software Market Report Scope & Overview:
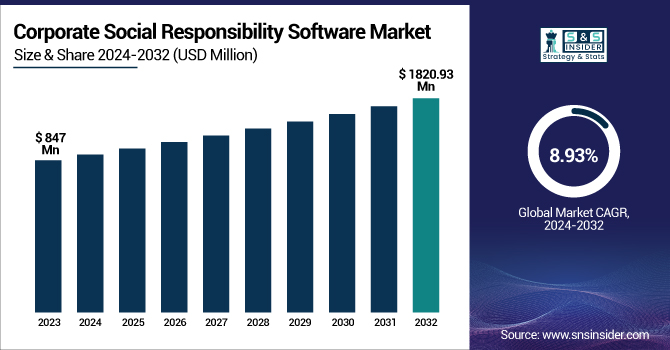
Corporate Social Responsibility Software Market was valued at USD 847 million in 2023 and is expected to reach USD 1820.93 million by 2032, growing at a CAGR of 8.93% from 2024-2032 

The report contains observations on investment and expenditure trends, including accelerated investments in CSR activities. Regulatory compliance data show greater observation of sustainability and ESG reporting norms. Integration of AI and automation is revolutionizing CSR software, expanding data handling capabilities and metrics of impact. Employee involvement in CSR programs is also on the rise as firms foreground engagement and corporate accountability.

Market growth is driven by changing regulations, advancing technology, and increasing corporate dedication to sustainability. As companies look for more effective means of controlling CSR activities, software solutions are constantly developing, providing improved tracking, reporting, and automation functionality in line with international ESG objectives.

Corporate Social Responsibility Software Market was valued at USD 213.19 million in 2023 and is expected to reach USD 461.26 million by 2032, growing at a CAGR of 8.95% from 2024-2032 

The Corporate Social Responsibility (CSR) Software Market growth is prompted by a number of factors. Growing concern for sustainability as well as ESG (Environmental, Social, Governance) standards contribute to pressure on organizations to implement effective tools to monitor and report on their CSR activities. Regulatory requirements are also forcing businesses to adapt to changing environment and social responsibility requirements. In addition, combining AI and automation in CSR software improves the management of data and measuring impact, increasing its efficiency. Furthermore, increased consumers' demand for companies' transparency and ethical business drives market growth because companies will look for software solutions that show they care about social responsibility.

Corporate Social Responsibility Software Market Dynamics

Drivers

  • Rising Consumer Demand for Ethical Practices Driving Companies to Adopt CSR Strategies for Brand Loyalty and Reputation

As awareness of corporate ethics among consumers increases, businesses are increasingly being compelled to show they are committed to sustainability and social responsibility. With increased transparency being demanded, customers are turning to brands that have a focus on ethical business conduct, fair treatment of employees, eco-friendliness, and community engagement. This change in consumer behavior is triggering companies to implement Corporate Social Responsibility (CSR) practices as a part of their mainstream operations. Through such efforts, organizations seek to improve customer relationships and build their image. By embracing CSR in business models, firms not only serve consumer needs but also stand out in a market environment, paving the way towards long-term customer loyalty and presenting themselves as social responsibility leaders within their respective businesses.

Restraints

  • Lack of Universal CSR Reporting Standards Creates Challenges in Effectiveness and Adoption of CSR Software Solutions

The lack of globally accepted standards and guidelines for Corporate Social Responsibility (CSR) reporting poses severe challenges to organizations. With growing demands from companies to monitor, quantify, and report their CSR activities, the lack of any uniform approach causes disparities in data collection and assessment procedures. This inconsistency makes it hard to compare CSR initiatives among organizations, lowering the overall efficacy of CSR software solutions. Firms end up having to tailor their software to meet differing reporting needs, raising costs and complexity. Second, without shared guidelines, the software might not generate actionable data or report consistent measures, diminishing its ability to help drive sustained improvements in CSR practices. Thus, the absence of standardization delays the cross-industry deployment of CSR software solutions.

Opportunities

  • AI and Data Analytics Integration Enhances Decision-Making and Impact in CSR Software Solutions

The innovation in artificial intelligence (AI) and data analytics is a great opportunity to transform CSR software by providing predictive insights and more advanced data processing functionality. These technologies allow businesses to process large volumes of CSR data, find patterns, and predict results, which can strongly improve decision-making. Through the use of AI, organizations can make their tracking and measurement of CSR activities more automated, with timely and accurate reporting. Data analytics enable firms to quantify the reach of their social and environmental efforts, facilitating easier improvements in strategy for more effectiveness. Consequently, companies are able to craft more specific CSR programs, enhance openness, and show commitment to sustainability, all of which can promote a more favorable reputation for their brand and sustained success in their CSR activities.

Challenges

  • Ensuring Accurate and Reliable Data is Crucial for Effective Implementation and Decision-Making in CSR Software Solutions

Accuracy and reliability of data are paramount in the case of CSR software since bad data quality has the potential to greatly compromise the success of corporate social responsibility programs. If data employed in the software is bad, incomplete, or outdated, it can generate misleading reports that will prompt companies to make wrong decisions based on erroneous insights. This not only impedes the effectiveness of CSR initiatives but can also lead to reputational loss and legal action. Businesses need to ensure that their data is thoroughly gathered, authenticated, and kept in place to prevent these issues. Additionally, dealing with the enormous quantities of data related to CSR activities can be costly, involving strong systems and processes for ongoing monitoring and enhancement, adding more complexity to implementing CSR software.

Corporate Social Responsibility Software Market Segment Analysis

By Deployment

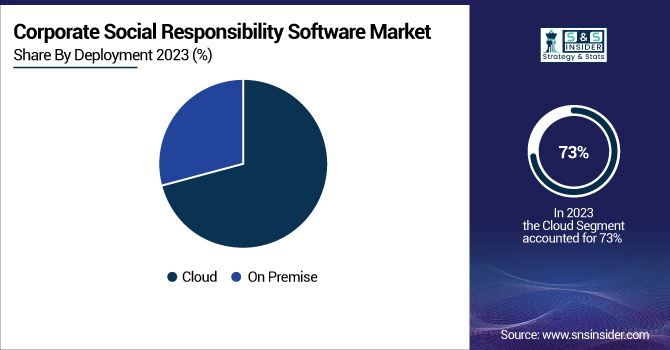
The cloud segment led the Corporate Social Responsibility (CSR) Software Market in 2023 with the largest revenue share of approximately 73%. This is driven by the scalability, affordability, and ease of deployment offered by cloud solutions. Cloud CSR software enables organizations to access data in real time, facilitate collaboration, and have seamless maintenance and updates. Moreover, the growing trend towards digital transformation and remote working has also generated greater demand for flexible, cloud-based options that allow companies to effectively manage CSR initiatives.

The On-Premise segment is expected to grow at the fastest CAGR of approximately 10.63% during 2024-2032, based on growing concerns regarding data security and compliance. Certain organizations, especially those operating in regulated industries, prefer on-premise CSR software to have complete control over their sensitive data and maintain local regulation compliance. On-premise solutions also provide customization and integration advantages, enabling organizations to adapt software to meet their unique CSR requirements and internal systems.

By Application

The Large Enterprise segment led the Corporate Social Responsibility (CSR) Software Market in 2023, with the largest revenue share of around 73%. Large enterprises usually have large CSR programs and need strong, scalable software to manage and report their initiatives properly. These enterprises can afford to spend money on full-fledged CSR solutions, enabling them to monitor and quantify sustainability efforts across different regions and departments. The need for data-driven insights and adherence to international standards also lends strength to the dominance of this segment.

The Small & Medium Enterprises (SMEs) segment is expected to grow at the fastest CAGR of roughly 10.74% during the period 2024-2032, led by heightened awareness towards CSR and sustainability. As SMEs aim to improve their corporate reputation and attract socially responsible consumers, they are implementing cost-efficient CSR software solutions. Improvements in cloud-based technologies, with scalable and low-cost solutions, have enabled SMEs to incorporate CSR strategies into their business without a huge initial investment.

Regional Analysis

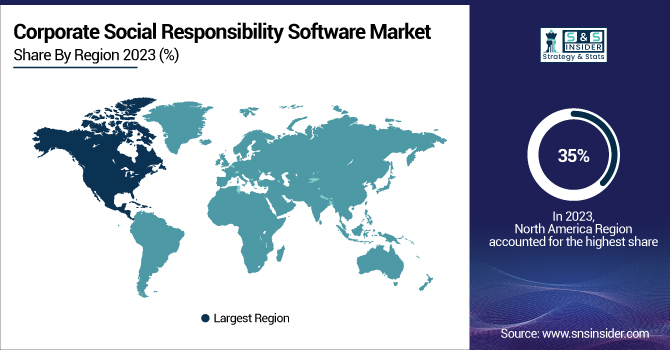
North America led the Corporate Social Responsibility (CSR) Software Market in 2023 with the largest revenue share of around 35%. This leadership is due to the region's robust regulatory framework, where companies are mandated to comply with strict standards of sustainability and reporting. Moreover, North American firms are forerunners in embracing sophisticated technologies, fueling the need for strong CSR software solutions. The increasing focus on environmental, social, and governance (ESG) considerations, combined with the high corporate consciousness, adds to the market leadership in this region as well.

Asia Pacific is expected to grow at the fastest CAGR of about 11.12% during the forecast period 2024-2032, fueled by fast-paced industrialization, urbanization, and rising interest in sustainable business practices. With governments in the region adopting more stringent environment regulations, companies are forced to use CSR software for reporting and compliance. Also, the increasing presence of small and medium-sized enterprises (SMEs) in the region looking to improve their CSR activities will continue to drive market growth in Asia Pacific.

Key Players

  • Benevity, Inc. [Workplace Giving, Volunteering]

  • Chezuba [Employee Volunteering, Workplace Giving]

  • Wolters Kluwer N.V. [Enablon CSR Management, OneSumX for ESG]

  • iPoint-systems gmbh [iPoint Compliance, iPoint Sustainability]

  • Blackbaud [Blackbaud Corporate Social Responsibility, Blackbaud Grantmaking]

  • Tennaxia [Tennaxia CSR Reporting, Tennaxia Environmental Management]

  • Vee Technologies [CSR Consulting Services, CSR Impact Assessment]

  • NAVEX, Inc. [NAVEX ESG, NAVEX Ethics & Compliance Platform]

  • Salesforce, Inc. [Philanthropy Cloud, Sustainability Cloud]

  • CyberSWIFT Infotech Pvt. Ltd. [CSR Management Software, CSR Impact Assessment Tool]

  • Kronos Incorporated [Workforce Central, Workforce Dimensions]

  • Workday [Workday Human Capital Management, Workday Financial Management]

  • UKG (Ultimate Kronos Group) [UKG Pro, UKG Dimensions]

  • Infor [Infor CloudSuite Corporate, Infor Environmental Sustainability]

  • Oracle [Oracle Cloud ERP, Oracle Social Impact]

  • Microsoft [Microsoft Cloud for Sustainability, Dynamics 365]

  • Adobe [Adobe Experience Cloud, Adobe Document Cloud]

  • SAP [SAP Sustainability Control Tower, SAP Environment, Health, and Safety Management]

  • IBM [IBM Environmental Intelligence Suite, IBM TRIRIGA]

  • Zenefits [Zenefits HR, Zenefits Payroll]

  • ServiceNow [ServiceNow ESG Management, ServiceNow Integrated Risk Management]

  • Namely [Namely HR, Namely Compliance]

  • BambooHR [BambooHR Employee Management, BambooHR Payroll]

  • Gusto [Gusto HR, Gusto Payroll]

Recent Developments:

  • In March 2025, Workday announced the integration of Evisort’s AI-powered contract intelligence and lifecycle management solutions, helping businesses unlock critical insights, optimize spend, and reduce risks, transforming contracts into strategic assets.

Corporate Social Responsibility Software Market Report Scope

Report Attributes Details
Market Size in 2023 US$ 847 Million
Market Size by 2032 US$ 1820.93 Million
CAGR CAGR of 8.93% From 2024 to 2032
Base Year 2023
Forecast Period 2024-2032
Historical Data 2020-2022
Report Scope & Coverage Market Size, Segments Analysis, Competitive  Landscape, Regional Analysis, DROC & SWOT Analysis, Forecast Outlook
Key Segments • By Deployment (On-Premise, Cloud)
• By Application (Large Enterprise, Small & Medium Enterprises)
Regional Analysis/Coverage North America (US, Canada, Mexico), Europe (Eastern Europe [Poland, Romania, Hungary, Turkey, Rest of Eastern Europe] Western Europe] Germany, France, UK, Italy, Spain, Netherlands, Switzerland, Austria, Rest of Western Europe]), Asia Pacific (China, India, Japan, South Korea, Vietnam, Singapore, Australia, Rest of Asia Pacific), Middle East & Africa (Middle East [UAE, Egypt, Saudi Arabia, Qatar, Rest of Middle East], Africa [Nigeria, South Africa, Rest of Africa], Latin America (Brazil, Argentina, Colombia, Rest of Latin America)
Company Profiles Benevity, Inc., Chezuba, Wolters Kluwer N.V., iPoint-systems gmbh, Blackbaud, Tennaxia, Vee Technologies, NAVEX, Inc., Salesforce, Inc., CyberSWIFT Infotech Pvt. Ltd., Kronos Incorporated, Workday, UKG (Ultimate Kronos Group), Infor, Oracle, Microsoft, Adobe, SAP, IBM, Zenefits, ServiceNow, Namely, BambooHR, Gusto

Frequently Asked Questions

ANS: Corporate Social Responsibility Software Market was valued at USD 847 million in 2023 and is expected to reach USD 1820.93 million by 2032, growing at a CAGR of 8.93% from 2024-2032 

ANS: The cloud segment dominated the market with the highest revenue share of about 73% in 2023 due to scalability and cost-efficiency.

ANS: The Small & Medium Enterprises (SMEs) segment is expected to grow at a CAGR of 10.74% from 2024-2032, driven by increasing sustainability awareness.

ANS: North America held the largest market share at 35% in 2023, supported by strong regulatory environments and high corporate awareness of CSR.

ANS: Asia Pacific is expected to grow at the fastest CAGR of 11.12% from 2024-2032, driven by industrialization, urbanization, and a focus on sustainable business practices.

Table of Content

1. Introduction

1.1 Market Definition

1.2 Scope (Inclusion and Exclusions)

1.3 Research Assumptions

2. Executive Summary

2.1 Market Overview

2.2 Regional Synopsis

2.3 Competitive Summary

3. Research Methodology

3.1 Top-Down Approach

3.2 Bottom-up Approach

3.3. Data Validation

3.4 Primary Interviews

4. Market Dynamics Impact Analysis

4.1 Market Driving Factors Analysis

4.1.2 Drivers

4.1.2 Restraints

4.1.3 Opportunities

4.1.4 Challenges

4.2 PESTLE Analysis

4.3 Porter’s Five Forces Model

5. Statistical Insights and Trends Reporting

5.1 Spending & Investment Trends

5.2 Regulatory Compliance Statistics

5.3 AI & Automation Integration

5.4 Employee Participation in CSR Programs

6. Competitive Landscape

6.1 List of Major Companies, By Region

6.2 Market Share Analysis, By Region

6.3 Product Benchmarking

6.3.1 Product specifications and features

6.3.2 Pricing

6.4 Strategic Initiatives

6.4.1 Marketing and promotional activities

6.4.2 Distribution and supply chain strategies

6.4.3 Expansion plans and new product launches

6.4.4 Strategic partnerships and collaborations

6.5 Technological Advancements

6.6 Market Positioning and Branding

7. Corporate Social Responsibility Software Market Segmentation, By Application

7.1 Chapter Overview

7.2 Large Enterprise

7.2.1 Large Enterprise Market Trends Analysis (2020-2032)

7.2.2 Large Enterprise Market Size Estimates and Forecasts to 2032 (USD Million)

7.3 Small & Medium Enterprises

7.3.1 Small & Medium Enterprises Market Trends Analysis (2020-2032)

7.3.2 Small & Medium Enterprises Market Size Estimates and Forecasts to 2032 (USD Million)

8. Corporate Social Responsibility Software Market Segmentation, By Deployment

8.1 Chapter Overview

8.2 On Premise

8.2.1 On Premise Market Trends Analysis (2020-2032)

8.2.2 On Premise Market Size Estimates and Forecasts to 2032 (USD Million)

8.3 Cloud

8.3.1 Cloud Market Trends Analysis (2020-2032)

8.3.2 Cloud Market Size Estimates and Forecasts to 2032 (USD Million)

9. Regional Analysis

9.1 Chapter Overview

9.2 North America

9.2.1 Trends Analysis

9.2.2 North America Corporate Social Responsibility Software Market Estimates and Forecasts, by Country (2020-2032) (USD Million)

9.2.3 North America Corporate Social Responsibility Software Market Estimates and Forecasts, By Application (2020-2032) (USD Million) 

9.2.4 North America Corporate Social Responsibility Software Market Estimates and Forecasts, By Deployment (2020-2032) (USD Million)

9.2.5 USA

9.2.5.1 USA Corporate Social Responsibility Software Market Estimates and Forecasts, By Application (2020-2032) (USD Million)

9.2.5.2 USA Corporate Social Responsibility Software Market Estimates and Forecasts, By Deployment (2020-2032) (USD Million)

9.2.6 Canada

9.2.6.1 Canada Corporate Social Responsibility Software Market Estimates and Forecasts, By Application (2020-2032) (USD Million)

9.2.6.2 Canada Corporate Social Responsibility Software Market Estimates and Forecasts, By Deployment (2020-2032) (USD Million)

9.2.7 Mexico

9.2.7.1 Mexico Corporate Social Responsibility Software Market Estimates and Forecasts, By Application (2020-2032) (USD Million)

9.2.7.2 Mexico Corporate Social Responsibility Software Market Estimates and Forecasts, By Deployment (2020-2032) (USD Million)

9.3 Europe

9.3.1 Eastern Europe

9.3.1.1 Trends Analysis

9.3.1.2 Eastern Europe Corporate Social Responsibility Software Market Estimates and Forecasts, by Country (2020-2032) (USD Million)

9.3.1.3 Eastern Europe Corporate Social Responsibility Software Market Estimates and Forecasts, By Application (2020-2032) (USD Million) 

9.3.1.4 Eastern Europe Corporate Social Responsibility Software Market Estimates and Forecasts, By Deployment (2020-2032) (USD Million)

9.3.1.5 Poland

9.3.1.5.1 Poland Corporate Social Responsibility Software Market Estimates and Forecasts, By Application (2020-2032) (USD Million)

9.3.1.5.2 Poland Corporate Social Responsibility Software Market Estimates and Forecasts, By Deployment (2020-2032) (USD Million)

9.3.1.6 Romania

9.3.1.6.1 Romania Corporate Social Responsibility Software Market Estimates and Forecasts, By Application (2020-2032) (USD Million)

9.3.1.6.2 Romania Corporate Social Responsibility Software Market Estimates and Forecasts, By Deployment (2020-2032) (USD Million)

9.3.1.7 Hungary

9.3.1.7.1 Hungary Corporate Social Responsibility Software Market Estimates and Forecasts, By Application (2020-2032) (USD Million)

9.3.1.7.2 Hungary Corporate Social Responsibility Software Market Estimates and Forecasts, By Deployment (2020-2032) (USD Million)

9.3.1.8 Turkey

9.3.1.8.1 Turkey Corporate Social Responsibility Software Market Estimates and Forecasts, By Application (2020-2032) (USD Million)

9.3.1.8.2 Turkey Corporate Social Responsibility Software Market Estimates and Forecasts, By Deployment (2020-2032) (USD Million)

9.3.1.9 Rest of Eastern Europe

9.3.1.9.1 Rest of Eastern Europe Corporate Social Responsibility Software Market Estimates and Forecasts, By Application (2020-2032) (USD Million)

9.3.1.9.2 Rest of Eastern Europe Corporate Social Responsibility Software Market Estimates and Forecasts, By Deployment (2020-2032) (USD Million)

9.3.2 Western Europe

9.3.2.1 Trends Analysis

9.3.2.2 Western Europe Corporate Social Responsibility Software Market Estimates and Forecasts, by Country (2020-2032) (USD Million)

9.3.2.3 Western Europe Corporate Social Responsibility Software Market Estimates and Forecasts, By Application (2020-2032) (USD Million) 

9.3.2.4 Western Europe Corporate Social Responsibility Software Market Estimates and Forecasts, By Deployment (2020-2032) (USD Million)

9.3.2.5 Germany

9.3.2.5.1 Germany Corporate Social Responsibility Software Market Estimates and Forecasts, By Application (2020-2032) (USD Million)

9.3.2.5.2 Germany Corporate Social Responsibility Software Market Estimates and Forecasts, By Deployment (2020-2032) (USD Million)

9.3.2.6 France

9.3.2.6.1 France Corporate Social Responsibility Software Market Estimates and Forecasts, By Application (2020-2032) (USD Million)

9.3.2.6.2 France Corporate Social Responsibility Software Market Estimates and Forecasts, By Deployment (2020-2032) (USD Million)

9.3.2.7 UK

9.3.2.7.1 UK Corporate Social Responsibility Software Market Estimates and Forecasts, By Application (2020-2032) (USD Million)

9.3.2.7.2 UK Corporate Social Responsibility Software Market Estimates and Forecasts, By Deployment (2020-2032) (USD Million)

9.3.2.8 Italy

9.3.2.8.1 Italy Corporate Social Responsibility Software Market Estimates and Forecasts, By Application (2020-2032) (USD Million)

9.3.2.8.2 Italy Corporate Social Responsibility Software Market Estimates and Forecasts, By Deployment (2020-2032) (USD Million)

9.3.2.9 Spain

9.3.2.9.1 Spain Corporate Social Responsibility Software Market Estimates and Forecasts, By Application (2020-2032) (USD Million)

9.3.2.9.2 Spain Corporate Social Responsibility Software Market Estimates and Forecasts, By Deployment (2020-2032) (USD Million)

9.3.2.10 Netherlands

9.3.2.10.1 Netherlands Corporate Social Responsibility Software Market Estimates and Forecasts, By Application (2020-2032) (USD Million)

9.3.2.10.2 Netherlands Corporate Social Responsibility Software Market Estimates and Forecasts, By Deployment (2020-2032) (USD Million)

9.3.2.11 Switzerland

9.3.2.11.1 Switzerland Corporate Social Responsibility Software Market Estimates and Forecasts, By Application (2020-2032) (USD Million)

9.3.2.11.2 Switzerland Corporate Social Responsibility Software Market Estimates and Forecasts, By Deployment (2020-2032) (USD Million)

9.3.2.12 Austria

9.3.2.12.1 Austria Corporate Social Responsibility Software Market Estimates and Forecasts, By Application (2020-2032) (USD Million)

9.3.2.12.2 Austria Corporate Social Responsibility Software Market Estimates and Forecasts, By Deployment (2020-2032) (USD Million)

9.3.2.13 Rest of Western Europe

9.3.2.13.1 Rest of Western Europe Corporate Social Responsibility Software Market Estimates and Forecasts, By Application (2020-2032) (USD Million)

9.3.2.13.2 Rest of Western Europe Corporate Social Responsibility Software Market Estimates and Forecasts, By Deployment (2020-2032) (USD Million)

9.4 Asia Pacific

9.4.1 Trends Analysis

9.4.2 Asia Pacific Corporate Social Responsibility Software Market Estimates and Forecasts, by Country (2020-2032) (USD Million)

9.4.3 Asia Pacific Corporate Social Responsibility Software Market Estimates and Forecasts, By Application (2020-2032) (USD Million) 

9.4.4 Asia Pacific Corporate Social Responsibility Software Market Estimates and Forecasts, By Deployment (2020-2032) (USD Million)

9.4.5 China

9.4.5.1 China Corporate Social Responsibility Software Market Estimates and Forecasts, By Application (2020-2032) (USD Million)

9.4.5.2 China Corporate Social Responsibility Software Market Estimates and Forecasts, By Deployment (2020-2032) (USD Million)

9.4.6 India

9.4.5.1 India Corporate Social Responsibility Software Market Estimates and Forecasts, By Application (2020-2032) (USD Million)

9.4.5.2 India Corporate Social Responsibility Software Market Estimates and Forecasts, By Deployment (2020-2032) (USD Million)

9.4.5 Japan

9.4.5.1 Japan Corporate Social Responsibility Software Market Estimates and Forecasts, By Application (2020-2032) (USD Million)

9.4.5.2 Japan Corporate Social Responsibility Software Market Estimates and Forecasts, By Deployment (2020-2032) (USD Million)

9.4.6 South Korea

9.4.6.1 South Korea Corporate Social Responsibility Software Market Estimates and Forecasts, By Application (2020-2032) (USD Million)

9.4.6.2 South Korea Corporate Social Responsibility Software Market Estimates and Forecasts, By Deployment (2020-2032) (USD Million)

9.4.7 Vietnam

9.4.7.1 Vietnam Corporate Social Responsibility Software Market Estimates and Forecasts, By Application (2020-2032) (USD Million)

9.2.7.2 Vietnam Corporate Social Responsibility Software Market Estimates and Forecasts, By Deployment (2020-2032) (USD Million)

9.4.8 Singapore

9.4.8.1 Singapore Corporate Social Responsibility Software Market Estimates and Forecasts, By Application (2020-2032) (USD Million)

9.4.8.2 Singapore Corporate Social Responsibility Software Market Estimates and Forecasts, By Deployment (2020-2032) (USD Million)

9.4.9 Australia

9.4.9.1 Australia Corporate Social Responsibility Software Market Estimates and Forecasts, By Application (2020-2032) (USD Million)

9.4.9.2 Australia Corporate Social Responsibility Software Market Estimates and Forecasts, By Deployment (2020-2032) (USD Million)

9.4.10 Rest of Asia Pacific

9.4.10.1 Rest of Asia Pacific Corporate Social Responsibility Software Market Estimates and Forecasts, By Application (2020-2032) (USD Million)

9.4.10.2 Rest of Asia Pacific Corporate Social Responsibility Software Market Estimates and Forecasts, By Deployment (2020-2032) (USD Million)

9.5 Middle East and Africa

9.5.1 Middle East

9.5.1.1 Trends Analysis

9.5.1.2 Middle East Corporate Social Responsibility Software Market Estimates and Forecasts, by Country (2020-2032) (USD Million)

9.5.1.3 Middle East Corporate Social Responsibility Software Market Estimates and Forecasts, By Application (2020-2032) (USD Million) 

9.5.1.4 Middle East Corporate Social Responsibility Software Market Estimates and Forecasts, By Deployment (2020-2032) (USD Million)

9.5.1.5 UAE

9.5.1.5.1 UAE Corporate Social Responsibility Software Market Estimates and Forecasts, By Application (2020-2032) (USD Million)

9.5.1.5.2 UAE Corporate Social Responsibility Software Market Estimates and Forecasts, By Deployment (2020-2032) (USD Million)

9.5.1.6 Egypt

9.5.1.6.1 Egypt Corporate Social Responsibility Software Market Estimates and Forecasts, By Application (2020-2032) (USD Million)

9.5.1.6.2 Egypt Corporate Social Responsibility Software Market Estimates and Forecasts, By Deployment (2020-2032) (USD Million)

9.5.1.7 Saudi Arabia

9.5.1.7.1 Saudi Arabia Corporate Social Responsibility Software Market Estimates and Forecasts, By Application (2020-2032) (USD Million)

9.5.1.7.2 Saudi Arabia Corporate Social Responsibility Software Market Estimates and Forecasts, By Deployment (2020-2032) (USD Million)

9.5.1.8 Qatar

9.5.1.8.1 Qatar Corporate Social Responsibility Software Market Estimates and Forecasts, By Application (2020-2032) (USD Million)

9.5.1.8.2 Qatar Corporate Social Responsibility Software Market Estimates and Forecasts, By Deployment (2020-2032) (USD Million)

9.5.1.9 Rest of Middle East

9.5.1.9.1 Rest of Middle East Corporate Social Responsibility Software Market Estimates and Forecasts, By Application (2020-2032) (USD Million)

9.5.1.9.2 Rest of Middle East Corporate Social Responsibility Software Market Estimates and Forecasts, By Deployment (2020-2032) (USD Million)

9.5.2 Africa

9.5.2.1 Trends Analysis

9.5.2.2 Africa Corporate Social Responsibility Software Market Estimates and Forecasts, by Country (2020-2032) (USD Million)

9.5.2.3 Africa Corporate Social Responsibility Software Market Estimates and Forecasts, By Application (2020-2032) (USD Million) 

9.5.2.4 Africa Corporate Social Responsibility Software Market Estimates and Forecasts, By Deployment (2020-2032) (USD Million)

9.5.2.5 South Africa

9.5.2.5.1 South Africa Corporate Social Responsibility Software Market Estimates and Forecasts, By Application (2020-2032) (USD Million)

9.5.2.5.2 South Africa Corporate Social Responsibility Software Market Estimates and Forecasts, By Deployment (2020-2032) (USD Million)

9.5.2.6 Nigeria

9.5.2.6.1 Nigeria Corporate Social Responsibility Software Market Estimates and Forecasts, By Application (2020-2032) (USD Million)

9.5.2.6.2 Nigeria Corporate Social Responsibility Software Market Estimates and Forecasts, By Deployment (2020-2032) (USD Million)

9.5.2.7 Rest of Africa

9.5.2.7.1 Rest of Africa Corporate Social Responsibility Software Market Estimates and Forecasts, By Application (2020-2032) (USD Million)

9.5.2.7.2 Rest of Africa Corporate Social Responsibility Software Market Estimates and Forecasts, By Deployment (2020-2032) (USD Million)

9.6 Latin America

9.6.1 Trends Analysis

9.6.2 Latin America Corporate Social Responsibility Software Market Estimates and Forecasts, by Country (2020-2032) (USD Million)

9.6.3 Latin America Corporate Social Responsibility Software Market Estimates and Forecasts, By Application (2020-2032) (USD Million) 

9.6.4 Latin America Corporate Social Responsibility Software Market Estimates and Forecasts, By Deployment (2020-2032) (USD Million)

9.6.5 Brazil

9.6.5.1 Brazil Corporate Social Responsibility Software Market Estimates and Forecasts, By Application (2020-2032) (USD Million)

9.6.5.2 Brazil Corporate Social Responsibility Software Market Estimates and Forecasts, By Deployment (2020-2032) (USD Million)

9.6.6 Argentina

9.6.6.1 Argentina Corporate Social Responsibility Software Market Estimates and Forecasts, By Application (2020-2032) (USD Million)

9.6.6.2 Argentina Corporate Social Responsibility Software Market Estimates and Forecasts, By Deployment (2020-2032) (USD Million)

9.6.7 Colombia

9.6.7.1 Colombia Corporate Social Responsibility Software Market Estimates and Forecasts, By Application (2020-2032) (USD Million)

9.6.7.2 Colombia Corporate Social Responsibility Software Market Estimates and Forecasts, By Deployment (2020-2032) (USD Million)

9.6.8 Rest of Latin America

9.6.8.1 Rest of Latin America Corporate Social Responsibility Software Market Estimates and Forecasts, By Application (2020-2032) (USD Million)

9.6.8.2 Rest of Latin America Corporate Social Responsibility Software Market Estimates and Forecasts, By Deployment (2020-2032) (USD Million)

10. Company Profiles

10.1 Benevity, Inc.

10.1.1 Company Overview

10.1.2 Financial

10.1.3 Products/ Services Offered

10.1.4 SWOT Analysis

10.2 Chezuba

10.2.1 Company Overview

10.2.2 Financial

10.2.3 Products/ Services Offered

10.2.4 SWOT Analysis

10.3 Wolters Kluwer N.V.

10.3.1 Company Overview

10.3.2 Financial

10.3.3 Products/ Services Offered

10.3.4 SWOT Analysis

10.4 iPoint-systems gmbh

10.4.1 Company Overview

10.4.2 Financial

10.4.3 Products/ Services Offered

10.4.4 SWOT Analysis

10.5 Blackbaud

10.5.1 Company Overview

10.5.2 Financial

10.5.3 Products/ Services Offered

10.5.4 SWOT Analysis

10.6 Tennaxia

10.6.1 Company Overview

10.6.2 Financial

10.6.3 Products/ Services Offered

10.6.4 SWOT Analysis

10.7 Vee Technologies

10.7.1 Company Overview

10.7.2 Financial

10.7.3 Products/ Services Offered

10.7.4 SWOT Analysis

10.8 NAVEX, Inc.

10.8.1 Company Overview

10.8.2 Financial

10.8.3 Products/ Services Offered

10.8.4 SWOT Analysis

10.9 Salesforce, Inc.

10.9.1 Company Overview

10.9.2 Financial

10.9.3 Products/ Services Offered

10.9.4 SWOT Analysis

10.10 CyberSWIFT Infotech Pvt. Ltd.

10.10.1 Company Overview

10.10.2 Financial

10.10.3 Products/ Services Offered

10.10.4 SWOT Analysis

11. Use Cases and Best Practices

12. Conclusion

An accurate research report requires proper strategizing as well as implementation. There are multiple factors involved in the completion of good and accurate research report and selecting the best methodology to compete the research is the toughest part. Since the research reports we provide play a crucial role in any company’s decision-making process, therefore we at SNS Insider always believe that we should choose the best method which gives us results closer to reality. This allows us to reach at a stage wherein we can provide our clients best and accurate investment to output ratio.

Each report that we prepare takes a timeframe of 350-400 business hours for production. Starting from the selection of titles through a couple of in-depth brain storming session to the final QC process before uploading our titles on our website we dedicate around 350 working hours. The titles are selected based on their current market cap and the foreseen CAGR and growth.


The 5 steps process:

Step 1: Secondary Research:

Secondary Research or Desk Research is as the name suggests is a research process wherein, we collect data through the readily available information. In this process we use various paid and unpaid databases which our team has access to and gather data through the same. This includes examining of listed companies’ annual reports, Journals, SEC filling etc. Apart from this our team has access to various associations across the globe across different industries. Lastly, we have exchange relationships with various university as well as individual libraries.

Secondary Research

Step 2: Primary Research

When we talk about primary research, it is a type of study in which the researchers collect relevant data samples directly, rather than relying on previously collected data.  This type of research is focused on gaining content specific facts that can be sued to solve specific problems. Since the collected data is fresh and first hand therefore it makes the study more accurate and genuine.

We at SNS Insider have divided Primary Research into 2 parts.

Part 1 wherein we interview the KOLs of major players as well as the upcoming ones across various geographic regions. This allows us to have their view over the market scenario and acts as an important tool to come closer to the accurate market numbers. As many as 45 paid and unpaid primary interviews are taken from both the demand and supply side of the industry to make sure we land at an accurate judgement and analysis of the market.

This step involves the triangulation of data wherein our team analyses the interview transcripts, online survey responses and observation of on filed participants. The below mentioned chart should give a better understanding of the part 1 of the primary interview.

Primary Research

Part 2: In this part of primary research the data collected via secondary research and the part 1 of the primary research is validated with the interviews from individual consultants and subject matter experts.

Consultants are those set of people who have at least 12 years of experience and expertise within the industry whereas Subject Matter Experts are those with at least 15 years of experience behind their back within the same space. The data with the help of two main processes i.e., FGDs (Focused Group Discussions) and IDs (Individual Discussions). This gives us a 3rd party nonbiased primary view of the market scenario making it a more dependable one while collation of the data pointers.

Step 3: Data Bank Validation

Once all the information is collected via primary and secondary sources, we run that information for data validation. At our intelligence centre our research heads track a lot of information related to the market which includes the quarterly reports, the daily stock prices, and other relevant information. Our data bank server gets updated every fortnight and that is how the information which we collected using our primary and secondary information is revalidated in real time.

Data Bank Validation

Step 4: QA/QC Process

After all the data collection and validation our team does a final level of quality check and quality assurance to get rid of any unwanted or undesired mistakes. This might include but not limited to getting rid of the any typos, duplication of numbers or missing of any important information. The people involved in this process include technical content writers, research heads and graphics people. Once this process is completed the title gets uploader on our platform for our clients to read it.

Step 5: Final QC/QA Process:

This is the last process and comes when the client has ordered the study. In this process a final QA/QC is done before the study is emailed to the client. Since we believe in giving our clients a good experience of our research studies, therefore, to make sure that we do not lack at our end in any way humanly possible we do a final round of quality check and then dispatch the study to the client.

Key Segments:

By Deployment

    • On Premise

    • Cloud

By Application

    • Large Enterprise

    • Small & Medium Enterprises

Request for Segment Customization as per your Business Requirement: Segment Customization Request

Regional Coverage:

North America

  • US

  • Canada

  • Mexico

Europe

  • Eastern Europe

    • Poland

    • Romania

    • Hungary

    • Turkey

    • Rest of Eastern Europe

  • Western Europe

    • Germany

    • France

    • UK

    • Italy

    • Spain

    • Netherlands

    • Switzerland

    • Austria

    • Rest of Western Europe

Asia Pacific

  • China

  • India

  • Japan

  • South Korea

  • Vietnam

  • Singapore

  • Australia

  • Rest of Asia Pacific

Middle East & Africa

  • Middle East

    • UAE

    • Egypt

    • Saudi Arabia

    • Qatar

    • Rest of Middle East

  • Africa

    • Nigeria

    • South Africa

    • Rest of Africa

Latin America

  • Brazil

  • Argentina

  • Colombia

  • Rest of Latin America

Request for Country Level Research Report: Country Level Customization Request

Available Customization

With the given market data, SNS Insider offers customization as per the company’s specific needs. The following customization options are available for the report:

  • Detailed Volume Analysis

  • Criss-Cross segment analysis (e.g. Product X Application)

  • Competitive Product Benchmarking

  • Geographic Analysis

  • Additional countries in any of the regions

  • Customized Data Representation

  • Detailed analysis and profiling of additional market players


  •            5000 (33% Discount)


  •            8950 (40% Discount)


  •            3050 (23% Discount)

Start a Conversation

Hi! Click one of our member below to chat on Phone