Crude Oil Flow Improvers Market Analysis & Overview:
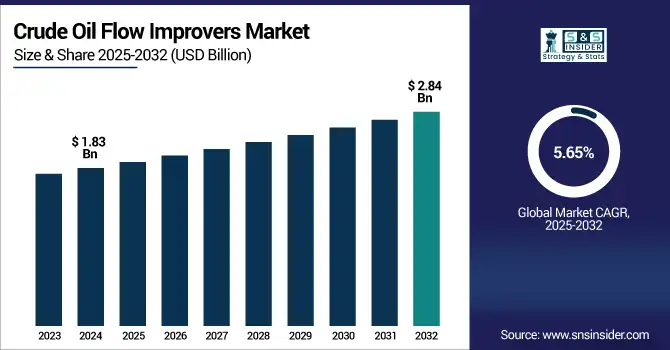
The Crude Oil Flow Improvers Market size was valued at USD 1.83 billion in 2024 and is expected to reach USD 2.84 billion by 2032, growing at a CAGR of 5.65% over the forecast period of 2025-2032.
To Get more information on Crude Oil Flow Improvers Market - Request Free Sample Report
The crude oil flow improvers market analysis indicated an increasing momentum of hydraulic fracturing operations as a key driver for market growth. Hydraulic fracturing (Fracking) has emerged as a primary extraction tool for unconventional oil and gas resources. It is a method where high-pressure fluid is pumped into shale formations to free up hydrocarbons, which helps oil production to increase significantly. On the other hand, the oil produced by fracking consists of waxy or heavy constituents and makes the transport less efficient. In order to deal with this, flow improvers, which include drag-reducing agents and pour point depressants, are implemented to facilitate the flow of crude oils and make pipeline transportation cheaper and more stable, which drives the crude oil flow improvers market growth.
In 2024, according to the EIA, the Permian, Eagle Ford, and Bakken plays have seen a doubling of crude output and tripling of associated gas production.
Crude Oil Flow Improvers Market Dynamics:
Drivers
-
Rapid Rise in Hydraulic Fracturing Activities Drives the Market Growth
Hydraulic fracturing (fracking) has revolutionized oil production around the world, particularly in North America. It allows us to extract from nonconventional reservoirs such as shales that are often high in viscosity, wax, and asphaltenes classes in the crude oil. These properties are impediments to flow through the pipelines, resulting in a loss of the energy unit operation itself and increased transport cost. Drag-reducing agents, pour point depressants, and paraffin inhibitors are crude oil flow improvers that reduce flow resistance and prevent blockages, keeping pipes flowing freely. In an environment where much of the world is using fracking to crank up three various levels of energy independence, the need for quality flow improvers keeps going up, and that makes it an essential market driver.
Restrain
-
Complex Formulation Requirements and High R&D Costs May Hamper the Market Growth
The flow improvers must be tailored according to the different composition of crude oil, different environmental conditions, and different pipeline configurations. Standard solutions simply do not work for heavy, waxy, or sour crudes, which need quite different chemical treatment than light or sweet oils. Specification of custom formulations requires intensive laboratory investigation, field trials, and continual performance testing. This complexity makes research and development expensive, forming a barrier for small and medium-sized manufacturers. And, when customers decide to use any new chemicals, they must then add regulatory approvals to the time and cost equation. This has led to a situation where only a small handful of large players are able to keep up with the pace of change, and many smaller operations may never fully get on board due to cost and a lack of hands-on technical experience.
Opportunities
-
Integration of Smart Dosing Systems and Eco-Friendly Formulations Creates an Opportunity in the Market
The industry is seeing a transition towards the use of smart dosing technologies and green additives. Smart dosing technology, facilitated by IoT and real-time sensors, can automatically regulate the dosage of flow improver depending on varying pipeline pressure, temperature, and flow rate. Not only does this enhance chemical efficiency, but it also lowers the costs of operation and the environmental footprint. Moreover, there is increasing demand for biodegradable and low-toxicity preparations that meet stringent environmental laws, especially in arctic and offshore operations, which drive the crude oil flow improvers market trends.
In January 2023, Clariant launched PHASETREAT WET, an innovative water-external demulsifier for application in both onshore and offshore crude oil production. The product lowers chemical consumption considerably by as much as 75% in reduced demulsifier requirements, yet enhances dehydration and reduces environmental footprint. The launch signifies the focus of the industry on sustainability and effective oil production processes.
Crude Oil Flow Improvers Market Segmentation Analysis:
By Product
Paraffin Inhibitors, the largest crude oil flow improvers market share, around 48%, in 2024. This is due to their significant use in effectively controlling wax deposition problems in crude oil pipelines. Paraffin is a naturally occurring part of many crude oils that tends to solidify and deposit at relatively low temperatures, especially during long-distance transportation and in cooler climates. These wax deposits can decrease capacity, increase pressure, and even create full blockage or a shutdown. Paraffin inhibitors change the form of wax crystals, which helps avoid the adhering of hardened wax to pipeline walls and results in a smoother flow.
Asphaltene Inhibitors held a significant crude oil flow improvers market share. It is due to its increasing application to solve stability problems associated with heavy and sour crude oils. High-molecular-weight constituents in crude oil, asphaltenes, can precipitate with variations of pressure, temperature, or composition, resulting in severe flow assurance issues, such as pipeline, valve, or production equipment plugging. Asphaltene inhibitors stabilize these components in the oil phase, preventing aggregation and deposition from occurring during extraction and transportation.
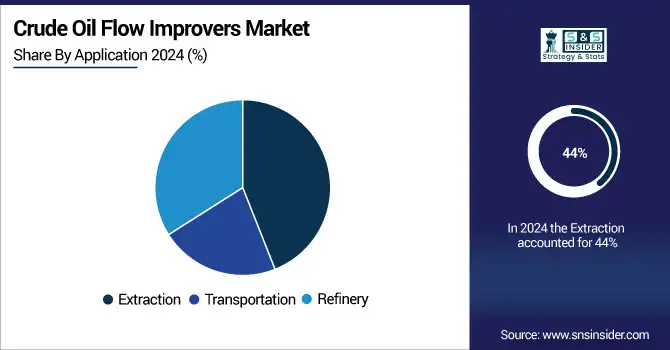
By Application
The extraction segment held the largest market share, around 44%, in 2024. It is due to its significant functional dependence on production at the wellhead to enhance production efficiency among these desired locations. Crude oil, however, can encounter flow assurance problems during extraction, especially in terms of wax crystallization, asphaltene precipitation, and hydrate formation, which then drastically reduce maximum production rates while increasing costs. This is the place where the flow improvers (e.g., paraffin + asphaltene inhibitors) are heavily applied to ensure the efficient flow whenever the flow conditions previously known to provide blockage in wellbores and/or surface equipment. With advanced and mature fields being the imperative for global oil producers, the use of flow-enhancing additives in extraction is now essential, which drives the crude oil flow improvers industry.
Refinery holds a significant market share in the crude oil flow improvers market. This is due to the necessity for refineries to effectively manage and process different crude oil blends. A mixture of light, heavy, and sour crudes is often delivered to refineries, most with high wax or high asphaltene content, which can cause flow problems during storage, blending, and internal transfer. There are several native and introduced flow improvers like drag-reducing agents and dispersants that help to maintain a consistent viscosity of crude oil, avoiding the formation of deposits that can hamper refining efficiency and equipment life. As the world trend of slates toward heavier, more diverse crudes, refineries are relying more heavily on chemical additives to maximize throughputs and minimize the maintenance downtime.
Crude Oil Flow Improvers Market Regional Outlook:
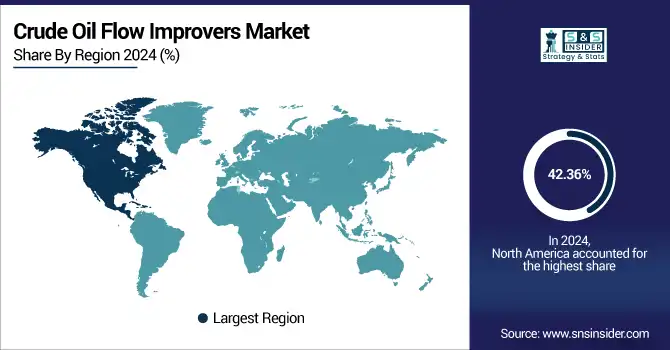
North America crude oil flow improvers market held the largest market share, around 42.36%, in 2024. It is due to relatively mature oil and gas infrastructure, a high volume of crude production, and extensive adoption of other enhanced oil recovery techniques, e.g., hydraulic fracturing. The U.S., for example, is among the top global producers of crude oil; crude output from unconventional resources, such as those in the Permian Basin, is high in wax or heavy in nature, necessitating flow assurance methods. Additionally, the extensive pipeline systems coupled with the extreme winter conditions in the region also mean more need for flow improvers, including pour point depressants and paraffin inhibitors. Furthermore, key market players, the presence of rapidly evolving technology, and recurrent pipeline upgrades and energy efficiency initiatives have further fortified North America as a market for crude oil flow improvers.
The U.S. crude oil flow improvers market size was USD 576.01 million in 2024 and is expected to reach USD 880.94 million by 2032 and grow at a CAGR of 5.45% over the forecast period of 2025-2032. It is because of its robust industrial sector, particularly in the plastic, automotive, and oil & gas industries, where TNPP serves as a secondary antioxidant and stabilizer on a large scale. The U.S. is ahead in the manufacturing and use of high-performance polymers, which need oilfield chemicals, thermal, and oxidative protection in processing and application. Moreover, the nation's sophisticated research facilities and increasing emphasis on polymer development have also catalyzed the use of stabilizers such as TNPP to improve product longevity and meet strict environmental and quality regulations. With new investments in production, packaging technologies, and automotive lightweighting, U.S. demand for TNPP remains strong.
Asia Pacific crude oil flow improvers market held a significant market share and is the fastest-growing segment in the forecast period. This is due to this, the global energy market is now seeing more and more heavy crude oil being extracted and moved from countries such as China, India, and Indonesia that are subject to flow issues like wax deposition and asphaltene precipitation. Crude oil additives, or flow improvers, are being extensively used by oil companies to meet these challenges and improve operational efficiency throughout the region. Flow improvers are further driven in demand due to continuous refinery expansions, increasing offshore exploration, and a high emphasis on reduced transportation losses. Major chemical manufacturers and cost-effective production to significantly support Asia Pacific to maintain its position in the global market.
In May 2024, Songwon launched SONGNOX binary antioxidant blends optimized for mechanically recycled (PCR) polyolefins, further solidifying its net-zero roadmap and circular economy focus.
Europe held a significant market share in the forecast period. It is through its developed oil & gas infrastructure and regulatory standards, as well as the growing demand for transporting and refining various crude oil blends. This regionally significant import of heavy and sour crude oils mainly comes from the Middle East and Russia (before geopolitical change), needing reasonable flow assurance to implement paraffin and asphaltene inhibitors. Moreover, mature pipeline networks and colder climates in Northern and Eastern Europe raise the risk of wax and hydrate formation, further supporting demand for flow improvers. Additionally, the concentration of top chemical manufacturers in conjunction with the high focus on operational efficiency, sustainability, and environmental compliance is supplementing the high adoption of advanced flow improvement technologies in refining and transportation industries spread across the region.
Get Customized Report as per Your Business Requirement - Enquiry Now
Key Players:
The major crude oil flow improvers companies are Halliburton, Schlumberger Limited, BASF SE, Nalco Champion (Ecolab), Baker Hughes, Clariant, Croda International plc, Lubrizol Corporation, Innospec Inc., and Kemira.
Recent Development:
-
In January 2023, Clariant AG introduced eco-friendly demulsifier, PHASETREAT WET, that promises up to 75% reduction in the use of chemical demulsifiers. The technology improves oil–water separation efficiency for onshore and offshore separation operations, and highlights the company’s movement toward sustainable flow improver solutions.
-
In May 2022, Infineum International Limited launched the M8040 additive package for two-stroke marine engines utilizing very low sulfur fuel oil (VLSFO).
| Report Attributes | Details |
|---|---|
| Market Size in 2024 | USD 1.83 Billion |
| Market Size by 2032 | USD 2.84 Billion |
| CAGR | CAGR of 5.65% From 2025 to 2032 |
| Base Year | 2024 |
| Forecast Period | 2025-2032 |
| Historical Data | 2021-2023 |
| Report Scope & Coverage | Market Size, Segments Analysis, Competitive Landscape, Regional Analysis, DROC & SWOT Analysis, Forecast Outlook |
| Key Segments | •By Product ( Paraffin Inhibitors, Asphaltene Inhibitors, Scale Inhibitors, and Hydrate Inhibitors) •By Application (Plastics, Rubber, Oil & Gas, and Others), |
| Regional Analysis/Coverage | North America (US, Canada, Mexico), Europe (Germany, France, UK, Italy, Spain, Poland, Turkey, Rest of Europe), Asia Pacific (China, India, Japan, South Korea, Singapore, Australia, Rest of Asia Pacific), Middle East & Africa (UAE, Saudi Arabia, Qatar, South Africa, Rest of Middle East & Africa), Latin America (Brazil, Argentina, Rest of Latin America) |
| Company Profiles | Halliburton, Schlumberger Limited, BASF SE, Nalco Champion (Ecolab), Baker Hughes, Clariant, Croda International plc, Lubrizol Corporation, Innospec Inc., Kemira. |
Get in Touch
