Curing Agents Market Report Scope & Overview:
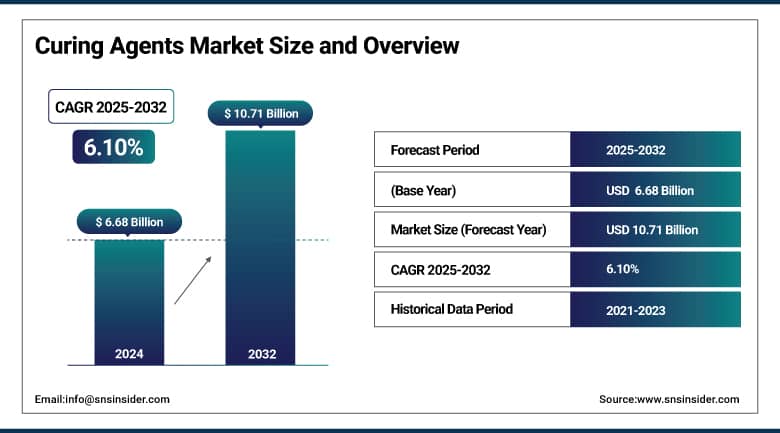
The Curing Agents Market size was valued at USD 6.68 billion in 2024 and is expected to reach USD 10.71 billion by 2032, growing at a CAGR of 6.10% over the forecast period of 2025-2032.
Focus on sustainability, digital control, and processing of advanced composite materials is driving the growth of the market. Low-VOC-based and bio-based industrial curing agents lead the curing agents market, especially in the epoxy curing agent market. The factors, such as UV-curable systems and 3D-printable resins, are the trends that drive the growth of the curing agents industry. According to Hexion, its patented EcoBind resin technology results in an 80%–90% reduction in formaldehyde emissions that is compliant with EPA and CARB regulations.
To Get More Information On Curing Agents Market - Request Free Sample Report
The U.S. Department of Energy previewed projects to reduce the curing of composites by 50%. In ECS 2021, Hexion developed bio-based Versatic acids and safer reactive diluents in accordance with robust curing agents market trends. These developments are enabling the major curing agents industry players to increase the curing agents market size and to have an edge over the other players in the market. Advancements in technology and the evolving regulatory landscape in favor of sustainable and energy-efficient formulations are expected to drive the curing agents market.
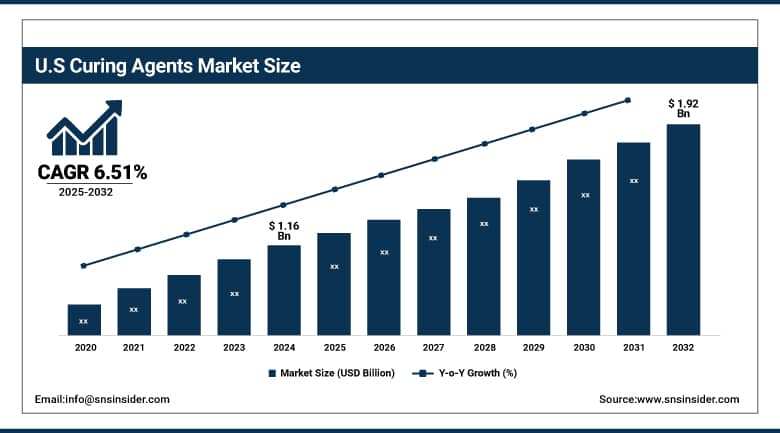
The U.S. led the North American curing agents market with a market size of USD 1.16 billion in 2024 and is projected to reach USD 1.92 billion in 2032 with a CAGR of 6.51%. This dominance is supported by a developed manufacturing sector as well as extensive use of modern curing approaches. EPA 2023 Toxics Release Inventory (TRI) data showed that epoxy and polyurethane curing agents were widely used as part of coatings and adhesives formulations in the U.S. Huntsman and Westlake Corporation have expanded domestic manufacturing, and organizations, such as the American Coatings Association, have lobbied for sustainability standards. This confluence of regulation, innovation, and scale of manufacturing is driving the curing agents market in the country.
Market Dynamics:
Drivers:
-
Digitalization and IoT-enabled Curing Processes Enhance Quality Control and Efficiency
The implementation of curing processes based on IoT systems improves the control and quality in the processing of advanced composite materials. The Department of Energy in the U.S. has been working on projects to cut cure times in half with the help of digital sensors and thermal analytics. These developments are influencing the curing agents market dynamics by enhancing throughput and productivity. Thereby, players in the curing agents market are provided with a competitive advantage, driving the curing agents market growth and increasing the curing agents market share for high-tech applications.
-
Rising Adoption of Advanced Composites Fuels Epoxy Curing Agent Market Growth in Key Sectors
The growing application of lightweight composites in aerospace, wind energy, and automotive is driving the epoxy curing agent market. According to the U.S. Department of Energy, wind turbine blade production was over 14 GW in 2023, which called for high-strength epoxy systems. Curing agents supplied by companies are developing new hardeners for challenging processes. These are the factors that improve the curing agents market share and contribute to the curing agents market size, highlighting an overall growth and demand in a wider remit with the processing scope of advanced composite materials.
Restraints:
-
Complex Regulatory Compliance for Novel Chemistries Raises Development Timelines and Costs
Curing agent innovation is hampered by the need to be compliant with multi-national regulations, such as TSCA and REACH, which lead to longer development times and higher costs. The EPA’s new chemicals program can add a year and a half to development schedules and increase R&D costs by 30%. These obstacles complicate the ability of curing agents companies to rapidly implement bio-based or specialty agents. The regulatory burdens as a result restrain curing agents market trends, slow curing agents market analysis progress, and are an obstacle to curing agents market growth.
Segmentation Analysis:
By Type
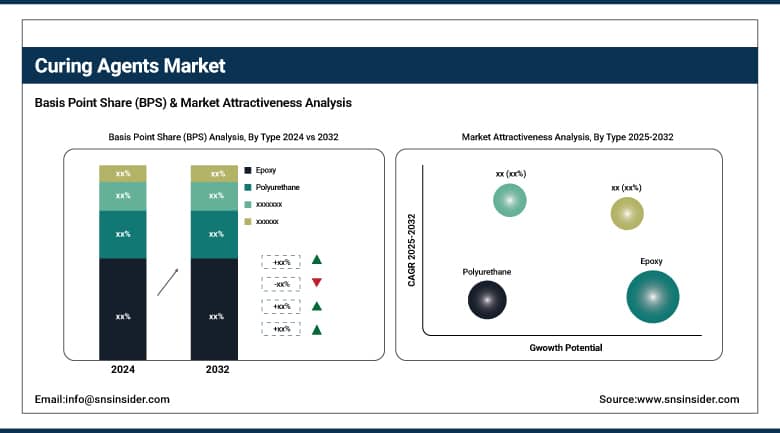
Epoxy curing agents dominated the curing agents market in 2024, accounting for an estimated market share of 47.5%, attributed to their better chemical resistance and bonding strength. Epoxy systems are applied and utilized widely in industrial coatings and the production of high-performance composites, and are popular in the construction and electronics industries. Market competition for curing agents from companies, such as Hexion and Evonik, has resulted in formulation developments that are adapted to meet EPA low-VOC regulations, driving the curing agents market size and strengthening the overall curing agents market globally.
Polyurethane curing agents recorded the fastest growth in 2024, with an estimated CAGR of 6.62%, driven by expanding demand in flexible coatings, adhesives, and elastomers. Such curing systems are becoming increasingly popular in applications for UV-resistant and high-flexibility end-uses. On the other hand, based on the EPA’s TRI reporting, reactor-monomer chemicals, including HDI, showed significantly increased reporting levels, indicating increasing industrial use. These trends showcase a dynamic curing agents market outlook and support vigorous curing agents market growth and adoption.
By End-use
Paints and coatings dominated the curing agents market in 2024, holding an estimated market share of 35.4%, owing to strict environmental regulations and increasing infrastructure development. The growing application scope of protective and decorative coatings for automotive and industrial applications has thrived in the epoxy curing systems. The U.S. EPA and CARB have put laws into place to regulate the emissions of VOCs, which have challenged curing agents companies to develop new engineered products, and have also bolstered curing agents market trends and a well-established curing agents market share in global applications.
Building and construction emerged as the fastest-growing end-use segment in 2024, with an estimated CAGR of 7.04%, due to rising commercial projects and infrastructure activities. The U.S. Green Building Council (USGBC) has seen a dramatic increase in sustainable construction projects, which is driving the need for better curing technology. Higher usage was reported for industrial curing agents used in concrete coatings and bonding applications. These attributes have enhanced the curing agents market in a remarkable way and have changed the curing agents market research globally.
Regional Analysis:
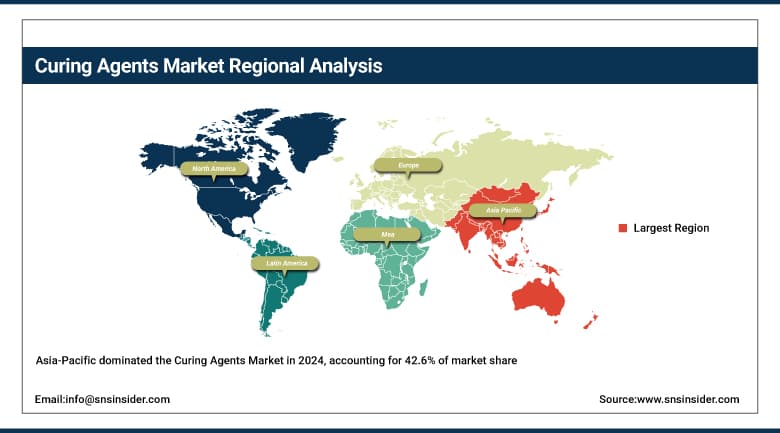
Asia Pacific dominated the curing agents market in 2024 with an estimated market share of 42.6%, and is primarily attributed to massive industrial and infrastructure development. The region was responsible for more than 60% of worldwide chemicals production in 2023 and played a key role in the expansion of epoxy and polyurethane demand in the curing agents market, reports the International Energy Agency (IEA). Government-funded infrastructure projects, such as India’s National Infrastructure Pipeline (NIP) and China’s Made in China 2025 policy, are driving end-use industries such as construction, electronics, and wind energy, which are significant consumers of industrial curing agents and advanced processes for composite materials.
Asia Pacific was dominated by China on account of robust domestic manufacturing, along with favorable incentives from the government to support market demand for epoxy curing agents. In 2023, the Ministry of Industry and Information Technology (MIIT) issued policies that supported the development of high-performance materials in the electric vehicle (EV) and clean energy industry, and both areas involved the use of curing agents. In China, Hexion also grew its curing agents business as a result of local demand, which supported demand at its Shanghai production hub. China dominates global exports of electronics and coatings, which also drives long-term curing agents market share and regional curing agents market growth.
Get Customized Report as Per Your Business Requirement - Enquiry Now
North America emerged as the fastest-growing region with the highest CAGR of 6.78% in the curing agents market in the forecast period of 2025-2032, and the region is expected to offer high-value growth potential in the aerospace, automotive, and renewable energy sectors. In 2023, the U.S. DOE began advanced manufacturing funding, which includes USD 135 million for sustainable composite material development, with a focus where curing agents that are critical. Growing investments in the refurbishment of infrastructure and electric mobility are promoting the curing agents market. Robust R&D, along with stringent environmental concerns, is also compelling curing agents companies to develop low-VOC industrial curing agents.
Key Players:
-
Hexion Inc.
-
Evonik Industries AG
-
Huntsman Corporation
-
Cardolite Corporation
-
Olin Corporation
-
Westlake Epoxy
-
Allnex
-
Kumho P&B Chemicals Inc.
-
Momentive Performance Materials Inc.
-
BYK Additives
Recent Developments:
-
In September 2024, Evonik launched Ancamide 2853 and 2865, nonylphenol-free epoxy curing agents with 20–40% bio-content, offering flexibility, strength, and fast curing for civil flooring and coatings applications.
-
In February 2024, DIC Corporation developed a high heat-resistant epoxy curing agent, tolerating over 200 °C, enhancing performance and durability for applications in high-thermal-stress environments.
| Report Attributes | Details |
|---|---|
| Market Size in 2024 | USD 6.68 billion |
| Market Size by 2032 | USD 10.71 billion |
| CAGR | CAGR of 6.10% From 2025 to 2032 |
| Base Year | 2024 |
| Forecast Period | 2025-2032 |
| Historical Data | 2021-2023 |
| Report Scope & Coverage | Market Size, Segments Analysis, Competitive Landscape, Regional Analysis, DROC & SWOT Analysis, Forecast Outlook |
| Key Segments | •By Type (Epoxy, Polyurethane, Rubber, Acrylic, Others) •By End-use (Paints & coatings, Electrical & electronics, Wind energy, Building & construction, Composites, Adhesives & sealants, Others) |
| Regional Analysis/Coverage | North America (US, Canada, Mexico), Europe (Germany, France, UK, Italy, Spain, Poland, Turkey, Rest of Europe), Asia Pacific (China, India, Japan, South Korea, Singapore, Australia, Rest of Asia Pacific), Middle East & Africa (UAE, Saudi Arabia, Qatar, South Africa, Rest of Middle East & Africa), Latin America (Brazil, Argentina, Rest of Latin America) |
| Company Profiles | Hexion Inc., Evonik Industries AG, Huntsman Corporation, Cardolite Corporation, Olin Corporation, Westlake Epoxy, Allnex, Kumho P&B Chemicals Inc., Momentive Performance Materials Inc., and BYK Additives & Instruments |
Frequently Asked Questions
China dominated the Asia Pacific curing agents market due to high production capacity and government support for advanced materials.
Asia Pacific dominated the curing agents market with a 42.6% share due to large-scale industrialization in countries like China and India.
Paints and coatings led the curing agents market in 2024 with a 35.4% share, driven by industrial and automotive coating demand.
The curing agents market is expected to reach USD 10.71 billion by 2032, driven by demand for sustainable and high-performance formulations.
The curing agents market was valued at USD 6.68 billion in 2024 due to strong demand from coatings and composite applications globally.
Get in Touch
