Business Intelligence (BI) Software Market Size & Overview:
Get more information on Business Intelligence (BI) Software Market - Request Sample Report
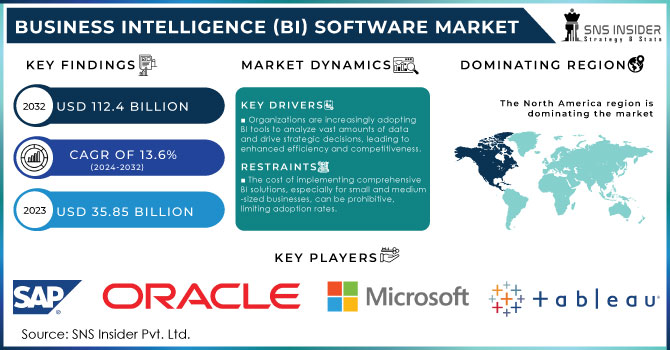
Business Intelligence (BI) software Market size was valued at USD 35.85 billion in 2023 and is expected to grow to USD 112.4 billion by 2032 and grow at a CAGR of 13.6 % over the forecast period of 2024-2032.
The business intelligence software market has seen rapid growth due to increased government initiatives and the need for data-based insight. According to the U.S. Census Bureau, over 72% of businesses with more than 100 employees had implemented BI tools and apps to enhance productivity and efficiency, as well as strategic decision-making as of 2023. The U.S. Government policies supporting digital transformation, for instance, the Indian government pushed the Digital India initiative while the European Union developed the Digital Single Market strategy, mainly increasing the demand for innovative BI software solutions in all sectors. Another reason for the widespread use and fast growth of BI software is the advent of big data, IoT, and AI. The technologies have facilitated the development and proliferation of BI software applications to help companies process vast volumes of data and derive practical insights from them. Cloud computing is also promoting the development of BI solutions, as securely accessing tools remotely from the cloud makes them more affordable for SMEs. Furthermore, the need for increased security as well as the growing number of reporting regulations drives the demand for advanced BI software in sectors such as healthcare, banking, and retail. As a result, BI software companies will benefit from the global tendency to democratize data and ensure access to streaming analytics, which will trigger the further development of BI solutions and increased demand for them across sectors.
One of the characteristics of modern BI tools and apps is the use of AI and machine learning to provide advanced analytics, including predictive and prescriptive analytics to help companies forecast future trends and outcomes. For example, in June 2024, Databricks released an AI-powered BI product with interactive dashboards and a conversational tool called Genie to promote data-driven decision-making throughout organizations. In addition, companies benefit from cloud-based BI apps because they are cost-effective, can be easily accessed globally, and are low-dev and easily scalable. It is especially advantageous for small and medium enterprises because they do not need to invest in heavy infrastructure to access and analyze data.
Business Intelligence (BI) software Market Dynamics
Drivers
-
Organizations are increasingly adopting BI tools to analyze vast amounts of data and drive strategic decisions, leading to enhanced efficiency and competitiveness.
-
Cloud-based BI tools offer scalability, reduced upfront costs, and enhanced accessibility, making them increasingly popular among businesses of all sizes.
-
BI software is leveraging AI and ML capabilities to automate data analysis, predictive modeling, and trend forecasting, which enhances the value and usability of BI tools.
-
Companies seek real-time insights to stay agile in competitive markets, prompting the adoption of BI software that provides instant data processing and visualization.
One of the key growth drivers of the business intelligence software market is the increasing demand for data-driven decision-making. Thus, organizations across all spheres realize the benefits of using data analytics for strategic decision-making, operational efficiency, and enhanced customer satisfaction. As Per the recent survey conducted about 70% of organizations have already had or will have data and analytics as the primary driver of business strategy. For example, companies like Netflix and Amazon utilize sophisticated BI tools to analyze customer behavior and preferences, enabling them to offer personalized recommendations and improve user experience. In the retail sphere, Walmart is a proponent of BI's analytical solution application in analyzing the purchase patterns of its customers. As a result, the company is effective in managing the inventory stock which is vital for reducing expenses significantly.
Similarly, a recent study stated that organizations using Business Intelligence tools are five times more likely to make faster decisions than their competitors. One of the critical changes occurring nowadays is the growing transition to data-driven solutions concerning decision-making whether it is in favor of business or customers. Moreover, as can be seen from the previous example of Walmart, these solutions can be quite innovative.
Restraints:
-
The cost of implementing comprehensive BI solutions, especially for small and medium-sized businesses, can be prohibitive, limiting adoption rates.
-
With increasing volumes of sensitive data being analyzed, companies face significant challenges in ensuring data protection and regulatory compliance, impacting wider adoption.
-
Integrating data from multiple sources into a cohesive BI system remains a challenge, as different data formats and legacy systems can create bottlenecks in implementation.
Complexity in data integration is one major restraining factor in the business intelligence software market. Data may come from many sources due to the proliferation of legacy systems, cloud applications, and other databases. Each form of data may have a wholly different form of format, structure, or protocol. The data sources are then converted into a data warehouse/BI tool, which sometimes can create data silos. The integration process requires technical knowledge and continued support, which can be very hard for companies that do not have in-house software teams with the right skill set.
A lack of understanding is also an issue, which can result in the wrong data integration software being purchased. If the company realizes that the software they have purchased can’t cater to their needs then it is normally too late to turn back, leading to higher costs and prolonged periods to allow consultants to integrate the software. This complexity not only slows down the adoption of BI solutions but can also lead to incomplete or inaccurate insights, ultimately undermining the effectiveness of BI initiatives. Addressing these integration challenges is crucial for organizations looking to leverage data effectively.
Business Intelligence (BI) software Market Segment analysis
By BI Technology
Cloud BI technology established its market dominance in 2023, with the cloud type accounting for a 51% share. This has mostly been caused by the scalability, flexibility, and affordability of cloud-oriented solutions. Governments from different countries choose to proceed with a cloud-first policy. For example, the U.S. government embraces the Cloud Smart approach which is aimed at increasing cloud investments and accelerating cloud adoption among federal agencies. However, it is only necessary that more than 60% of federal agencies are in different stages of transitioning to cloud platforms, which also impacts the growing demand for cloud BI-oriented tools. A change to cloud BI technology is also caused by the necessity of remote work that was triggered. This shift is strongly supported by the expansion of 5G networks that increases overall data transmission and also specifically affects the transmission speed of additional geospatial analytics processing and cloud BI-oriented tools.
By Enterprise Size
Large enterprises accounted for the largest market share in the BI software market in 2023. According to the U.S. Bureau of Labor Statistics, more than 70% of large enterprises in the U.S. only use BI tools. Such software solutions allow the company to better organize the work of its departments, increase the number of opportunities for customer interaction, and strengthen competitive intelligence. Large corporations have more data stored, making them need comprehensive solutions for BI that could help analyze processes in the company analytics and provide data-driven decision-making on a massive scale. In addition, big business is subject to strict sectoral regulation and standardized reporting, especially in the fields of healthcare, BFSI, and manufacturing where data is typically collected on a large scale. According to the experts, large enterprises can implement full BI programs more successfully and combine them with predictive analytics, artificial intelligence, and machine learning tools. Legal regulations, such as the GDPR in the EU, also contributed to the increase in the demand for BI software compliance tools in the field of data management and control of possible risks in all areas, increasing their demand among large enterprises.
By End-Use
In 2023, the Banking, Financial Services, and Insurance segment held the largest market share in the BI software market. According to government statistics, which were published by the Reserve Bank of India, more than 65% of financial institutions in India have already deployed BI tools to improve fraud detection, and management, risk management, and customer service. The demand for BI solutions is being fueled by the need for the financial sector to use data analytics to track transactions, predict trends in the market, and meet regulatory compliance. Additionally, the need to curb increasingly rampant money laundering incidences through tightened laws such as the AML has also called for enhanced BI adoption since financial products are becoming very complex and require comprehensive data management to properly cater to their complexity. Governments of developed countries are some of the largest driving forces behind the demand for BI, where they have been passing robust new financial laws. An example in the United States is the Dodd-Frank Act, which calls for banks in the U.S. and other types of financial institutions to invest in BI to comply with the new law and maintain their current operations. In Europe, MIFID II, which is similar to the Dodd-Frank Act, also aims to boost the European BI market.
Regional Analysis
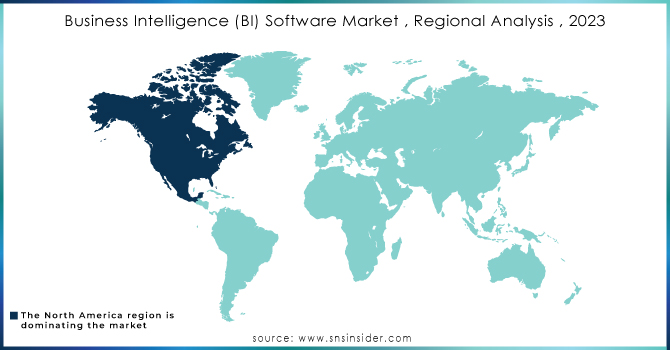
In 2023, North America dominated the BI software market in 2023. The early technology adoption and high BI infrastructure investments by large industry giants sustain North America’s position. The BI software accounted for 36% of the global market share. The prominent presence of some of the major technology corporations is one of the key drivers of BI adoption in the North American region. Supporting initiatives such as the U.S. Digital Service’s purpose focuses on improving the federal government’s technology and data effectiveness. The region’s mature IT infrastructure and the progressive nature of investment have sustained its dominance as a leader in the BI software market.
On the other hand, from 2024–2032, the Asia-Pacific region will experience the highest compound annual growth rate. According to the National Bureau of Statistics of China, the Chinese BI software market saw a significant growth rate in 2023, one of the highest in the region. Driven by the rapid digital adoption across businesses and the government’s direction to lead globally in AI and Big Data technologies, the BI market has witnessed immense growth. Furthermore, the region’s substantial investments in cloud computing and 5G infrastructure in countries such as India, Japan, and South Korea, among others, have significantly promoted the uptake of BI technologies across Asia.
Need any customization research/data on Business Intelligence (BI) Software Market - Enquiry Now
Key Players
Key Service Providers or Manufacturers:
-
Tableau Software (Tableau Desktop, Tableau Server)
-
Microsoft (Power BI, Azure Synapse Analytics)
-
SAP (SAP BusinessObjects, SAP Analytics Cloud)
-
Qlik (Qlik Sense, QlikView)
-
IBM (IBM Cognos Analytics, IBM Watson Analytics)
-
Oracle (Oracle BI Cloud, Oracle Analytics Server)
-
Sisense (Sisense Fusion, Sisense for Cloud Data Teams)
-
MicroStrategy (MicroStrategy Analytics, MicroStrategy Cloud)
-
Domo (Domo Business Cloud, Domo Data Apps)
-
TIBCO Software (TIBCO Spotfire, TIBCO Jaspersoft)
Users of BI Services and Products:
-
Marriott International
-
Hilton Worldwide
-
Accor Hotels
-
InterContinental Hotels Group (IHG)
-
Wyndham Hotels & Resorts
-
Choice Hotels
-
Best Western Hotels & Resorts
-
Radisson Hotel Group
-
Hyatt Hotels Corporation
-
Four Seasons Hotels and Resorts
Recent Developments
-
August 2024, Power BI Integration with Azure OpenAI Service As part of the improvements to its BI solution, Microsoft announced the integration of Power BI with Azure OpenAI Service. As a result, the users will be able to employ AI for smarter interpretation and generation of insights on their data. The integration of the services will bring more value to Power BI as a tool for business users.
-
MDO Rebranding and Introduction of the IntelliSight Model. In February 2024, the MyDigitalOofffice was re-branded into Otelier and launched IntelliSight, a Unified Business Intelligence Platform. With the help of the new solution, the hotelier will be able to retrieve the cross-functional data for insights and analysis and, consequently, make data-driven decisions improving the efficiency and effectiveness of the operations.
-
Introduction of Tableau’s AI Features for Democratization of Data In June 2024, Tableau implemented the introduction of AI features on its platform as part of the initiatives targeting the democratization of data access across businesses. These new features improve the accessibility of data analysis and insights for non-technical users and, in such a way, support enhanced data literacy in organizations.
| Report Attributes | Details |
| Market Size in 2023 |
USD 35.85 billion |
| Market Size by 2032 |
USD 112.4 billion |
| CAGR |
CAGR of 13.6% From 2024 to 2032 |
| Base Year |
2023 |
| Forecast Period |
2024-2032 |
| Historical Data |
2020-2022 |
| Report Scope & Coverage |
Market Size, Segments Analysis, Competitive Landscape, Regional Analysis, DROC & SWOT Analysis, Forecast Outlook |
| Key Segments |
• By Technology (Cloud Business Intelligence, Mobile Business Intelligence, Social Business Intelligence) • By Enterprise Size (Large Enterprises and Small & Medium Enterprises) |
| Regional Analysis/Coverage | North America (US, Canada, Mexico), Europe (Eastern Europe [Poland, Romania, Hungary, Turkey, Rest of Eastern Europe] Western Europe] Germany, France, UK, Italy, Spain, Netherlands, Switzerland, Austria, Rest of Western Europe]), Asia Pacific (China, India, Japan, South Korea, Vietnam, Singapore, Australia, Rest of Asia Pacific), Middle East & Africa (Middle East [UAE, Egypt, Saudi Arabia, Qatar, Rest of Middle East], Africa [Nigeria, South Africa, Rest of Africa], Latin America (Brazil, Argentina, Colombia, Rest of Latin America) |
| Company Profiles |
Tableau Software, Microsoft, SAP, Qlik, IBM, Oracle, Sisense, MicroStrategy, Domo, TIBCO Software |
| Key Drivers |
• Organizations are increasingly adopting BI tools to analyze vast amounts of data and drive strategic decisions, leading to enhanced efficiency and competitiveness. |
| Market Challenges |
• The cost of implementing comprehensive BI solutions, especially for small and medium-sized businesses, can be prohibitive, limiting adoption rates. |
Get in Touch
