Design Collaboration Software Market Report Scope & Overview:
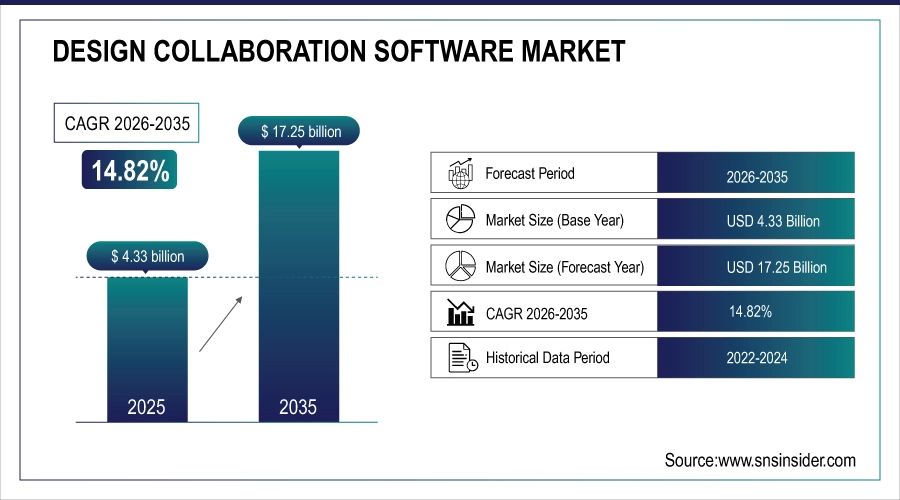
The Design Collaboration Software Market was valued at USD 4.33 billion in 2025 and is expected to reach USD 17.25 billion by 2035, growing at a CAGR of 14.82% from 2026-2035.
The growth of the Design Collaboration Software Market is driven by the increasing demand for real-time, cloud-based collaboration tools that enhance team productivity, streamline workflows, and reduce time-to-market for design projects. Industries such as architecture, engineering, construction, and product design are rapidly adopting digital tools to enable remote work, centralized data access, and improved communication across teams. The rising integration of AI, AR/VR, and BIM (Building Information Modeling) technologies in design software is also accelerating adoption.
A Massachusetts DOT study (2022–2023) found that implementing BIM significantly reduced unbudgeted change orders, enhanced collaboration, and boosted overall efficiency in the AEC and operations sectors.
Design Collaboration Software Market Size and Forecast
-
Market Size in 2025: USD 4.33 Billion
-
Market Size by 2035: USD 17.25 Billion
-
CAGR: 14.82% from 2026 to 2035
-
Base Year: 2025
-
Forecast Period: 2026–2035
-
Historical Data: 2022–2024
To Get more information on Design Collaboration Software Market - Request Free Sample Report
Design Collaboration Software Market Trends
-
Rising demand for remote design collaboration and real-time project coordination is driving the design collaboration software market.
-
Growing adoption in architecture, engineering, construction (AEC), and product development sectors is boosting market growth.
-
Expansion of cloud-based platforms and integration with CAD and PLM systems is fueling deployment.
-
Increasing focus on version control, workflow optimization, and multi-stakeholder collaboration is shaping adoption trends.
-
Advancements in 3D visualization, virtual reality, and AI-assisted design are enhancing productivity and accuracy.
-
Rising need for cost-effective, scalable, and secure design solutions is supporting market expansion.
-
Collaborations between software providers, design firms, and technology integrators are accelerating innovation and global adoption.
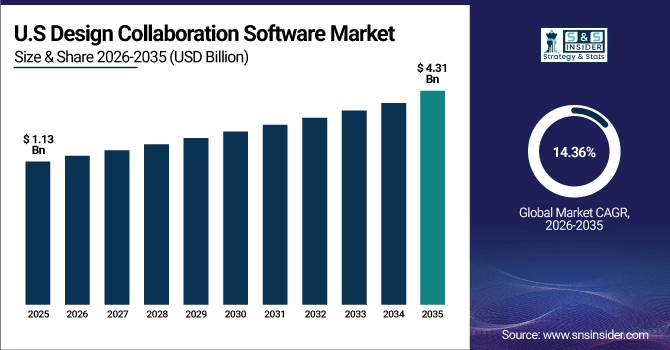
U.S. Design Collaboration Software Market was valued at USD 1.13 billion in 2025 and is expected to reach USD 4.31 billion by 2035, growing at a CAGR of 14.36% from 2026-2035.
The U.S. Design Collaboration Software Market is growing due to rising demand for remote work tools, increasing adoption of cloud-based platforms, digital transformation across AEC and creative industries, and strong investments in innovation, AI integration, and collaborative design technologies.
Design Collaboration Software Market Growth Drivers
-
Rising integration of AI-driven automation improving real-time collaboration, design accuracy, and overall workflow efficiency for global design teams
The integration of AI-powered features such as automated error detection, predictive design suggestions, and smart version management is transforming design collaboration. These tools enable faster decision-making by providing real-time insights and ensuring design accuracy, reducing costly revisions. AI-driven automation also enhances cross-functional communication, making complex projects more manageable. By automating repetitive tasks, design teams can focus on creativity and problem-solving. Moreover, AI tools help maintain consistent design standards across global teams, aligning outputs with client requirements. This growing AI adoption is propelling demand for advanced collaboration platforms, positioning them as indispensable assets for competitive, quality-driven design environments.
-
A Salesforce study reports that global AI usage for creative and strategic tasks rose by 154%, while daily AI use increased by 233% over six months. Workers using AI daily saw productivity rise by 64%, focus by 58%, and job satisfaction by 81%.
-
Additionally, businesses implementing AI-driven workflow automation witnessed up to 4.8× productivity improvements, 49% fewer errors, and ROI ranges of 30%–200% within the first year.
Design Collaboration Software Market Restraints:
-
High initial implementation costs and subscription expenses limiting adoption among small and medium-sized enterprises in price-sensitive markets
The significant upfront investment required for premium design collaboration platforms poses a challenge for small and medium-sized enterprises. Licensing fees, cloud storage costs, and integration expenses with existing systems can be prohibitive, especially in developing economies. Many SMEs opt for free or lower-cost alternatives, sacrificing advanced features such as AI integration, 3D visualization, or extensive security protocols. Additionally, recurring subscription costs strain budgets over time, making long-term adoption less feasible. This price barrier slows market penetration in emerging regions, where budget constraints often outweigh the operational benefits of adopting fully integrated, high-performance design collaboration solutions.
Design Collaboration Software Market Opportunities
-
Rising adoption of immersive technologies like AR and VR enhancing interactive design collaboration and client engagement across industries
The integration of augmented reality (AR) and virtual reality (VR) into design collaboration software offers new ways for teams and clients to interact with projects. These technologies enable immersive visualization, allowing stakeholders to experience designs in real-world contexts before finalization. This reduces errors, accelerates approval cycles, and improves client satisfaction. Industries like construction, automotive, and interior design are particularly benefiting from these advancements. By enabling interactive presentations and spatial understanding, AR/VR-enhanced collaboration tools are gaining traction, opening revenue streams for software providers and offering competitive differentiation in the evolving digital design landscape.
-
In architecture, 63% of firms have already implemented AR technologies in their workflows, and 75% believe AR facilitates design review. Adoption is projected to increase—87% expect AR to become integral to their design process within five years, while 42% say it improves project delivery efficiency and 79% report enhanced client presentations.
Design Collaboration Software Market Challenges
-
Limited internet connectivity and infrastructure in emerging regions restricting full functionality of cloud-based design collaboration solutions
In many developing markets, inadequate internet speed, unstable connectivity, and limited cloud infrastructure hinder the performance of design collaboration tools. Cloud-based platforms require consistent, high-bandwidth access for real-time updates, 3D rendering, and seamless file sharing, which may not be feasible in rural or underserved areas. These limitations force organizations to rely on offline or hybrid systems, reducing collaboration efficiency and eliminating certain advanced features. This infrastructure gap creates uneven adoption rates globally, with providers needing to develop lightweight, offline-compatible solutions to penetrate regions where digital infrastructure remains a significant barrier to advanced design collaboration adoption.
Design Collaboration Software Market Segment Analysis
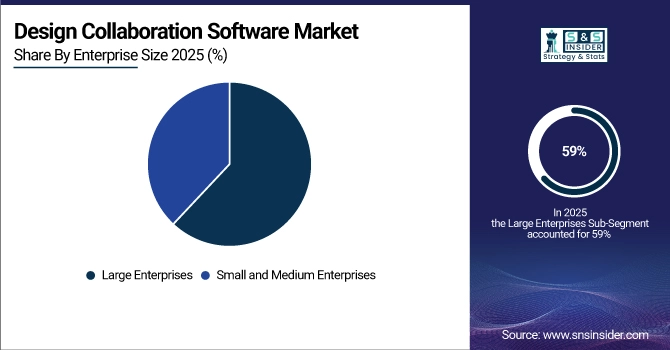
By Enterprise Size
Large enterprises held the largest revenue share of about 59% in 2025 due to their capacity to invest in advanced, scalable, and secure collaboration platforms. These organizations manage complex, multi-location projects requiring integration with other enterprise systems. They prioritize premium solutions with high-level security, customization, and real-time collaboration features to improve productivity, coordination, and innovation, ensuring strong adoption and sustained market dominance across multiple industries and global operational networks.
Small and medium enterprises are expected to grow at the fastest CAGR of about 15.84% from 2026-2035, driven by increasing accessibility of affordable, cloud-based collaboration tools. Subscription-based pricing models and easy deployment allow SMEs to compete effectively with larger firms. Enhanced workflow efficiency, support for remote work, and rising digital transformation initiatives, particularly in emerging markets, are accelerating adoption. This creates significant growth opportunities, positioning SMEs as a rapidly expanding segment in the market.
By End-User
The BFSI sector accounted for the largest revenue share of about 23% in 2025 due to its high dependence on secure, real-time collaboration for compliance documentation, product development, and client communications. The industry demands robust security, version control, and multi-stakeholder coordination across geographies. Adoption is further driven by integration with analytics and workflow automation, enabling faster decision-making, operational efficiency, and risk reduction, solidifying BFSI’s leadership in the design collaboration software market globally.
Healthcare is projected to grow at the fastest CAGR of about 17.37% from 2026-2035, fueled by increasing adoption of collaboration platforms for medical device design, telemedicine solutions, and facility planning. The industry’s focus on accuracy, regulatory compliance, and secure data sharing drives demand. Cross-disciplinary collaboration between researchers, clinicians, and engineers, especially in global projects, is boosting adoption, making healthcare one of the most dynamic growth areas for design collaboration tools.
By Application
Graphic design led the market with about 21% revenue share in 2025 due to constant demand for asset creation, real-time feedback, and streamlined approval workflows. Agencies, marketing teams, and freelancers heavily rely on collaborative tools for faster project delivery and enhanced client engagement. Integration with AI-assisted design, cloud storage, and cross-platform compatibility continues to strengthen this segment’s leadership position in the design collaboration software industry worldwide.
Architecture is expected to grow at the fastest CAGR of about 17.85% from 2026-2035, driven by increased adoption of BIM integration, 3D visualization, and real-time project collaboration. These tools enable architects, engineers, and stakeholders to work simultaneously, reducing errors and improving timelines. Growing urbanization, infrastructure projects, and sustainability-focused designs are driving demand, with immersive AR/VR capabilities further accelerating adoption in architectural workflows across global markets.
By Deployment Mode
Cloud segment dominated the Design Collaboration Software Market with the highest revenue share of about 61% in 2025 and is expected to grow at the fastest CAGR of about 15.83% from 2026-2035. Its dominance is driven by scalability, cost-effectiveness, and easy accessibility for distributed teams. The ability to support real-time collaboration, integrate with multiple design tools, and ensure seamless updates boosts adoption. Growing remote work trends, demand for cross-platform compatibility, and reduced infrastructure costs are further accelerating its growth, making cloud deployment the preferred choice across industries globally.
Design Collaboration Software Market Regional Analysis
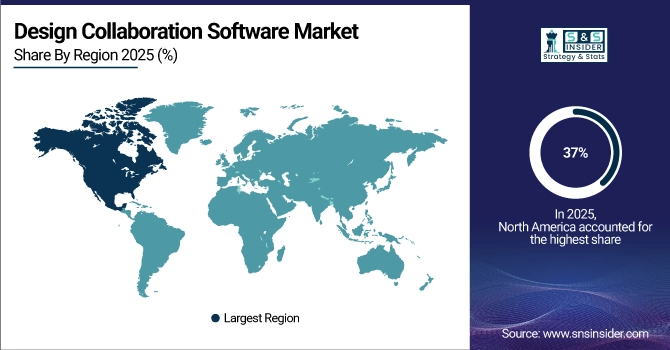
North America Design Collaboration Software Market Insights
North America dominated the Design Collaboration Software Market with about 37% revenue share in 2025 due to its advanced digital infrastructure, high adoption of cloud technologies, and strong presence of leading software providers. The region’s mature industries, emphasis on innovation, and early adoption of AI-driven collaboration tools further strengthen its leadership. Significant investments in R&D and enterprise digital transformation initiatives continue to drive extensive platform usage across multiple sectors.
The United States is dominating the Design Collaboration Software Market in North America, driven by advanced digital infrastructure, high enterprise adoption, and strong presence of leading software vendors.
Get Customized Report as per Your Business Requirement - Enquiry Now
Asia Pacific Design Collaboration Software Market Insights
Asia Pacific is projected to grow at the fastest CAGR of about 17.35% from 2026-2035, fueled by rapid industrialization, expanding SME sector, and increasing demand for cost-effective, cloud-based design tools. Rising digital adoption in countries like China, India, and Southeast Asia, along with government initiatives supporting digital transformation, boosts adoption. The region’s growing talent pool and focus on global outsourcing further accelerate the need for advanced collaborative design platforms.
China is dominating the Design Collaboration Software Market in Asia Pacific, driven by rapid digitalization, large manufacturing sector, and strong government support for technology adoption.
Europe Design Collaboration Software Market Insights
Europe’s Design Collaboration Software Market is growing steadily, supported by strong industrial sectors, increasing adoption of cloud-based solutions, and rising demand for cross-border collaboration, with Germany, the UK, and France driving significant market share through advanced technology integration.
Germany is dominating the Design Collaboration Software Market in Europe, supported by strong industrial base, advanced technology adoption, and significant investments in digital transformation initiatives.
Middle East & Africa and Latin America Design Collaboration Software Market Insights
In the Design Collaboration Software Market, the Middle East & Africa are experiencing steady growth driven by digital transformation initiatives, while Latin America is expanding due to increasing SME adoption, rising cloud deployment, and growing demand for cost-effective collaborative design solutions.
Design Collaboration Software Market Competitive Landscape:
Adobe
Adobe provides enterprise-grade creative and content collaboration platforms, unifying project, asset, and workflow management for design, marketing, and content teams. Its solutions integrate generative AI, cloud-based collaboration, and third-party tools like Microsoft and Google to streamline creation, review, and distribution. Adobe’s platforms support real-time teamwork, co-design, and multi-channel publishing, enabling organizations to accelerate project timelines, maintain brand consistency, and enhance creativity across global teams and partner networks.
-
2024: Adobe introduced Express enterprise collaboration features, enabling co-design of branded content with generative AI and integrations with Slack, Google Drive, and more.
-
2025: Adobe expanded GenStudio, unifying project, asset, and workflow visibility across teams and partners including Microsoft and Google.
Autodesk, Inc.
Autodesk delivers cloud-based solutions connecting design, engineering, and manufacturing workflows for collaborative innovation. Its platforms enable real-time design sharing, AI-assisted workflows, and integrated project management across distributed teams. Autodesk tools support end-to-end collaboration from concept to production, allowing organizations to optimize design efficiency, reduce errors, and accelerate product development. Continuous updates and industry insights strengthen cloud adoption and team-centric innovation in architecture, manufacturing, and product design sectors.
-
2024: Autodesk launched Informed Design, a cloud solution connecting design and manufacturing workflows for collaborative cloud-based projects.
Figma, Inc.
Figma is a cloud-based collaborative design platform enabling teams to create, prototype, and iterate in real time. Its tools support cross-functional workflows, AI-driven design assistance, and seamless sharing for design, product, and engineering teams. Figma’s platform emphasizes teamwork, rapid iteration, and scalability, allowing global teams to co-develop interfaces, websites, and digital products efficiently while maintaining version control, accessibility, and interactive collaboration in a single cloud workspace.
-
2025: At Config 2025, Figma unveiled Figma Make, Figma Sites, and AI-driven workflows, enhancing team collaboration and rapid product iteration.
-
2025: Figma’s updates continued to enhance real-time collaborative design, prototyping, and team workflow features across its cloud platform.
Key Players
-
Adobe
-
Google
-
Microsoft
-
Slack
-
Zoom
-
Figma, Inc.
-
Trimble Inc.
-
Graphisoft SE
-
Bentley Systems, Inc.
-
Dassault Systèmes SE
-
PTC Inc.
-
Canva Pty Ltd.
-
Nemetschek Group
-
InVisionApp, Inc.
-
Bluebeam, Inc. (a Nemetschek brand)
-
ZWSOFT Co., Ltd.
-
Bricsys NV
| Report Attributes | Details |
|---|---|
| Market Size in 2025 | USD 4.33 Billion |
| Market Size by 2035 | USD 17.25 Billion |
| CAGR | CAGR of 14.82% From 2026 to 2035 |
| Base Year | 2025 |
| Forecast Period | 2026-2035 |
| Historical Data | 2022-2024 |
| Report Scope & Coverage | Market Size, Segments Analysis, Competitive Landscape, Regional Analysis, DROC & SWOT Analysis, Forecast Outlook |
| Key Segments | • By Deployment Mode (On-Premises, Cloud) • By Enterprise Size (Small and Medium Enterprises, Large Enterprises) • By Application (Architecture, Engineering, Construction, Graphic Design, Product Design, Others) • By End-User (BFSI, Healthcare, Retail, Media and Entertainment, Manufacturing, IT and Telecommunications, Others) |
| Regional Analysis/Coverage | North America (US, Canada), Europe (Germany, UK, France, Italy, Spain, Russia, Poland, Rest of Europe), Asia Pacific (China, India, Japan, South Korea, Australia, ASEAN Countries, Rest of Asia Pacific), Middle East & Africa (UAE, Saudi Arabia, Qatar, South Africa, Rest of Middle East & Africa), Latin America (Brazil, Argentina, Mexico, Colombia, Rest of Latin America). |
| Company Profiles | Adobe, Google, Microsoft, Slack, Zoom, Autodesk, Inc., Figma, Inc., Trimble Inc., Graphisoft SE, Bentley Systems, Inc., Dassault Systèmes SE, PTC Inc., Corel Corporation, Canva Pty Ltd., Nemetschek Group, InVisionApp, Inc., Bluebeam, Inc. (a Nemetschek brand), ZWSOFT Co., Ltd., Bricsys NV (part of Hexagon AB) |
Frequently Asked Questions
Ans: The Design Collaboration Software Market is expected to grow at a CAGR of about 14.82% during the forecast period 2026–2035.
Ans: The Design Collaboration Software Market was valued at approximately USD 4.33 billion in 2025, with strong demand across multiple industry sectors globally.
Ans: Increasing adoption of real-time, cloud-based collaboration tools enhancing productivity, workflow efficiency, and cross-functional design communication is the key growth driver.
Ans: The cloud deployment segment dominated with a 61% revenue share in 2025 and is expected to grow fastest at a CAGR of 15.83%.
Ans: North America dominated with about 37% revenue share in 2025, driven by advanced digital infrastructure and strong technology adoption rates.
Get in Touch
