Payment Gateway Market Report Scope & Overview:
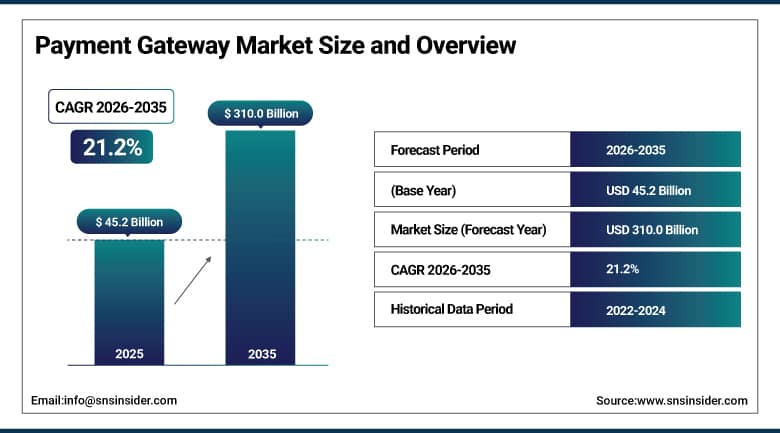
The Payment Gateway Market was valued at USD 45.2 billion in 2025 and is expected to reach USD 310.0 billion by 2035, growing at a CAGR of 21.2% from 2026–2035.
payment gateway market is experiencing one of the most explosive growth trajectories in the global fintech ecosystem, driven by the convergence of multiple structural forces: the accelerating shift of commerce to digital and mobile channels, the rapid expansion of e-commerce in emerging economies, rising consumer demand for frictionless real-time payment experiences, and the integration of advanced AI-driven fraud detection, blockchain-based security, and API-first architecture into modern payment infrastructure. Payment gateways have evolved far beyond simple transaction processing - they now serve as comprehensive digital commerce enablers, supporting multi-currency acceptance, one-click checkout, subscription billing, embedded finance, Buy Now Pay Later (BNPL) integration, and unified omnichannel payment orchestration. The proliferation of smartphones, expanding internet infrastructure in developing economies, and strong government-led cashless economy initiatives across Asia Pacific, the Middle East, and Africa are collectively amplifying the addressable market at extraordinary speed.
The global payment gateway market's 21.2% CAGR reflects a fundamental, irreversible structural transformation in how businesses and consumers transact - with digital payment infrastructure becoming as essential to modern commerce as electricity, where every new merchant, marketplace, fintech platform, super-app, or embedded finance solution spawned by the digital economy requires sophisticated payment gateway capabilities to operate, creating a compounding network effect that is generating sustained, high-velocity revenue growth for payment gateway providers across every sector, geography, and enterprise size category through 2035.
Payment Gateway Market Size and Forecast
-
Market Size in 2025: USD 45.2 Billion
-
Market Size by 2035: USD 310.0 Billion
-
CAGR: 21.2% from 2026 to 2035
-
Base Year: 2025
-
Forecast Period: 2026–2035
-
Historical Data: 2022–2024
To Get More Information On Payment Gateway Market - Request Free Sample Report
Payment Gateway Market Trends
-
Increased popularity of mobile commerce and in-app payments that create increased demand for mobile payment gateway solutions that work effectively on different types of mobile phones, smartwatches, and Internet of Things devices.
-
Fast emergence of API-driven cloud native payment gateway architecture that allows easier integration of payment gateways with e-commerce websites, ERP software, digital wallets, and emerging embedded finance applications.
-
Deployment of AI and machine learning-based fraud detection algorithms within payment gateway services, allowing real-time monitoring and chargeback minimization while improving overall security.
-
Supporting buy now pay later options within payment gateway systems to help retailers lower their cart abandonment rate and increase their average order value among other factors.
-
Expanding cross-border payment gateway capabilities, such as multiple currency support, real-time foreign exchange transactions, and support of different types of payments in emerging countries.
-
Tokenization, 3DSecure 2.0, and biometric authentication becoming popular methods to provide PCI-DSS compliance within gateway services and to decrease fraud risk associated with online payments.
-
Increased use of super-app and embedded finance platforms, particularly in Asia Pacific and Latin America, where payment gateway functionality is incorporated into various apps.
U.S. Payment Gateway Market Size Outlook:
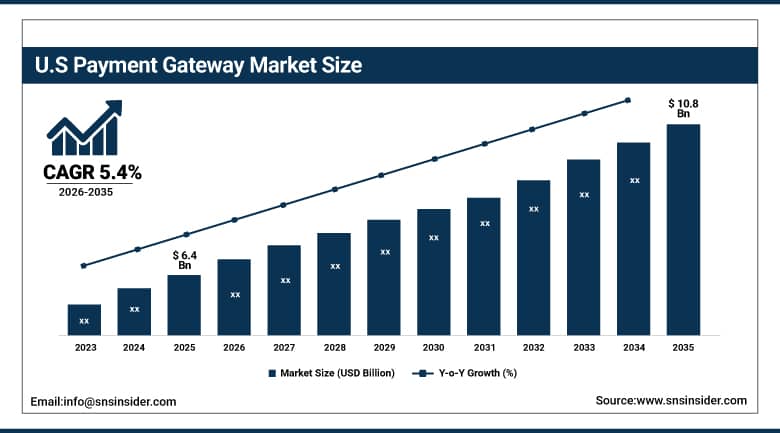
The U.S. Payment Gateway Market was valued at USD 6.4 billion in 2025 and is expected to reach USD 10.8 billion by 2035, registering a CAGR of 5.4% during 2026–2035.
United States continues to represent the largest individual market for payment gateways across the globe, supported by the most advanced digital commerce network in the world, an extremely sophisticated fintech sector, and widespread use of digital payment tools such as contactless cards, mobile wallets, and payment gateway integration via APIs. Together, prominent payment gateway service providers headquartered in the United States, such as PayPal, Stripe, Square, Braintree, and Checkout.com, cater to hundreds of millions of users worldwide, generating substantial revenues both domestically and internationally. The U.S. payments market capitalizes on the most advanced investments in digital commerce technology, with leading tech firms, banks, and venture-backed fintechs constantly developing and enhancing payment gateway functionalities.
The March 2024 introduction by PayPal of PayPal Open, which features both e-commerce and ad tools for sellers, as well as the renaming of Braintree to PayPal Enterprise Payments, indicates the ever-growing trend of convergence of payment gateway services, merchant services, and commerce media in one enterprise solution that is able to generate greater revenue per merchant than competitors in the already congested payment gateway market space.
Payment Gateway Market Segment Insights
-
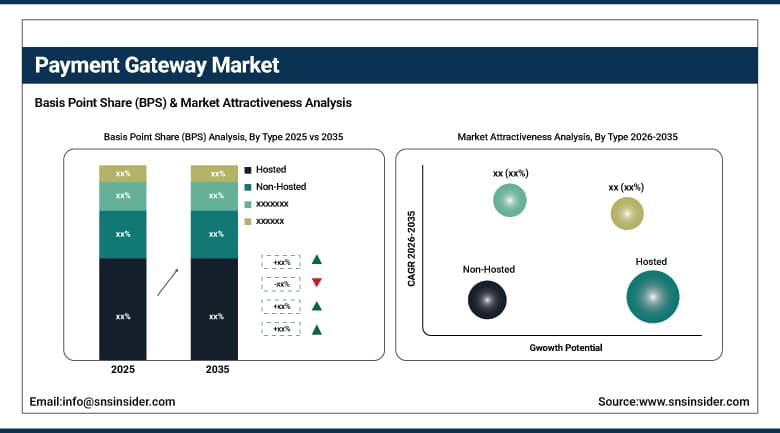
Based on Type, Hosted accounted for the largest market share (~59%) in 2025; Non-Hosted expected to be the fastest-growing segment (CAGR).
-
Based on Enterprise Size, Large Enterprises accounted for the largest market share (~60%) in 2025; Small & Medium Enterprises expected to be the fastest-growing segment (CAGR).
-
Based on End-Use, Retail & E-Commerce accounted for the largest market share in 2025; BFSI expected to be the fastest-growing end-use segment (CAGR).
By Type, Hosted dominates, Non-Hosted expected to grow fastest
The hosted payment gateway segment was responsible for more than 59% market share in the Global Payment Gateway Market in 2025, becoming the major gateway. This dominance is justified by the attractive nature of the offered services to various merchants of any size; all transactions are carried out on the safe third-party gateway portal, hence protecting the merchants from PCI-DSS compliance issues, managing security and infrastructure associated with the process and the risk of any fraudulent activities. The convenience offered by the plug-and-play technology, which facilitates payment transactions within days as compared to other gateways requiring weeks, makes it ideal for smaller organizations looking into venturing into e-commerce.
The non-hosted payment gateway segment is expected to grow at the highest CAGR during the period from 2026 to 2035. Non-hosted payment gateways give businesses complete control over the customer payment experience, ensuring that customers remain within the merchant's domain during payment processing, providing the benefit of greater brand identity, customized UI/UX design, and easy integration of the payment process within digital products and services. Mature technology companies, massive e-commerce players, fintech firms, and SaaS providers are the dominant end-users of non-hosted payment gateways, drawn to their flexible nature, deep enterprise system integration capabilities, and ability to create distinct checkout experiences to minimize cart abandonment.
By Enterprise Size, Large Enterprises dominate, SMEs accelerate fastest
Large businesses controlled the Payment Gateway Market, accounting for around 60% of total revenues in 2025. The large transaction volumes, substantial capital available for setting up scalable and safe payment systems, and complicated payment needs across multiple channels including web, mobile, point of sale, and international transactions contributed to the dominance of large businesses in the market. Large businesses can negotiate lower transaction fees, enjoy enterprise-level capabilities such as fraud analytics dashboard, token vault, report generation, and technical support services that have a definite return on investment (ROI).
SMEs will record the highest CAGR during the period of 2026 to 2035, mainly owing to the exceptional democratization of gateway technology that is being achieved through affordable plug-and-play systems, pay-as-you-go subscription models, and easy-to-use solutions that can integrate with major ecommerce platforms like Shopify, WooCommerce, and Magento. Thanks to the SME digitization trend, which has been propelled by the shift towards e-commerce during the pandemic era, and the increasing presence of e-commerce platforms in emerging economies, millions of small businesses that were traditionally cash-based enterprises are going online and require the services of gateways for accepting digital payments.
By End-Use, Retail & E-Commerce dominates, BFSI expected to grow fastest
In 2025, retail and e-commerce would emerge as the leading application end-user segment in terms of the highest revenue share within the payment gateway market. The rapid expansion of global e-commerce, expected to generate revenues worth USD 8 trillion by 2027, implies that payment gateways have to cope with increasing transaction volumes, reduce checkout friction, provide one-click reorder functionality, offer subscription-based commerce, and accept payments in multiple currencies. Omnicommerce, which integrates payment options across multiple channels such as brick-and-mortar stores, online stores, and mobile devices, is also reinforcing the importance of payment gateway solutions.
The BFSI segment is projected to register the highest end-use CAGR during 2026–2035, driven by the accelerating digital transformation of banking, financial services, and insurance organizations migrating legacy payment systems to modern, API-based, open banking-compatible platforms. BFSI players are integrating payment gateways directly into digital wallets, mobile banking applications, insurance premium collection platforms, and SME banking tools - creating new embedded finance revenue streams and improving customer payment experiences across a vast institutional client base. Real-time payment rails, open banking mandates, and embedded finance adoption are collectively transforming BFSI into one of the highest-value gateway end-use verticals through the forecast period.
Payment Gateway Market Regional Analysis:
|
Region |
Major Country |
Share within Region (%) |
|---|---|---|
|
North America |
United States |
37% |
|
Europe |
United Kingdom |
28% |
|
Asia Pacific |
China |
46% |
|
Middle East & Africa |
UAE |
31% |
|
Latin America |
Brazil |
52% |
North America Payment Gateway Market Insights
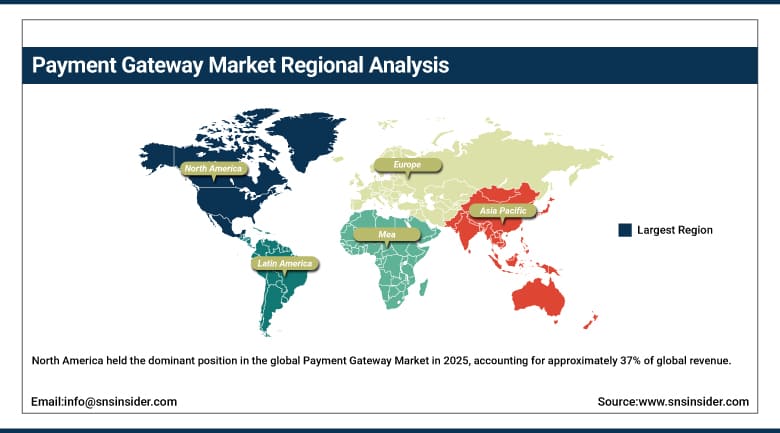
North America held the dominant position in the global Payment Gateway Market in 2025, accounting for approximately 37% of global revenue. The United States anchors regional leadership, supported by the world's most advanced digital commerce infrastructure, ubiquitous adoption of contactless payments and mobile wallets, sophisticated anti-fraud systems, and a mature regulatory framework including PCI-DSS standards that underpin merchant and consumer trust in digital payment channels. The U.S. market was valued at USD 6.4 billion in 2025 and is projected to reach USD 10.8 billion by 2035. The concentration of globally leading payment gateway providers including PayPal, Stripe, Square, Braintree, and Adyen's North American operations reinforces the region's innovation leadership and competitive intensity. Canada contributes meaningfully through strong e-commerce growth, open banking framework development, and broad digital payment adoption.
Get Customized Report as Per Your Business Requirement - Enquiry Now
Asia Pacific Payment Gateway Market Insights
Asia Pacific is set to experience the highest regional CAGR over the forecast period of 2026-2035 due to the presence of the innovative digital payment ecosystem in China, India, and Southeast Asia. The digital payment ecosystem led by super-app payment players such as Alipay and WeChat Pay in China has created a model which other countries across the world can emulate for digital commerce through advanced QR-code payments. Meanwhile, India's UPI (Unified Payments Interface) ecosystem handles several billion real-time transactions on a monthly basis via its various gateways such as Razorpay, PayU, and Cashfree which allow Indian merchants to enjoy cutting-edge payments facilities.
Europe Payment Gateway Market Insights
In 2025, Europe is holding a solid and strong market share within the Payment Gateway Market worldwide, with the UK, Germany, France, and the Netherlands being the major countries dominating the market. Due to the impact of the PSD2 regulation of the EU and the open banking framework, there has been remarkable innovation in the payment gateways technology, resulting in account-to-account transaction processing, SCA implementation, and emergence of new gateway players due to open banking APIs. The UK is dominating the European market in terms of revenues due to its position as the best European center for fintech companies coupled with the presence of major gateway players such as Checkout.com and WorldFirst.
Middle East & Africa and Latin America Payment Gateway Market Insights
MEA and Latin America constitute the rapidly emerging markets in payment gateways on the back of rapid adoption of digital payments, high smartphone penetration, and aggressive financial inclusion programs run by governments. The UAE constitutes the leader in the MEA region with about 31% of total regional revenue owing to its well-developed regulatory environment for fintech firms, high smartphone penetration, and a well-educated population that makes rapid adoption of digital payments possible. In Latin America, Brazil accounts for about 52% of total regional revenue with the help of Pix, a real-time payment solution in Brazil. This has facilitated an unprecedented uptake of digital payment solutions in Brazil, creating huge demand for gateway solutions capable of interfacing with the Brazilian payment system.
Payment Gateway Market Growth Drivers:
-
Exponential rise of e-commerce and mobile payments creating irreversible structural demand for payment gateway infrastructure
The primary structural growth driver for the Payment Gateway Market is the relentless global expansion of digital commerce - encompassing traditional e-commerce, mobile commerce, social commerce, marketplace platforms, subscription services, and embedded finance applications - each of which requires payment gateway infrastructure to process, secure, and optimize transactions. Global e-commerce sales have grown from under USD 2 trillion in 2019 to over USD 6 trillion by 2025, with each new merchant, marketplace, and digital service provider requiring gateway capabilities to operate. Simultaneously, the global mobile payment user base is expanding at extraordinary speed, driven by smartphone penetration in developing economies, mobile wallet adoption, and the integration of payment capabilities into super-apps, social media platforms, and everyday consumer applications - creating a compounding demand dynamic that is sustaining the payment gateway market's exceptional CAGR through the forecast period.
The integration of AI-driven fraud detection, real-time risk scoring, and machine learning-based transaction monitoring into modern payment gateways is delivering transformational economic value - reducing fraud losses by up to 70% and false decline rates by up to 30% for leading gateway users - creating a powerful upgrade incentive that is accelerating merchant migration from legacy payment systems to next-generation intelligent gateway platforms, and generating premium revenue streams for providers of AI-enhanced payment security and analytics capabilities.
Payment Gateway Market Restraints
-
Complex and fragmented global regulatory compliance requirements limiting cross-border scalability for gateway providers
A significant restraint in the Payment Gateway Market is the complex, constantly evolving, and highly fragmented global regulatory landscape governing digital payments - encompassing PCI-DSS compliance requirements, PSD2 strong customer authentication mandates in Europe, RBI payment aggregator guidelines in India, diverse data localization requirements across multiple jurisdictions, and varying anti-money laundering (AML) and Know Your Customer (KYC) obligations across markets. For gateway providers seeking to scale internationally, navigating this multi-jurisdictional regulatory complexity requires substantial compliance investment, local licensing expertise, and ongoing regulatory monitoring capabilities - creating meaningful barriers to entry and operational cost burdens that can compress margins and slow geographic expansion timelines. Data security breaches and rising cyberattack sophistication targeting payment infrastructure also represent ongoing risks that necessitate continuous security investment and can erode merchant and consumer confidence if incidents occur.
Payment Gateway Market Opportunities
-
Embedded finance, BNPL integration, crypto payments, and real-time cross-border payment expansion
The convergence of embedded finance and payment gateway technology represents the most transformative opportunity in the market - enabling non-financial businesses including e-commerce platforms, logistics companies, SaaS providers, and gig economy platforms to embed sophisticated payment capabilities directly into their products and services without becoming licensed financial institutions. Payment-as-a-Service and Banking-as-a-Service models powered by gateway APIs are creating entirely new revenue streams for platform businesses and dramatically expanding the addressable market for gateway providers. The global BNPL market, real-time payment rail expansion, central bank digital currency (CBDC) development, and growing merchant acceptance of stablecoin and cryptocurrency payments represent additional high-value innovation frontiers. Emerging market financial inclusion initiatives - particularly across Sub-Saharan Africa and Southeast Asia - present enormous greenfield opportunities for mobile-first gateway providers targeting billions of currently unbanked and underbanked consumers being rapidly onboarded to digital payment ecosystems.
Recent Developments:
-
2026: Stripe extended its payment platform infrastructure with Stripe Treasury, which allowed new geographic regions’ platforms and marketplaces to integrate FDIC-insured bank accounts, issuance, and payment gateways through a single consolidated API platform. The initiative further boosted the embedded finance model’s acceptance in SME and enterprise platform ecosystems.
-
2025 (March): PayPal introduced PayPal Open for merchant payments, combined with online advertising, while renaming Braintree as PayPal Enterprise Payments. The decision to rebrand Braintree came after PayPal had decided to consolidate its product line under an enterprise payment gateway model.
-
2024 (October): Adyen expanded its unified commerce platform with advanced real-time fraud protection features using proprietary machine learning algorithms that reduced the false decline rate up to 30% among global enterprises. This feature differentiated the company from other payment gateways that were already in the market.
-
2024 (July): Checkout.com formed a strategic partnership with a Middle Eastern sovereign wealth fund-owned online shopping platform to provide exclusive payment gateway solutions for GCC markets.
-
2025 (January): Razorpay launched its international payment gateway product suite targeting Indian exporters and cross-border e-commerce merchants, enabling multi-currency acceptance, real-time FX conversion, and compliance with RBI's cross-border payment regulations - positioning the company for international expansion beyond its dominant Indian domestic market position.
Payment Gateway Market Key Players
-
PayPal Holdings, Inc.
-
Stripe, Inc.
-
Adyen N.V.
-
Block, Inc. (Square)
-
Worldpay (FIS Global)
-
Amazon Pay (Amazon.com, Inc.)
-
Razorpay
-
PayU (Naspers/Prosus)
-
Checkout.com
-
Klarna Bank AB
-
Authorize.Net (Visa Inc.)
-
2Checkout (Verifone)
-
Payoneer Global Inc.
-
WEX Inc.
-
Nuvei Corporation
-
Cashfree Payments
-
CCAvenue (Infibeam Avenues Ltd.)
-
Paytm Payments Bank Ltd.
-
Alipay (Ant Group)
-
Elavon (U.S. Bancorp)
Payment Gateway Market Report Scope:
| Report Attributes | Details |
|---|---|
| Market Size in 2025 | USD 45.2 Billion |
| Market Size by 2035 | USD 310.0 Billion |
| CAGR | CAGR of 21.2% From 2026 to 2035 |
| Base Year | 2025 |
| Forecast Period | 2026-2035 |
| Historical Data | 2022-2024 |
| Report Scope & Coverage | Market Size, Segments Analysis, Competitive Landscape, Regional Analysis, DROC & SWOT Analysis, Forecast Outlook |
| Key Segments | • By Type (Hosted, Non-Hosted) • By Enterprise Size (Large Enterprises, Small & Medium Enterprises) • By End-Use (BFSI, Media & Entertainment, Retail & E-Commerce, Travel & Hospitality, Others) |
| Regional Analysis/Coverage | North America (US, Canada, Mexico), Europe (Eastern Europe [Poland, Romania, Hungary, Turkey, Rest of Eastern Europe] Western Europe] Germany, France, UK, Italy, Spain, Netherlands, Switzerland, Austria, Rest of Western Europe]), Asia Pacific (China, India, Japan, South Korea, Vietnam, Singapore, Australia, Rest of Asia Pacific), Middle East & Africa (Middle East [UAE, Egypt, Saudi Arabia, Qatar, Rest of Middle East], Africa [Nigeria, South Africa, Rest of Africa], Latin America (Brazil, Argentina, Colombia, Rest of Latin America) |
| Company Profiles | PayPal Holdings, Inc., Stripe, Inc., Adyen N.V., Block, Inc. (Square), Worldpay (FIS Global), Amazon Pay (Amazon.com, Inc.), Razorpay, PayU (Naspers/Prosus), Checkout.com, Klarna Bank AB, Authorize.Net (Visa Inc.), 2Checkout (Verifone), Payoneer Global Inc., WEX Inc., Nuvei Corporation, Cashfree Payments, CCAvenue (Infibeam Avenues Ltd.), Paytm Payments Bank Ltd., Alipay (Ant Group), Elavon (U.S. Bancorp) |
Get in Touch
