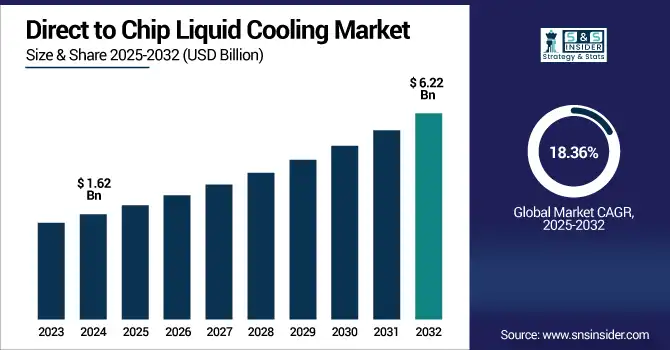
The Direct to Chip Liquid Cooling Market size was valued at USD 1.62 billion in 2024 and is expected to reach USD 6.22 billion by 2032, growing at a CAGR of 18.36% over the forecast period of 2025-2032.
Direct to chip liquid cooling market trends are rising AI workloads, high-density servers, and data center sustainability. The adoption is accelerating due to superior thermal efficiency and reduced energy consumption over air cooling.
Growth of edge computing, non-centralized data center requirement, demand for scalable and modular cooling solutions are some of the opportunities driving the direct to chip liquid cooling market. This growth is also bolstered by increasing environmental regulations and green IT initiatives that are forcing enterprises to manage thermal more efficiently. New developments in material science have made reliability and adoption easier with corrosion-resistant cold plates and leak-proof fittings better than they used to be. Also, its integration with AI-based cooling control system allows for performance optimization in real time, increasing its attractiveness for enterprise, industrial, and hyperscale deployment.
AI and data center growth now consume 1–2% of global electricity, projected to reach 500 TWh by 2030 boosting adoption of liquid cooling for efficiency.
The U.S. direct to chip liquid cooling market size was valued at USD 0.45 billion in 2024 and is projected to grow at a CAGR of 18.03%, reaching USD 1.70 billion by 2032. The U.S. direct‑to‑chip liquid cooling market is growing due to the rapid growth of hyperscale and edge data centers, soaring AI and HPC workloads, growing energy efficiency mandates, and customized partnerships with IT providers.
Key Drivers:
AI and HPC Demands Drive Sustainable Direct to Chip Cooling Adoption in Hyperscale Data Centers Globally
Growing demand for high-performance computing (HPC) and AI workloads and dense server environments beyond the cooling capacity of traditional air systems have primarily driven the global Direct to chip liquid cooling market growth. Liquid cooling deployment is becoming important for hyperscale data centers and colocation providers, helping to minimize energy costs and improve resource management. Moreover, increased cost of electricity along with heightened climate change awareness has driven the governments to implement more stringent regulations, which drive enterprises to move toward sustainable cooling technologies.
Liquid cooling can reduce data center energy consumption by up to 50% compared to traditional air-based systems and lower average PUE from ~1.5 to as low as 1.04–1.10.
Restraints:
Retrofitting Challenges in Legacy Data Centers Restrain Global Adoption of Direct to Chip Liquid Cooling
The lack of complexity to retrofitting legacy data centers is one major restraint for global Direct to chip liquid cooling market. The common facilities are constructed on grounds, where air-based cooling infrastructure is already used, and therefore, it is easier to implement a gaseous-state cooling system, whereas incorporating a liquid cooling infrastructure would require major downtime or overall re-designing of the existing facility, which is technically and economically a very costly decision. This hampers adoption, especially for an enterprise with legacy assets that were not designed modularly or flexibly.
Opportunities:
Edge Data Centers and Green IT Goals Drive Innovation in Reliable Liquid Cooling Technologies Globally
Edge data centers are already being expanded in both remote and developing regions with corresponding opportunities as thermal performance becomes increasingly important. Smart sensors (integrated with AI on the control systems) and the use of materials highly resistant to corrosion are offering reliability and accessibility in equal measure. Innovation and collaboration will continue to enter through the door of Green IT initiatives and carbon-neutral goals globally.
Over 80% of new EU data centers are committed under the Climate Neutral Data Centre Pact to achieving 100% renewable energy usage by 2025 or 2030, including strict PUE and reuse targets.
Challenges:
Skilled Workforce Shortage and Regulatory Gaps Challenge Global Adoption of Liquid Cooling Technologies
The biggest issue is the limited access to science professionals which actually understand liquid cooling systems, fluid dynamics, and integrated thermal management. Even experts on redundancy, non-leakage, and legitimate system operation are needed to help it all operate without issue, and without incident. In addition, the global divergence in standard and compliance regarding liquid-type cooling infrastructure again has much to do with adoption impedance, unless regulatory regimes have built in certainty for next-gen data center cooling technologies in certain countries.
By Component
The segment for cold plates made up 40.6% of the total component share of the Direct to chip liquid cooling market in 2024 as they play a key role in an AI, HPC, and data center workloads due to their capability to provide high-efficiency, direct thermal transfer from high-power processors. It is more compact, scalable, and compatible with current server designs, which makes it easier for hyperscale and enterprise datacenter deployments.
The Coolant Distribution Units segment is expected to grow at the highest CAGR over 2025-2032. CDUs are becoming more popular as they allow for centralized and modular fluid use, which makes sense for big, dense computing. Real-time control of temperature, flow rate, and pressure enhances system safety and adaptability to changing cooling requirements.
By Application
The Direct to chip liquid cooling market was led by data centers in 2024, with a 46.5% market share, led by an increasing demand for effective thermal management solutions for hyper-scalable, and colocation data center environments. It all comes down to the fact that as server density and power consumption continually grow, traditional air cooling becomes a losing battle. Direct-to-chip l iquid cooling lowers PUE, decreases energy use, and facilitates energy efficiency essential elements of sustainability intent for large cloud providers and enterprise data centers.
The High-performance computing (HPC) segment is anticipated to achieve the highest CAGR over 2025-2032, attributed to the need for high thermal efficiency across compute-intensive applications. Many applications (AI modeling, scientific simulations and genomic research) generate substantial heat loads, thus advanced cooling technologies are needed. Direct-to-chip liquid cooling provides the reliability and performance required to keep things running in their ideal temperature, all without sacrificing processing time, making it perfect solution for national labs, research centers, and tech-forward industries capitalizing on the HPC boom.
By Cooling Type
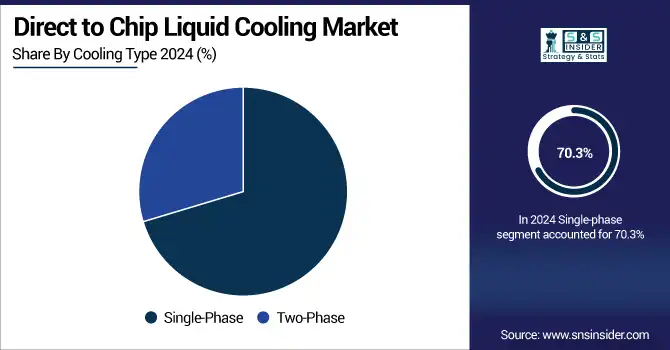
In 2024, the share of single-phase cooling in the Direct to chip liquid cooling market was 70.3%. The reason for its dominance is the ease of deployment, low cost, and it can run on existing server infrastructure. In this type of cooling solution, a liquid stays in the same phase during the cooling cycle, which makes it easier to handle, maintain, and allow for integrating into existing data center environments. Due to its history of low operational risk and solid reliability, this model is a common approach for hyperscale and enterprise data centers.
For the period of 2025-2032, the two-phase cooling is anticipated to experience the highest CAGR due to its much better thermal performance. This process actually utilizes the coolant change phase from liquid to vapor to transfer heat from high-performance processors more efficiently. This amounts to a big advantage in the capacity to manage larger heat concentrations, with less fluid flow, which is crucial for AI servers, HPC environments, and next-generation compute platforms.
By End-User
The direct to chip liquid cooling market is led by IT and Telecommunications, accounting for 52.6% of the market share in 2024. This leadership is propelled by strong growth in hyperscale and edge data centers, which support cloud computing, 5G infrastructure, and AI-based services. When server workloads are increasing, density is also, and more traditional cooling systems cannot keep up with performance and energy efficiency. It delivers a much-sought-after scalable and sustainable solution via direct-to-chip liquid cooling that positions it well ahead of the pack, catering primarily to large telecom operators and IT service providers processing large volumes of data with uptime and low latency in real-time.
During 2025-2032, the Healthcare sector is projected to have the fastest CAGR, owing to accelerated digitalization, the use of AI-supported diagnostic and medical imaging, and genomic research. Such applications utilize significant high-performance computing (HPC) environments with thermal output. Direct-to-chip liquid cooling provides accurate thermal management and other benefits of reliability, preventing mission-critical systems from experiencing performance dips.
Regional Analysis:
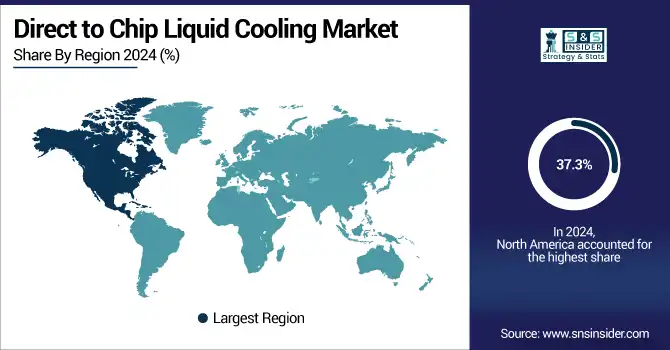
The North American Direct to chip liquid cooling market share accounted for around 37.3% in 2024 with early adoption by hyperscale data centers and AI infrastructure. Demand for advanced cooling technologies is being fueled by energy efficient operation, strict carbon regulations, and needs for high performance computing in the region. This trend continues with significant investment by major cloud providers, government research institutions, and AI-focused enterprises in direct-to-chip solutions for thermal performance and sustainability goals, solidifying the region's leadership in data infrastructure innovation.
Strong federal support for energy-efficient and sustainable data center operations, along with the concentration of hyperscale data centers, AI labs, and tech giants in the U.S., led to dominance in the North American market.
Direct to chip liquid cooling market in Asia Pacific is expected to grow at the fastest CAGR of 19.25% over the forecast period of 2025-2032. This spike is propelled by the continued growth of AI-powered data centers, increasing edge infrastructure, and the demand for high-performance computing. Accelerated adoption are led by strong government initiatives on Digitalization, Sustainability and Power Efficiency. And investments on next-gen cloud and colocation facilities are creating strong demand for advanced thermal management technologies such as direct-to-chip liquid cooling.
China dominated the Asia Pacific market owing to the rapid expansion of data centers, increasing investments in AI and HPC, and the Chinese government advocating policies promoting energy-efficient infrastructure in addition to deployment of advanced cooling systems across public and private infrastructure sectors.
The Direct to chip liquid cooling market in Europe is primarily driven by stringent environmental regulations, energy efficiency targets, and the growing adoption of green IT solutions in the regions. There is increasing demand for sustainable cooling technologies in data centers, research institutions, and enterprise computing environments in the region. The shift from traditional air cooling to liquid cooling is being sped up by government initiatives pushing for carbon neutrality and integration of renewable energy.
The Middle East & Africa and Latin America are also expected to be emerging markets for direct-to-chip liquid cooling, attributable to increasing investments in digital infrastructure and gradual adoption of edge and hyperscale data center development. With temperatures soaring and power shortfalls becoming an urgent concern, both regions are working to upgrade their energy efficiencies and greater assumptions of sustainability.
Key players:
Some of the major Global Direct to Chip Liquid Cooling companies are LiquidStack, Submer, ZutaCore, CoolIT Systems, Asetek, Supermicro, Lenovo, Dell, HPE, Fujitsu, IBM, Vertiv, Rittal, Schneider Electric, GRC, Iceotope, TAKADA, ExaScaler, Noctua Industrial Solutions, and Midas Green Technologies.
Recent Developments:
In November 2024, CoolIT Systems introduced the CHx1000, the world’s highest-density liquid‑to‑liquid Coolant Distribution Unit (CDU), optimized for NVIDIA Blackwell AI platforms.
In August 2024, LiquidStack opened a major new manufacturing facility and global HQ in Carrollton, Texas, scaling production for direct-to-chip CDUs and modular cooling systems.
In 2025, Asetek introduced the Ingrid cooler platform, promising near-silent operation and targeting workstation and gaming PC markets. Though not enterprise-level D2C, the innovation reflects cooling tech evolution.
Report Attributes | Details |
Market Size in 2024 | USD 1.62 Billion |
Market Size by 2032 | USD 6.22 Billon |
CAGR | CAGR of 18.36% From 2025 to 2032 |
Base Year | 2024 |
Forecast Period | 2025-2032 |
Historical Data | 2021-2023 |
Report Scope & Coverage | Market Size, Segments Analysis, Competitive Landscape, Regional Analysis, DROC & SWOT Analysis, Forecast Outlook |
Key Segments | • By Component (Cold Plates, Coolant Distribution Units, Heat Exchangers, Pumps and Others) • By Application (Data Centers, High-Performance Computing, Telecommunications and Others) • By Cooling Type (Single-Phase and Two-Phase) • By End-User (IT and Telecommunications, BFSI, Healthcare, Government and Others) |
Regional Analysis/Coverage | North America (US, Canada, Mexico), Europe (Germany, France, UK, Italy, Spain, Poland, Turkey, Rest of Europe), Asia Pacific (China, India, Japan, South Korea, Singapore, Australia, Taiwan, Rest of Asia Pacific), Middle East & Africa (UAE, Saudi Arabia, Qatar, South Africa, Rest of Middle East & Africa), Latin America (Brazil, Argentina, Rest of Latin America) |
Company Profiles | LiquidStack, Submer, ZutaCore, CoolIT Systems, Asetek, Supermicro, Lenovo, Dell, HPE, Fujitsu, IBM, Vertiv, Rittal, Schneider Electric, GRC, Iceotope, TAKADA, ExaScaler, Noctua Industrial Solutions, and Midas Green Technologies. |
Ans: The Direct to Chip Liquid Cooling Market is expected to grow at a CAGR of 18.36% from 2025-2032.
Ans: The Direct to Chip Liquid Cooling Market size was USD 1.62 Billion in 2024 and is expected to reach USD 6.22 Billion by 2032.
Ans: The major growth factor of the Direct-to-Chip Liquid Cooling Market is the rising demand for high-performance and energy-efficient cooling solutions in AI, HPC, and data center infrastructure.
Ans: The Single-Phase segment dominated the Direct to Chip Liquid Cooling Market in 2024.
Ans: North America dominated the Direct to Chip Liquid Cooling Market in 2024.
Table Of Contents
1. Introduction
1.1 Market Definition & Scope
1.2 Research Assumptions & Abbreviations
1.3 Research Methodology
2. Executive Summary
2.1 Market Snapshot
2.2 Market Absolute $ Opportunity Assessment & Y-o-Y Analysis, 2021–2032
2.3 Market Size & Forecast, By Segmentation, 2021–2032
2.3.1 Market Size By Component
2.3.2 Market Size By Application
2.3.3 Market Size By Cooling Type
2.3.4 Market Size By End-User
2.4 Market Share & Bps Analysis By Region, 2024
2.5 Industry Growth Scenarios – Conservative, Likely & Optimistic
2.6 Industry CxO’s Perspective
3. Market Overview
3.1 Market Dynamics
3.1.1 Drivers
3.1.2 Restraints
3.1.3 Opportunities
3.1.4 Key Market Trends
3.2 Industry PESTLE Analysis
3.3 Key Industry Forces (Porter’s) Impacting Market Growth
3.4 Industry Supply Chain Analysis
3.4.1 Raw Material Suppliers
3.4.2 Manufacturers
3.4.3 Distributors/Suppliers
3.4.4 Customers/End-Users
3.5 Industry Life Cycle Assessment
3.6 Parent Market Overview
3.7 Market Risk Assessment
4. Statistical Insights & Trends Reporting
4.1 Energy Efficiency & Sustainability Metrics
4.1.1 Overview
4.1.2 Average Power Usage Effectiveness (PUE) Improvement (% Reduction vs. Traditional Cooling)
4.1.3 Thermal Design Power (TDP) Efficiency Range Supported, By System Type
4.1.4 % Reduction in Water/Energy Consumption vs. Traditional Systems
4.1.5 Carbon Emissions Reduction (%) from System-Level Cooling Upgrade
4.2 Technical & Infrastructure Statistics
4.2.1 Overview
4.2.2 Flow Rate & Coolant Type Distribution (% Share – Water, Dielectric Fluids, Glycol)
4.2.3 % Systems Using Single-Loop vs. Dual-Loop Architecture
4.2.4 Average System Lifetime or MTBF (Mean Time Between Failure)
4.2.5 Rack Density Trends (Average kW/Rack) Enabled by Direct-to-Chip Cooling
4.3 Barriers & Enablers (Quantitative View)
4.3.1 Overview
4.3.2 % of Organizations Citing CapEx/OpEx as Barrier to Adoption
4.3.3 % of Decision-Makers Considering Transition in Next 1–3 Years
4.3.4 Awareness or Preference Index (Facility & IT Heads Survey)
4.4 Adoption & Penetration Metrics
4.4.1 Overview
4.4.2 % Adoption Rate by Data Center Type (Hyperscale, Enterprise, Colocation)
4.4.3 % Share of Liquid-Cooled vs. Air-Cooled Systems
4.4.4 % of Servers Equipped with Direct-to-Chip Cooling
4.4.5 YoY Growth in Adoption in High-Performance Computing (HPC) Environments
5. Direct to Chip Liquid Cooling Market Segmental Analysis & Forecast, By Component, 2021 – 2032, Value (USD Billion)
5.1 Introduction
5.2 Cold Plates
5.2.1 Key Trends
5.2.2 Market Size & Forecast, 2021 – 2032
5.3 Coolant Distribution Units
5.3.1 Key Trends
5.3.2 Market Size & Forecast, 2021 – 2032
5.4 Heat Exchangers
5.4.1 Key Trends
5.4.2 Market Size & Forecast, 2021 – 2032
5.5 Pumps
5.5.1 Key Trends
5.5.2 Market Size & Forecast, 2021 – 2032
5.6 Others
5.6.1 Key Trends
5.6.2 Market Size & Forecast, 2021 – 2032
6. Direct to Chip Liquid Cooling Market Segmental Analysis & Forecast, By Application, 2021 – 2032, Value (USD Billion)
6.1 Introduction
6.2 Data Centers
6.2.1 Key Trends
6.2.2 Market Size & Forecast, 2021 – 2032
6.3 High-Performance Computing
6.3.1 Key Trends
6.3.2 Market Size & Forecast, 2021 – 2032
6.4 Telecommunications
6.4.1 Key Trends
6.4.2 Market Size & Forecast, 2021 – 2032
6.5 Others
6.5.1 Key Trends
6.5.2 Market Size & Forecast, 2021 – 2032
7. Direct to Chip Liquid Cooling Market Segmental Analysis & Forecast, By Cooling Type, 2021 – 2032, Value (USD Billion)
7.1 Introduction
7.2 Single-Phase
7.2.1 Key Trends
7.2.2 Market Size & Forecast, 2021 – 2032
7.3 Two-Phase
7.3.1 Key Trends
7.3.2 Market Size & Forecast, 2021 – 2032
8. Direct to Chip Liquid Cooling Market Segmental Analysis & Forecast, By End-User, 2021 – 2032, Value (USD Billion)
8.1 Introduction
8.2 IT and Telecommunications
8.2.1 Key Trends
8.2.2 Market Size & Forecast, 2021 – 2032
8.3 BFSI
8.3.1 Key Trends
8.3.2 Market Size & Forecast, 2021 – 2032
8.4 Healthcare
8.4.1 Key Trends
8.4.2 Market Size & Forecast, 2021 – 2032
8.5 Government
8.5.1 Key Trends
8.5.2 Market Size & Forecast, 2021 – 2032
8.6 Others
8.6.1 Key Trends
8.6.2 Market Size & Forecast, 2021 – 2032
9. Direct to Chip Liquid Cooling Market Segmental Analysis & Forecast By Region, 2021 – 2025, Value (USD Billion)
9.1 Introduction
9.2 North America
9.2.1 Key Trends
9.2.2 Direct to Chip Liquid Cooling Market Size & Forecast, By Component, 2021 – 2032
9.2.3 Direct to Chip Liquid Cooling Market Size & Forecast, By Application, 2021 – 2032
9.2.4 Direct to Chip Liquid Cooling Market Size & Forecast, By Cooling Type, 2021 – 2032
9.2.5 Direct to Chip Liquid Cooling Market Size & Forecast, By End-User, 2021 – 2032
9.2.6 Direct to Chip Liquid Cooling Market Size & Forecast, By Country, 2021 – 2032
9.2.6.1 USA
9.2.6.1.1 Direct to Chip Liquid Cooling Market Size & Forecast, By Component, 2021 – 2032
9.2.6.1.2 Direct to Chip Liquid Cooling Market Size & Forecast, By Application, 2021 – 2032
9.2.6.1.3 Direct to Chip Liquid Cooling Market Size & Forecast, By Cooling Type, 2021 – 2032
9.2.6.1.4 Direct to Chip Liquid Cooling Market Size & Forecast, By End-User, 2021 – 2032
9.2.6.2 Canada
9.2.6.2.1 Direct to Chip Liquid Cooling Market Size & Forecast, By Component, 2021 – 2032
9.2.6.2.2 Direct to Chip Liquid Cooling Market Size & Forecast, By Application, 2021 – 2032
9.2.6.2.3 Direct to Chip Liquid Cooling Market Size & Forecast, By Cooling Type, 2021 – 2032
9.2.6.2.4 Direct to Chip Liquid Cooling Market Size & Forecast, By End-User, 2021 – 2032
9.3 Europe
9.3.1 Key Trends
9.3.2 Direct to Chip Liquid Cooling Market Size & Forecast, By Component, 2021 – 2032
9.3.3 Direct to Chip Liquid Cooling Market Size & Forecast, By Application, 2021 – 2032
9.3.4 Direct to Chip Liquid Cooling Market Size & Forecast, By Cooling Type, 2021 – 2032
9.3.5 Direct to Chip Liquid Cooling Market Size & Forecast, By End-User, 2021 – 2032
9.3.6 Direct to Chip Liquid Cooling Market Size & Forecast, By Country, 2021 – 2032
9.3.6.1 Germany
9.3.6.1.1 Direct to Chip Liquid Cooling Market Size & Forecast, By Component, 2021 – 2032
9.3.6.1.2 Direct to Chip Liquid Cooling Market Size & Forecast, By Application, 2021 – 2032
9.3.6.1.3 Direct to Chip Liquid Cooling Market Size & Forecast, By Cooling Type, 2021 – 2032
9.3.6.1.4 Direct to Chip Liquid Cooling Market Size & Forecast, By End-User, 2021 – 2032
9.3.6.2 UK
9.3.6.2.1 Direct to Chip Liquid Cooling Market Size & Forecast, By Component, 2021 – 2032
9.3.6.2.2 Direct to Chip Liquid Cooling Market Size & Forecast, By Application, 2021 – 2032
9.3.6.2.3 Direct to Chip Liquid Cooling Market Size & Forecast, By Cooling Type, 2021 – 2032
9.3.6.2.4 Direct to Chip Liquid Cooling Market Size & Forecast, By End-User, 2021 – 2032
9.3.6.3 France
9.3.6.3.1 Direct to Chip Liquid Cooling Market Size & Forecast, By Component, 2021 – 2032
9.3.6.3.2 Direct to Chip Liquid Cooling Market Size & Forecast, By Application, 2021 – 2032
9.3.6.3.3 Direct to Chip Liquid Cooling Market Size & Forecast, By Cooling Type, 2021 – 2032
9.3.6.3.4 Direct to Chip Liquid Cooling Market Size & Forecast, By End-User, 2021 – 2032
9.3.6.4 Italy
9.3.6.4.1 Direct to Chip Liquid Cooling Market Size & Forecast, By Component, 2021 – 2032
9.3.6.4.2 Direct to Chip Liquid Cooling Market Size & Forecast, By Application, 2021 – 2032
9.3.6.4.3 Direct to Chip Liquid Cooling Market Size & Forecast, By Cooling Type, 2021 – 2032
9.3.6.4.4 Direct to Chip Liquid Cooling Market Size & Forecast, By End-User, 2021 – 2032
9.3.6.5 Spain
9.3.6.5.1 Direct to Chip Liquid Cooling Market Size & Forecast, By Component, 2021 – 2032
9.3.6.5.2 Direct to Chip Liquid Cooling Market Size & Forecast, By Application, 2021 – 2032
9.3.6.5.3 Direct to Chip Liquid Cooling Market Size & Forecast, By Cooling Type, 2021 – 2032
9.3.6.5.4 Direct to Chip Liquid Cooling Market Size & Forecast, By End-User, 2021 – 2032
9.3.6.6 Russia
9.3.6.6.1 Direct to Chip Liquid Cooling Market Size & Forecast, By Component, 2021 – 2032
9.3.6.6.2 Direct to Chip Liquid Cooling Market Size & Forecast, By Application, 2021 – 2032
9.3.6.6.3 Direct to Chip Liquid Cooling Market Size & Forecast, By Cooling Type, 2021 – 2032
9.3.6.6.4 Direct to Chip Liquid Cooling Market Size & Forecast, By End-User, 2021 – 2032
9.3.6.7 Poland
9.3.6.7.1 Direct to Chip Liquid Cooling Market Size & Forecast, By Component, 2021 – 2032
9.3.6.7.2 Direct to Chip Liquid Cooling Market Size & Forecast, By Application, 2021 – 2032
9.3.6.7.3 Direct to Chip Liquid Cooling Market Size & Forecast, By Cooling Type, 2021 – 2032
9.3.6.7.4 Direct to Chip Liquid Cooling Market Size & Forecast, By End-User, 2021 – 2032
9.3.6.8 Rest of Europe
9.3.6.8.1 Direct to Chip Liquid Cooling Market Size & Forecast, By Component, 2021 – 2032
9.3.6.8.2 Direct to Chip Liquid Cooling Market Size & Forecast, By Application, 2021 – 2032
9.3.6.8.3 Direct to Chip Liquid Cooling Market Size & Forecast, By Cooling Type, 2021 – 2032
9.3.6.8.4 Direct to Chip Liquid Cooling Market Size & Forecast, By End-User, 2021 – 2032
9.4 Asia-Pacific
9.4.1 Key Trends
9.4.2 Direct to Chip Liquid Cooling Market Size & Forecast, By Component, 2021 – 2032
9.4.3 Direct to Chip Liquid Cooling Market Size & Forecast, By Application, 2021 – 2032
9.4.4 Direct to Chip Liquid Cooling Market Size & Forecast, By Cooling Type, 2021 – 2032
9.4.5 Direct to Chip Liquid Cooling Market Size & Forecast, By End-User, 2021 – 2032
9.4.6 Direct to Chip Liquid Cooling Market Size & Forecast, By Country, 2021 – 2032
9.4.6.1 China
9.4.6.1.1 Direct to Chip Liquid Cooling Market Size & Forecast, By Component, 2021 – 2032
9.4.6.1.2 Direct to Chip Liquid Cooling Market Size & Forecast, By Application, 2021 – 2032
9.4.6.1.3 Direct to Chip Liquid Cooling Market Size & Forecast, By Cooling Type, 2021 – 2032
9.4.6.1.4 Direct to Chip Liquid Cooling Market Size & Forecast, By End-User, 2021 – 2032
9.4.6.2 India
9.4.6.2.1 Direct to Chip Liquid Cooling Market Size & Forecast, By Component, 2021 – 2032
9.4.6.2.2 Direct to Chip Liquid Cooling Market Size & Forecast, By Application, 2021 – 2032
9.4.6.2.3 Direct to Chip Liquid Cooling Market Size & Forecast, By Cooling Type, 2021 – 2032
9.4.6.2.4 Direct to Chip Liquid Cooling Market Size & Forecast, By End-User, 2021 – 2032
9.4.6.3 Japan
9.4.6.3.1 Direct to Chip Liquid Cooling Market Size & Forecast, By Component, 2021 – 2032
9.4.6.3.2 Direct to Chip Liquid Cooling Market Size & Forecast, By Application, 2021 – 2032
9.4.6.3.3 Direct to Chip Liquid Cooling Market Size & Forecast, By Cooling Type, 2021 – 2032
9.4.6.3.4 Direct to Chip Liquid Cooling Market Size & Forecast, By End-User, 2021 – 2032
9.4.6.4 South Korea
9.4.6.4.1 Direct to Chip Liquid Cooling Market Size & Forecast, By Component, 2021 – 2032
9.4.6.4.2 Direct to Chip Liquid Cooling Market Size & Forecast, By Application, 2021 – 2032
9.4.6.4.3 Direct to Chip Liquid Cooling Market Size & Forecast, By Cooling Type, 2021 – 2032
9.4.6.4.4 Direct to Chip Liquid Cooling Market Size & Forecast, By End-User, 2021 – 2032
9.4.6.5 Australia
9.4.6.5.1 Direct to Chip Liquid Cooling Market Size & Forecast, By Component, 2021 – 2032
9.4.6.5.2 Direct to Chip Liquid Cooling Market Size & Forecast, By Application, 2021 – 2032
9.4.6.5.3 Direct to Chip Liquid Cooling Market Size & Forecast, By Cooling Type, 2021 – 2032
9.4.6.5.4 Direct to Chip Liquid Cooling Market Size & Forecast, By End-User, 2021 – 2032
9.4.6.6 ASEAN Countries
9.4.6.6.1 Direct to Chip Liquid Cooling Market Size & Forecast, By Component, 2021 – 2032
9.4.6.6.2 Direct to Chip Liquid Cooling Market Size & Forecast, By Application, 2021 – 2032
9.4.6.6.3 Direct to Chip Liquid Cooling Market Size & Forecast, By Cooling Type, 2021 – 2032
9.4.6.6.4 Direct to Chip Liquid Cooling Market Size & Forecast, By End-User, 2021 – 2032
9.4.6.7 Rest of Asia-Pacific
9.4.6.7.1 Direct to Chip Liquid Cooling Market Size & Forecast, By Component, 2021 – 2032
9.4.6.7.2 Direct to Chip Liquid Cooling Market Size & Forecast, By Application, 2021 – 2032
9.4.6.7.3 Direct to Chip Liquid Cooling Market Size & Forecast, By Cooling Type, 2021 – 2032
9.4.6.7.4 Direct to Chip Liquid Cooling Market Size & Forecast, By End-User, 2021 – 2032
9.5 Latin America
9.5.1 Key Trends
9.5.2 Direct to Chip Liquid Cooling Market Size & Forecast, By Component, 2021 – 2032
9.5.3 Direct to Chip Liquid Cooling Market Size & Forecast, By Application, 2021 – 2032
9.5.4 Direct to Chip Liquid Cooling Market Size & Forecast, By Cooling Type, 2021 – 2032
9.5.5 Direct to Chip Liquid Cooling Market Size & Forecast, By End-User, 2021 – 2032
9.5.6 Direct to Chip Liquid Cooling Market Size & Forecast, By Country, 2021 – 2032
9.5.6.1 Brazil
9.5.6.1.1 Direct to Chip Liquid Cooling Market Size & Forecast, By Component, 2021 – 2032
9.5.6.1.2 Direct to Chip Liquid Cooling Market Size & Forecast, By Application, 2021 – 2032
9.5.6.1.3 Direct to Chip Liquid Cooling Market Size & Forecast, By Cooling Type, 2021 – 2032
9.5.6.1.4 Direct to Chip Liquid Cooling Market Size & Forecast, By End-User, 2021 – 2032
9.5.6.2 Argentina
9.5.6.2.1 Direct to Chip Liquid Cooling Market Size & Forecast, By Component, 2021 – 2032
9.5.6.2.2 Direct to Chip Liquid Cooling Market Size & Forecast, By Application, 2021 – 2032
9.5.6.2.3 Direct to Chip Liquid Cooling Market Size & Forecast, By Cooling Type, 2021 – 2032
9.5.6.2.4 Direct to Chip Liquid Cooling Market Size & Forecast, By End-User, 2021 – 2032
9.5.6.3 Mexico
9.5.6.3.1 Direct to Chip Liquid Cooling Market Size & Forecast, By Component, 2021 – 2032
9.5.6.3.2 Direct to Chip Liquid Cooling Market Size & Forecast, By Application, 2021 – 2032
9.5.6.3.3 Direct to Chip Liquid Cooling Market Size & Forecast, By Cooling Type, 2021 – 2032
9.5.6.3.4 Direct to Chip Liquid Cooling Market Size & Forecast, By End-User, 2021 – 2032
9.5.6.4 Colombia
9.5.6.4.1 Direct to Chip Liquid Cooling Market Size & Forecast, By Component, 2021 – 2032
9.5.6.4.2 Direct to Chip Liquid Cooling Market Size & Forecast, By Application, 2021 – 2032
9.5.6.4.3 Direct to Chip Liquid Cooling Market Size & Forecast, By Cooling Type, 2021 – 2032
9.5.6.4.4 Direct to Chip Liquid Cooling Market Size & Forecast, By End-User, 2021 – 2032
9.5.6.5 Rest of Latin America
9.5.6.5.1 Direct to Chip Liquid Cooling Market Size & Forecast, By Component, 2021 – 2032
9.5.6.5.2 Direct to Chip Liquid Cooling Market Size & Forecast, By Application, 2021 – 2032
9.5.6.5.3 Direct to Chip Liquid Cooling Market Size & Forecast, By Cooling Type, 2021 – 2032
9.5.6.5.4 Direct to Chip Liquid Cooling Market Size & Forecast, By End-User, 2021 – 2032
9.6 Middle East & Africa
9.6.1 Key Trends
9.6.2 Direct to Chip Liquid Cooling Market Size & Forecast, By Component, 2021 – 2032
9.6.3 Direct to Chip Liquid Cooling Market Size & Forecast, By Application, 2021 – 2032
9.6.4 Direct to Chip Liquid Cooling Market Size & Forecast, By Cooling Type, 2021 – 2032
9.6.5 Direct to Chip Liquid Cooling Market Size & Forecast, By End-User, 2021 – 2032
9.6.6 Direct to Chip Liquid Cooling Market Size & Forecast, By Country, 2021 – 2032
9.6.6.1 UAE
9.6.6.1.1 Direct to Chip Liquid Cooling Market Size & Forecast, By Component, 2021 – 2032
9.6.6.1.2 Direct to Chip Liquid Cooling Market Size & Forecast, By Application, 2021 – 2032
9.6.6.1.3 Direct to Chip Liquid Cooling Market Size & Forecast, By Cooling Type, 2021 – 2032
9.6.6.1.4 Direct to Chip Liquid Cooling Market Size & Forecast, By End-User, 2021 – 2032
9.6.6.2 Saudi Arabia
9.6.6.2.1 Direct to Chip Liquid Cooling Market Size & Forecast, By Component, 2021 – 2032
9.6.6.2.2 Direct to Chip Liquid Cooling Market Size & Forecast, By Application, 2021 – 2032
9.6.6.2.3 Direct to Chip Liquid Cooling Market Size & Forecast, By Cooling Type, 2021 – 2032
9.6.6.2.4 Direct to Chip Liquid Cooling Market Size & Forecast, By End-User, 2021 – 2032
9.6.6.3 Qatar
9.6.6.3.1 Direct to Chip Liquid Cooling Market Size & Forecast, By Component, 2021 – 2032
9.6.6.3.2 Direct to Chip Liquid Cooling Market Size & Forecast, By Application, 2021 – 2032
9.6.6.3.3 Direct to Chip Liquid Cooling Market Size & Forecast, By Cooling Type, 2021 – 2032
9.6.6.3.4 Direct to Chip Liquid Cooling Market Size & Forecast, By End-User, 2021 – 2032
9.6.6.4 Egypt
9.6.6.4.1 Direct to Chip Liquid Cooling Market Size & Forecast, By Component, 2021 – 2032
9.6.6.4.2 Direct to Chip Liquid Cooling Market Size & Forecast, By Application, 2021 – 2032
9.6.6.4.3 Direct to Chip Liquid Cooling Market Size & Forecast, By Cooling Type, 2021 – 2032
9.6.6.4.4 Direct to Chip Liquid Cooling Market Size & Forecast, By End-User, 2021 – 2032
9.6.6.5 South Africa
9.6.6.5.1 Direct to Chip Liquid Cooling Market Size & Forecast, By Component, 2021 – 2032
9.6.6.5.2 Direct to Chip Liquid Cooling Market Size & Forecast, By Application, 2021 – 2032
9.6.6.5.3 Direct to Chip Liquid Cooling Market Size & Forecast, By Cooling Type, 2021 – 2032
9.6.6.5.4 Direct to Chip Liquid Cooling Market Size & Forecast, By End-User, 2021 – 2032
9.6.6.6 Rest of Middle East & Africa
9.6.6.6.1 Direct to Chip Liquid Cooling Market Size & Forecast, By Component, 2021 – 2032
9.6.6.6.2 Direct to Chip Liquid Cooling Market Size & Forecast, By Application, 2021 – 2032
9.6.6.6.3 Direct to Chip Liquid Cooling Market Size & Forecast, By Cooling Type, 2021 – 2032
9.6.6.6.4 Direct to Chip Liquid Cooling Market Size & Forecast, By End-User, 2021 – 2032
10. Competitive Landscape
10.1 Key Players' Positioning
10.2 Competitive Developments
10.2.1 Key Strategies Adopted (%), By Key Players, 2024
10.2.2 Year-Wise Strategies & Development, 2021 – 2025
10.2.3 Number Of Strategies Adopted By Key Players, 2024
10.3 Market Share Analysis, 2024
10.4 Product/Service & Application Benchmarking
10.4.1 Product/Service Specifications & Features By Key Players
10.4.2 Product/Service Heatmap By Key Players
10.4.3 Application Heatmap By Key Players
10.5 Industry Start-Up & Innovation Landscape
10.6 Key Company Profiles
10.6.1 LiquidStack.
10.6.1.1 Company Overview & Snapshot
10.6.1.2 Product/Service Portfolio
10.6.1.3 Key Company Financials
10.6.1.4 SWOT Analysis
10.6.2 Submer.
10.6.2.1 Company Overview & Snapshot
10.6.2.2 Product/Service Portfolio
10.6.2.3 Key Company Financials
10.6.2.4 SWOT Analysis
10.6.3 ZutaCore.
10.6.3.1 Company Overview & Snapshot
10.6.3.2 Product/Service Portfolio
10.6.3.3 Key Company Financials
10.6.3.4 SWOT Analysis
10.6.4 CoolIT Systems.
10.6.4.1 Company Overview & Snapshot
10.6.4.2 Product/Service Portfolio
10.6.4.3 Key Company Financials
10.6.4.4 SWOT Analysis
10.6.5 Asetek.
10.6.5.1 Company Overview & Snapshot
10.6.5.2 Product/Service Portfolio
10.6.5.3 Key Company Financials
10.6.5.4 SWOT Analysis
10.6.6 Supermicro.
10.6.6.1 Company Overview & Snapshot
10.6.6.2 Product/Service Portfolio
10.6.6.3 Key Company Financials
10.6.6.4 SWOT Analysis
10.6.7 Lenovo.
10.6.7.1 Company Overview & Snapshot
10.6.7.2 Product/Service Portfolio
10.6.7.3 Key Company Financials
10.6.7.4 SWOT Analysis
10.6.8 Dell Technologies.
10.6.8.1 Company Overview & Snapshot
10.6.8.2 Product/Service Portfolio
10.6.8.3 Key Company Financials
10.6.8.4 SWOT Analysis
10.6.9 HP Enterprise
10.6.9.1 Company Overview & Snapshot
10.6.9.2 Product/Service Portfolio
10.6.9.3 Key Company Financials
10.6.9.4 SWOT Analysis
10.6.10 Fujitsu.
10.6.10.1 Company Overview & Snapshot
10.6.10.2 Product/Service Portfolio
10.6.10.3 Key Company Financials
10.6.10.4 SWOT Analysis
10.6.11 IBM
10.6.11.1 Company Overview & Snapshot
10.6.11.2 Product/Service Portfolio
10.6.11.3 Key Company Financials
10.6.11.4 SWOT Analysis
10.6.12 Vertiv
10.6.12.1 Company Overview & Snapshot
10.6.12.2 Product/Service Portfolio
10.6.12.3 Key Company Financials
10.6.12.4 SWOT Analysis
10.6.13 Rittal
10.6.13.1 Company Overview & Snapshot
10.6.13.2 Product/Service Portfolio
10.6.13.3 Key Company Financials
10.6.13.4 SWOT Analysis
10.6.14 GRC (Green Revolution Cooling)
10.6.14.1 Company Overview & Snapshot
10.6.14.2 Product/Service Portfolio
10.6.14.3 Key Company Financials
10.6.14.4 SWOT Analysis
10.6.15 Schneider Electric
10.6.15.1 Company Overview & Snapshot
10.6.15.2 Product/Service Portfolio
10.6.15.3 Key Company Financials
10.6.15.4 SWOT Analysis
10.6.16 Iceotope
10.6.16.1 Company Overview & Snapshot
10.6.16.2 Product/Service Portfolio
10.6.16.3 Key Company Financials
10.6.16.4 SWOT Analysis
10.6.17 TAKADA.
10.6.17.1 Company Overview & Snapshot
10.6.17.2 Product/Service Portfolio
10.6.17.3 Key Company Financials
10.6.17.4 SWOT Analysis
10.6.18 ExaScaler.
10.6.18.1 Company Overview & Snapshot
10.6.18.2 Product/Service Portfolio
10.6.18.3 Key Company Financials
10.6.18.4 SWOT Analysis
10.6.19 Noctua Industrial Solutions
10.6.19.1 Company Overview & Snapshot
10.6.19.2 Product/Service Portfolio
10.6.19.3 Key Company Financials
10.6.19.4 SWOT Analysis
10.6.20 Midas Green Technologies.
10.6.20.1 Company Overview & Snapshot
10.6.20.2 Product/Service Portfolio
10.6.20.3 Key Company Financials
10.6.20.4 SWOT Analysis
11. Analyst Recommendations
11.1 SNS Insider Opportunity Map
11.2 Industry Low-Hanging Fruit Assessment
11.3 Market Entry & Growth Strategy
11.4 Analyst Viewpoint & Suggestions On Market Growth
12. Assumptions
13. Disclaimer
14. Appendix
14.1 List Of Tables
14.2 List Of Figures
An accurate research report requires proper strategizing as well as implementation. There are multiple factors involved in the completion of good and accurate research report and selecting the best methodology to compete the research is the toughest part. Since the research reports we provide play a crucial role in any company’s decision-making process, therefore we at SNS Insider always believe that we should choose the best method which gives us results closer to reality. This allows us to reach at a stage wherein we can provide our clients best and accurate investment to output ratio.
Each report that we prepare takes a timeframe of 350-400 business hours for production. Starting from the selection of titles through a couple of in-depth brain storming session to the final QC process before uploading our titles on our website we dedicate around 350 working hours. The titles are selected based on their current market cap and the foreseen CAGR and growth.
The 5 steps process:
Step 1: Secondary Research:
Secondary Research or Desk Research is as the name suggests is a research process wherein, we collect data through the readily available information. In this process we use various paid and unpaid databases which our team has access to and gather data through the same. This includes examining of listed companies’ annual reports, Journals, SEC filling etc. Apart from this our team has access to various associations across the globe across different industries. Lastly, we have exchange relationships with various university as well as individual libraries.
Step 2: Primary Research
When we talk about primary research, it is a type of study in which the researchers collect relevant data samples directly, rather than relying on previously collected data. This type of research is focused on gaining content specific facts that can be sued to solve specific problems. Since the collected data is fresh and first hand therefore it makes the study more accurate and genuine.
We at SNS Insider have divided Primary Research into 2 parts.
Part 1 wherein we interview the KOLs of major players as well as the upcoming ones across various geographic regions. This allows us to have their view over the market scenario and acts as an important tool to come closer to the accurate market numbers. As many as 45 paid and unpaid primary interviews are taken from both the demand and supply side of the industry to make sure we land at an accurate judgement and analysis of the market.
This step involves the triangulation of data wherein our team analyses the interview transcripts, online survey responses and observation of on filed participants. The below mentioned chart should give a better understanding of the part 1 of the primary interview.
Part 2: In this part of primary research the data collected via secondary research and the part 1 of the primary research is validated with the interviews from individual consultants and subject matter experts.
Consultants are those set of people who have at least 12 years of experience and expertise within the industry whereas Subject Matter Experts are those with at least 15 years of experience behind their back within the same space. The data with the help of two main processes i.e., FGDs (Focused Group Discussions) and IDs (Individual Discussions). This gives us a 3rd party nonbiased primary view of the market scenario making it a more dependable one while collation of the data pointers.
Step 3: Data Bank Validation
Once all the information is collected via primary and secondary sources, we run that information for data validation. At our intelligence centre our research heads track a lot of information related to the market which includes the quarterly reports, the daily stock prices, and other relevant information. Our data bank server gets updated every fortnight and that is how the information which we collected using our primary and secondary information is revalidated in real time.
Step 4: QA/QC Process
After all the data collection and validation our team does a final level of quality check and quality assurance to get rid of any unwanted or undesired mistakes. This might include but not limited to getting rid of the any typos, duplication of numbers or missing of any important information. The people involved in this process include technical content writers, research heads and graphics people. Once this process is completed the title gets uploader on our platform for our clients to read it.
Step 5: Final QC/QA Process:
This is the last process and comes when the client has ordered the study. In this process a final QA/QC is done before the study is emailed to the client. Since we believe in giving our clients a good experience of our research studies, therefore, to make sure that we do not lack at our end in any way humanly possible we do a final round of quality check and then dispatch the study to the client.
Key Segments:
By Component
Cold Plates
Coolant Distribution Units
Heat Exchangers
Pumps
Others
By Application
Data Centers
High-Performance Computing
Telecommunications
Others
By Cooling Type
Single-Phase
Two-Phase
By End-User
IT and Telecommunications
BFSI
Healthcare
Government
Others
Request for Segment Customization as per your Business Requirement: Segment Customization Request
Regional Coverage:
North America
US
Canada
Mexico
Europe
Germany
France
UK
Italy
Spain
Poland
Turkey
Rest of Europe
Asia Pacific
China
India
Japan
South Korea
Singapore
Australia
Taiwan
Rest of Asia Pacific
Middle East & Africa
UAE
Saudi Arabia
Qatar
South Africa
Rest of Middle East & Africa
Latin America
Brazil
Argentina
Rest of Latin America
Request for Country Level Research Report: Country Level Customization Request
Available Customization
With the given market data, SNS Insider offers customization as per the company’s specific needs. The following customization options are available for the report:
Detailed Volume Analysis
Criss-Cross segment analysis (e.g. Product X Application)
Competitive Product Benchmarking
Geographic Analysis
Additional countries in any of the regions
Customized Data Representation
Detailed analysis and profiling of additional market players