Disposable Cups Market Key Insights:
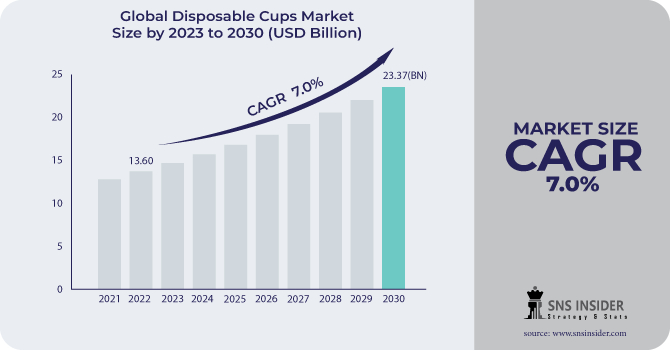
The Disposable Cups Market size was valued at USD 13.60 billion in 2022 and is expected to Reach USD 23.37 billion by 2030 and grow at a CAGR of 7 % over the forecast period of 2023-2030.
Demand for disposable cups is likely to rise in the upcoming years as quick service restaurants use them more frequently to serve hot and cold beverages. Additionally, it is anticipated that an increase in the number of commercial and residential events using these cups for water consumption will increase demand. The past ten years have seen a significant increase in the use of disposable cups. It is anticipated that consumer convenience will fuel product demand. The market is expected to be driven by rising urban and semi-urban demand for quick-service restaurants and a lack of water for washing utensils. It is predicted that increasing disposable income will further fuel product demand, along with shifting food trends that favour convenience.
Get PDF Sample Copy of Disposable Cups Market - Request Sample Report
If customers are concerned about breaking or carrying glasses, mugs, steins around, disposable cups are a great substitute. In the upcoming years, demand for disposable cups is likely to increase due to an increase in their use at social gatherings and celebrations. There are many uses for single-serving cups around the house. They are ideal for serving drink samples, giving kids portions that are appropriate for their size, and even serving adult beverages like espresso and cappuccino. As a result, many households around the world keep a stock of tiny disposable cups in the cabinet to stop the spread of germs when it's time to use mouthwash or toss back pills and gel caps. When combining paints, stains, or adhesives for DIY or craft projects, small cups come in handy as well. These elements are anticipated to support market expansion in the upcoming years.
Despite the optimistic outlook, disposable cups made of plastic or foam materials are very bad for the environment. Although they are quite practical, using such disposable cups also raises significant issues. Plastic harms wildlife, pollutes the environment, and takes an extraordinarily long time to decompose. More and more nations around the world are putting a stop to single-use plastics by imposing fees or, in some cases, outright bans.
MARKET DYNAMICS
KEY DRIVERS:
-
Beverage consumption play a role in driving the demand for disposable cups.
The market for disposable cups has been stimulated by the rising popularity of coffee, tea, and other beverages that can be consumed on-the-go. The market has expanded as a result of the rising demand for specialty beverages, smoothies, and cold drinks.
-
The market for disposable cups is growing because of rapid urbanization, hectic lifestyles, and an increase in the population of cities.
RESTRAIN:
-
Disposable cups may not align with certain cultural or regional preferences.
Traditional tableware or ceramic cups may be more deeply ingrained in some nations or regions' daily customs or cultural practices. These preferences may help to reduce the need for disposable cups in those areas.
OPPORTUNITY:
-
The growing awareness and concern about environmental issues.
Manufacturers now have the chance to provide sustainable substitutes for traditional disposable cups as a result of rising environmental awareness and concern. The demand for environmentally friendly alternatives can be satisfied by biodegradable or compostable cups made from materials like paper, bamboo, or plant-based plastics.
-
Market opportunities for disposable cups have been opened up by the growth of e-commerce and online food delivery services.
CHALLENGES:
-
The preference for reusable cups and mugs is growing, which puts pressure on the market for disposable cups.
-
In certain market segments, the demand for disposable cups may decline as consumers prioritize sustainability and cost-effectiveness and choose reusable alternatives.
IMPACT OF RUSSIA-UKRAINE WAR
The market for disposable cups may be significantly impacted by the ongoing conflict between Russia and Ukraine. The supply chain disruption is one of the main issues this conflict has brought up. There may be negative effects on production facilities, trade channels, and transportation networks, which could result in delays, shortages, and higher prices. If the argument worsens, it might stop the flow of raw materials, like paper or plastic, which are needed to make disposable cups. Manufacturers who depend heavily on imports from either nation might have trouble finding the necessary inputs, which could result in production delays or price increases.
Additionally, the demand for disposable cups may change depending on how consumers behave when there is conflict or financial uncertainty. People often prioritize necessities over discretionary purchases like disposable cups. This shift in consumer preferences may result in a decline in demand and sales, which will have an effect on the profitability of companies in the disposable cup market.
IMPACT OF ONGOING RECESSION
In the disposable cup market, a recession may cause market consolidation. While larger and more financially secure players may acquire or merge with smaller competitors, smaller or financially weaker businesses may find it difficult to maintain their operations. Smaller disposable cup manufacturers may face a more difficult competitive environment as a result of this consolidation's potential for market share concentration.
A recession has a significant negative impact on the foodservice sector, which is crucial to the demand for disposable cups. The demand for disposable cups used in restaurants, cafes, and fast-food chains may decline significantly as consumer spending declines and eating out becomes less popular. This may further reduce the amount of disposable cups sold.
A recession also frequently leads to cost-cutting measures being implemented by businesses, including those in the foodservice sector. This may entail encouraging the use of reusable alternatives while lowering costs for disposable items like cups. The demand for disposable cups could be adversely impacted as businesses cut costs.
KEY MARKET SEGMENTATION
By Raw Material
-
Paper
-
Foam
-
Plastic
-
Fiber
By Product Type
-
Packaging & Drinking Cups
-
Lids
-
Others
By End Use
-
Household
-
Institutional
-
Commercial
.png)
Get Customized Report as per Your Business Requiremrnt - Enquiry Now
REGIONAL ANALYSIS
With a market share of over 35% in 2022, Asia Pacific is in the lead and is predicted to grow at the fastest rate during the forecast period. This can be attributed to the growing urban population, shifting food consumption patterns, rising disposable income, and the opening of numerous global food chain restaurants and outlets. In developing nations like India, the western fast-food chain has shown encouraging growth rates, and it is likely that this trend will continue in the years to come. India's food-service sector is anticipated to grow at a CAGR of 9.7%. These elements are anticipated to significantly increase the demand for disposable cups in the upcoming years.
Over the forecast period, the North American region is anticipated to grow at a CAGR of 6%. Billions of customers attracted to the nation's expanding cafe and fast-food chains to drink coffee and other beverages. The US alone has 150 million people who drink coffee every day. After the lockdown restriction was loosened, a number of restaurants and coffee shops opened up, and as they grow in the upcoming years, there will likely be a significant demand for disposable cups.
REGIONAL COVERAGE
North America
-
US
-
Canada
-
Mexico
Europe
-
Eastern Europe
-
Poland
-
Romania
-
Hungary
-
Turkey
-
Rest of Eastern Europe
-
-
Western Europe
-
Germany
-
France
-
UK
-
Italy
-
Spain
-
Netherlands
-
Switzerland
-
Austria
-
Rest of Western Europe
-
Asia Pacific
-
China
-
India
-
Japan
-
South Korea
-
Vietnam
-
Singapore
-
Australia
-
Rest of Asia Pacific
Middle East & Africa
-
Middle East
-
UAE
-
Egypt
-
Saudi Arabia
-
Qatar
-
Rest of Middle East
-
-
Africa
-
Nigeria
-
South Africa
-
Rest of Africa
-
Latin America
-
Brazil
-
Argentina
-
Colombia
-
Rest of Latin America
Key Players
The Major Players are Benders Paper Cups, Go-Pak UK Ltd, DUNI AB, Huhtamäki Oyj, Berry Global Group Inc, ConverPack Inc, Genpak LLC, WestRock Company, Dart Container Corporation, Pactiv LLC and other players.
Go-Pak UK Ltd-Company Financial Analysis
RECENT DEVELOPMENTS
Footprint, The makers of on-the-go, BIY shakes and smoothies, f'real foods, and Footprint, a global materials science technology company dedicated to fostering a healthy planet, have teamed up to create a sustainable alternative to f'real's iconic dairy cup by utilizing Footprint's fiber-based solutions.
Good-Edi, In order to change how we consume caffeine sustainably, the co-founders of Good-Edi are hungry for growth after reaching the internal milestone of selling 200,000 edible coffee cups.
| Report Attributes | Details |
| Market Size in 2022 | US$ 13.60 Bn |
| Market Size by 2030 | US$ 23.37 Bn |
| CAGR | CAGR of 7 % From 2023 to 2030 |
| Base Year | 2022 |
| Forecast Period | 2023-2030 |
| Historical Data | 2020-2021 |
| Report Scope & Coverage | Market Size, Segments Analysis, Competitive Landscape, Regional Analysis, DROC & SWOT Analysis, Forecast Outlook |
| Key Segments | • by Raw Material (Paper, Foam, Plastic, Fiber) • by Product Type (Packaging & Drinking Cups, Lids, Others) • by End Use (Household, Institutional, Commercial) |
| Regional Analysis/Coverage | North America (US, Canada, Mexico), Europe (Eastern Europe [Poland, Romania, Hungary, Turkey, Rest of Eastern Europe] Western Europe] Germany, France, UK, Italy, Spain, Netherlands, Switzerland, Austria, Rest of Western Europe]), Asia Pacific (China, India, Japan, South Korea, Vietnam, Singapore, Australia, Rest of Asia Pacific), Middle East & Africa (Middle East [UAE, Egypt, Saudi Arabia, Qatar, Rest of Middle East], Africa [Nigeria, South Africa, Rest of Africa]), Latin America (Brazil, Argentina, Colombia Rest of Latin America) |
| Company Profiles | Benders Paper Cups, Go-Pak UK Ltd, DUNI AB, Huhtamäki Oyj, Berry Global Group Inc, ConverPack Inc, Genpak LLC, WestRock Company, Dart Container Corporation, Pactiv LLC |
| Key Drivers | • Beverage consumption play a role in driving the demand for disposable cups. • The market for disposable cups is growing because of rapid urbanization, hectic lifestyles, and an increase in the population of cities. |
| Market Opportunities | • The growing awareness and concern about environmental issues • Market opportunities for disposable cups have been opened up by the growth of e-commerce and online food delivery services. |
Frequently Asked Questions
Ans: Asia Pacific is in the lead and is predicted to grow at the fastest rate during the forecast period.
Ans: Key players in the Disposable Cups Market market are Benders Paper Cups, Go-Pak UK Ltd, DUNI AB, Huhtamäki Oyj, Berry Global Group Inc, ConverPack Inc, Genpak LLC, WestRock Company, Dart Container Corporation, Pactiv LLC.
Ans: The market for disposable cups is growing because of rapid urbanization, hectic lifestyles, and an increase in the population of cities.
Ans: The Disposable Cups Market size was USD 13.60 Bn in 2022 and is expected to Reach USD 23.37 Bn by 2030.
Ans: Disposable Cups Market is expected to grow at a CAGR of 7 % over the forecast period of 2023-2030.
Get in Touch
