Disposable Straw Market Report Scope And Overview:
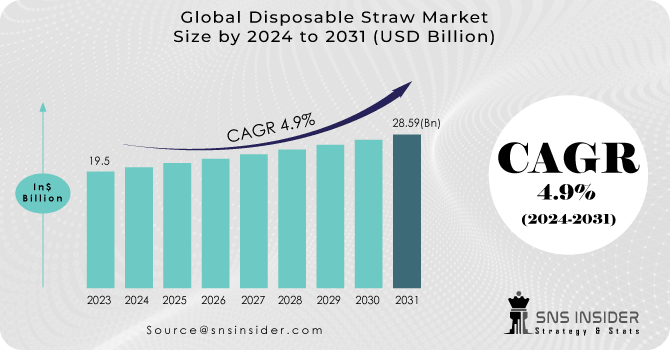
The Disposable Straw Market size was USD 19.5 billion in 2023 and is expected to Reach USD 28.59 billion by 2031 and grow at a CAGR of 4.9% over the forecast period of 2024-2031.
A notable trend observed in the Disposable Straw market is the growing preference for environmentally sustainable and eco-friendly products. Additionally, there is a noticeable increase in the integration of technology to enhance both the quality and efficiency of these products. Projections indicate substantial growth in the sustainable straw market, fueled by increased consumer awareness. The changing preferences of consumers, along with heightened regulations and corporate efforts to minimize plastic waste, are compelling industry participants to adjust accordingly.
Get More Information on Disposable Straw Market - Request Sample Report
Governments and organizations globally are enacting regulations and initiatives aimed at minimizing the consumption of disposable plastic items like straws. Numerous nations have already implemented bans or limitations on plastic straw usage, resulting in a decrease in demand for this particular product. In 2019, the European Union enacted a directive prohibiting several single-use plastic items, such as plastic straws, while promoting the adoption of more sustainable alternatives.
MARKET DYNAMICS
KEY DRIVERS:
-
Consumers are increasingly prioritizing sustainability in their purchasing decisions, seeking out products that align with their values and support environmentally friendly practices.
A growing emphasis on sustainability is significantly influencing consumer choices, including the types of straws they prefer. Consumers are increasingly seeking products that minimize their environmental impact, extending this focus to their straw selection. This trend presents a compelling opportunity for manufacturers and suppliers. They are actively developing and marketing eco-conscious straw options to cater to this rising demand for sustainable alternatives.
-
Global information dissemination and advocacy campaigns are vital for educating and engaging individuals worldwide on diverse topics.
RESTRAIN:
-
Resistance to change presents a significant hurdle for both consumers and businesses when transitioning from conventional plastic straws to sustainable alternatives.
-
Cost disparity can hinder the widespread adoption of sustainable options, posing a challenge to efforts aimed at reducing plastic waste and promoting environmental sustainability.
OPPORTUNITY:
-
Expansion into emerging markets presents significant growth opportunities for the global Disposable Straw Market.
As economies in these regions continue to develop, disposable incomes are on the rise, and consumer preferences are shifting towards sustainable products. Companies can capitalize on this trend by venturing into these untapped markets, strategically expanding their presence and product offerings. By doing so, businesses have the opportunity to establish themselves early in these developing economies, potentially securing a competitive advantage and fostering long-term growth.
-
Material development innovation in the global straw market offers promising avenues for advancement.
CHALLENGES:
-
Maintaining consistent quality and durability in eco-friendly straw alternatives is critical.
-
Improper disposal or lack of recycling can have detrimental effects on the environment.
IMPACT OF RUSSIAN UKRAINE WAR
Political and economic instability, stemming from the ongoing conflict, has led to a decrease in consumer purchasing power within the region. This could result in fluctuations in demand for disposable straws as consumers adjust their spending habits in response to uncertain economic conditions. It's worth highlighting that Disposable Straws are deemed essential items, and with the situation becoming more stable, there's an anticipated resurgence in demand for these products. In such a context, prominent manufacturers with varied customer demographics, adaptable production capabilities, and robust financial resources are positioned to reap the most benefits, as they can effectively navigate through extended periods of unpredictability.
IMPACT OF ECONOMIC SLOWDOWN
As economic activity decelerates, there's a likelihood of significant consequences on both the pricing and accessibility of products. With decreased consumer spending power, businesses might be compelled to adjust their pricing strategies, potentially lowering prices to stimulate demand or increasing them to offset reduced revenue streams. Additionally, supply chain disruptions stemming from financial constraints could lead to shortages or delays in product availability. Consequently, consumers may face challenges in accessing certain goods or experience fluctuations in prices as businesses navigate the economic slowdown.
KEY MARKET SEGMENTS
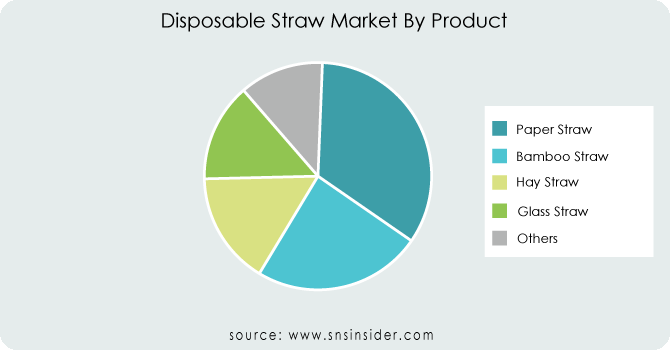
By Product
-
Paper Straw
-
Bamboo Straw
-
Hay Straw
-
Glass Straw
-
Others
The paper straw segment holds the dominant position in the product segment of the global disposable straw market with share 35.8%. Paper straws are primarily utilized in the foodservice industry, and their demand is fueled by the rising number of food outlets and eateries driven by population growth and urbanization. Crafted from premium paper, the gluten-free straws are versatile, suitable for various beverages, and boast a lifespan of approximately four hours.
Get Customized Report as per Your Business Requirement - Request For Customized Report
By Distribution
-
Online
-
Offline
Traditional retail outlets, restaurant suppliers, and wholesale distributors are expected to retain the largest portion of the disposable straw market share. This is attributed to their well-established distribution channels and bulk procurement methods prevalent in the foodservice sector, which is a significant consumer of disposable straws. Online sales of disposable straws, particularly eco-friendly options, are likely experiencing significant growth. Increasing consumer preference for eco-conscious products and the wider variety available online.
By Application
-
Hotels
-
Restaurants and Motels
-
Cafes
-
Bars and Lounges
-
Others
Restaurants and Motels are likely the largest application segment for disposable straws due to the high volume of beverage service in these establishments. Cafes are another major user of disposable straws, particularly for cold beverages like iced coffees or smoothies. Hotels likely use disposable straws to some extent, but their market share might be smaller.
By End Use
-
Foodservice
-
Institutional
-
Households
Food service sector is expected to maintain its dominant position in the market. With growing awareness of the adverse environmental impact of plastic straws, an increasing number of eateries are seeking out eco-friendly alternatives. Environmentally conscious customers often favor paper straws as a sustainable option.
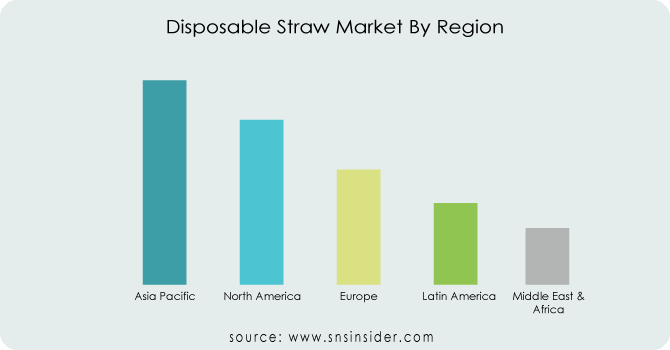
REGIONAL ANALYSIS
The Asia-Pacific region holds a significant lead in the global straw market, primarily owing to the substantial presence of straw manufacturers experiencing significant revenue generation. Moreover, the increasing consumer inclination towards eco-friendly and health-conscious straw options is expected to further propel the growth of the global straw market. For instance, the supply chain of paper straws in the Asia-Pacific region could face influences from the accessibility and sourcing of sustainable raw materials. Additionally, regional logistics and production capacity play a role in determining the distribution of paper straws.
Europe is projected to experience the most rapid expansion in the global straw market, driven by the flourishing functional beverage sector and rapid advancement in E-commerce. Additionally, the growth of the foodservice industry and increasing sales of energy drinks are expected to contribute significantly to the expansion of the straw market in the region. The country-specific segment of the report also offers insights into distinct market influencers and regulatory shifts within domestic markets, affecting both present conditions and future trends in the market.
REGIONAL COVERAGE:
North America
-
US
-
Canada
-
Mexico
Europe
-
Eastern Europe
-
Poland
-
Romania
-
Hungary
-
Turkey
-
Rest of Eastern Europe
-
-
Western Europe
-
Germany
-
France
-
UK
-
Italy
-
Spain
-
Netherlands
-
Switzerland
-
Austria
-
Rest of Western Europe
-
Asia Pacific
-
China
-
India
-
Japan
-
South Korea
-
Vietnam
-
Singapore
-
Australia
-
Rest of Asia Pacific
Middle East & Africa
-
Middle East
-
UAE
-
Egypt
-
Saudi Arabia
-
Qatar
-
Rest of Middle East
-
-
Africa
-
Nigeria
-
South Africa
-
Rest of Africa
-
Latin America
-
Brazil
-
Argentina
-
Colombia
-
Rest of Latin America
Key players
Major players in Disposable Straw Market are Soton Daily Necessities Co. Ltd., Charta Global, BYGREEN, Hoffmaster Group Inc., Royal Paper Industries, Transcend Packaging, Footprint, Huhtamaki Oyj, Canada Brown Eco Products Ltd, Y. W., and others.
Soton Daily Necessities Co. Ltd- Company Financial Analysis
RECENT DEVELOPMENT
-
On November 17, 2021, SIG introduced three fresh additions to its lineup of paper drinking straws, aimed at aiding beverage manufacturers in reducing their reliance on single-use plastic. Among these innovations are distinctive telescopic straws, boasting a 4.6mm diameter and a flexible length ranging from 102mm to 165mm when extended. These biodegradable straws are fully recyclable and are particularly compatible with compact carton packaging.
-
On November 16, 2021, SIG expanded its range of paper straws, offering beverage manufacturers additional choices for a straightforward and eco-friendly alternative to single-use plastic straws.
| Report Attributes | Details |
| Market Size in 2023 | US$ 19.5 Billion |
| Market Size by 2031 | US$ 28.59 Billion |
| CAGR | CAGR of 4.9% From 2024 to 2031 |
| Base Year | 2023 |
| Forecast Period | 2024-2031 |
| Historical Data | 2020-2022 |
| Report Scope & Coverage | Market Size, Segments Analysis, Competitive Landscape, Regional Analysis, DROC & SWOT Analysis, Forecast Outlook |
| Key Segments | • By Product (Paper Straw, Bamboo Straw, Hay Straw, Glass Straw, Others) • By Distribution (Online, Offline) • By Application (Hotels, Restaurants And Motels, Cafes, Bars And Lounges, Others) • By End Use (Foodservice, Institutional, Households) |
| Regional Analysis/Coverage | North America (US, Canada, Mexico), Europe (Eastern Europe [Poland, Romania, Hungary, Turkey, Rest of Eastern Europe] Western Europe] Germany, France, UK, Italy, Spain, Netherlands, Switzerland, Austria, Rest of Western Europe]), Asia Pacific (China, India, Japan, South Korea, Vietnam, Singapore, Australia, Rest of Asia Pacific), Middle East & Africa (Middle East [UAE, Egypt, Saudi Arabia, Qatar, Rest of Middle East], Africa [Nigeria, South Africa, Rest of Africa], Latin America (Brazil, Argentina, Colombia, Rest of Latin America) |
| Company Profiles | Soton Daily Necessities Co. Ltd., Charta Global, BYGREEN, Hoffmaster Group Inc., Royal Paper Industries, Transcend Packaging, Footprint, Huhtamaki Oyj, Canada Brown Eco Products Ltd, Y. W. |
| Key Drivers | • Consumers are increasingly prioritizing sustainability in their purchasing decisions, seeking out products that align with their values and support environmentally friendly practices. • Global information dissemination and advocacy campaigns are vital for educating and engaging individuals worldwide on diverse topics. |
| Market Opportunities | • Expansion into emerging markets presents significant growth opportunities for the global Disposable Straw Market. • Material development innovation in the global straw market offers promising avenues for advancement. |
Frequently Asked Questions
Ans: The Asia-Pacific region dominating the Disposable Straw Market by 42.8%.
Ans: Resistance to change presents a significant hurdle for both consumers and businesses can limit growth.
Ans: Consumers are increasingly prioritizing sustainability in their purchasing decisions are a key driver of growth in the Disposable Straw Market.
Ans: Disposable Straw Market size was USD 19.5 billion in 2023 and is expected to Reach USD 28.59 billion by 2031.
Ans: The Disposable Straw Market is expected to grow at a CAGR of 4.9%.
Get in touch
