Drowning Detection System Market Report Scope & Overview:

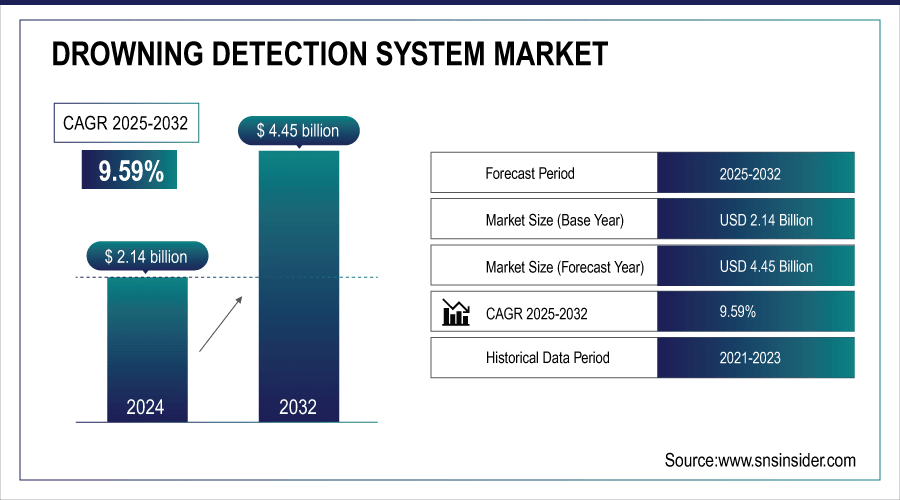
The Drowning Detection System Market Size was valued at USD 2.14 billion in 2024 and is expected to reach USD 4.45 billion by 2032 and grow at a CAGR of 9.59% over the forecast period 2025-2032.

The growth of the Drowning Detection System market is primarily driven by the increasing global emphasis on water safety and preventive technology adoption. Rising awareness among governments, commercial pool operators, resorts, schools, and private pool owners regarding the risks of drowning has accelerated demand for intelligent surveillance and detection solutions. Regulatory frameworks in developed regions, such as mandatory pool safety standards and liability mitigation laws, further encourage the deployment of advanced detection systems. According to study, AI-powered revenue management systems can boost revenue per available room (RevPAR) by 15-20%.
Drowning-Detection-System-Market

To Get More Information On Drowning Detection System Market - Request Free Sample Report

Drowning Detection System Market Trends

  • Rising awareness of water safety among parents, schools, resorts, and pool operators is driving adoption of drowning detection systems.

  • Increasing incidents of accidental drowning, especially among children, are prompting real-time alert solutions.

  • Regulatory support and public safety campaigns are encouraging widespread deployment of detection systems.

  • Advanced AI, machine learning, and IoT integration improve detection accuracy and reduce false alarms.

  • Wearable devices and smart bracelets are increasingly used in recreational and open-water environments.

  • Remote monitoring, centralized dashboards, and mobile alerts enhance operational efficiency across multiple facilities.

  • Affordable and accessible technology enables expansion across schools, resorts, water parks, and residential pools.

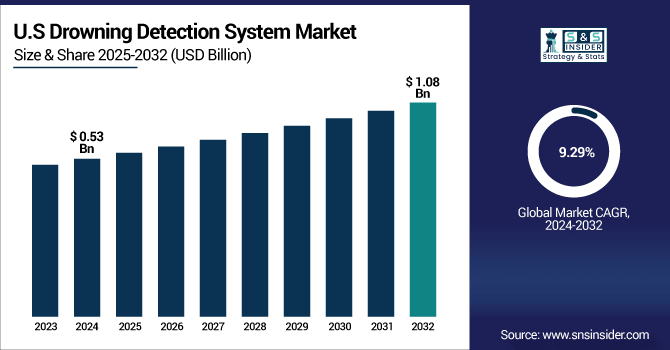
The U.S. Drowning Detection System Market size was USD 0.53 billion in 2024 and is expected to reach USD 1.08 billion by 2032, growing at a CAGR of 9.29% over the forecast period of 2025-2032. Due to including rising drowning incidents, particularly among children, and the adoption of advanced technologies such as AI-powered surveillance systems and wearable devices.
Drowning-Detection-System-Market-US

Drowning Detection System Market Growth Drivers:

  • Rising Awareness of Water Safety and AI-Driven Solutions Propel Drowning Detection System Market Growth

A key driver for the drowning detection system market is the increasing awareness among the parents, pool operators, schools, resort as well as government about the water safety. Increasing occurrences of accidental drowning, specifically among the children, have driven players to choose smart detection systems that can alert lifeguards or guardians in real time. It helps in reducing the response time by communicating through advanced AI based systems, wearable devices, and IoT enabled monitoring platforms. This is leading to the collective adoption from the market which is propelled by regulatory support and public safety, broadening the demand for commercial and residential aquatic safety.

Drowning incidents in the U.S.: Over 4,000 unintentional drowning deaths annually, with children aged 1–4 being the most affected.

Drowning Detection System Market Restraints:

  • High Installation and Maintenance Costs Pose Significant Restraints

The need for high cost installation cost along with installation & maintenance coast of drowning detection systems is the serious restraints to the global drowning detection systems market. Advanced camera-based or sensor-integrated solutions involve significant upfront expenditures for hardware, software, and connectivity systems. Furthermore, routine maintenance, calibration, and updates to AI algorithms add to operational costs. This makes it prohibitively space expensive for small-scale pool owners or most community facilities, resulting in limited uptake. Growing awareness of water safety does not translate into market penetration since integration with existing aquatic infrastructure in some regions is often a challenge.

Drowning Detection System Market Opportunities:

  • AI, IoT, and Wearable Innovations Unlock Growth Opportunities in Drowning Detection Systems

Technological innovations in AI, machine learning, and IoT present significant opportunities for market growth. Modern systems can distinguish between real drowning incidents and false alarms, improving accuracy and safety. IoT connectivity allows for remote monitoring, centralized dashboards, and mobile alerts, enabling operators to oversee multiple facilities simultaneously. In recreational and open-water contexts, there is growing use of wearable devices and smart bracelets for swimmers as well. These affordable technologies will open up the market potential for manufacturers from schools, resorts, and water parks to residential pools.

Over 60% of newly deployed pool safety systems in 2024 incorporated IoT-enabled dashboards for remote supervision.”

Drowning Detection System Market Segment Analysis

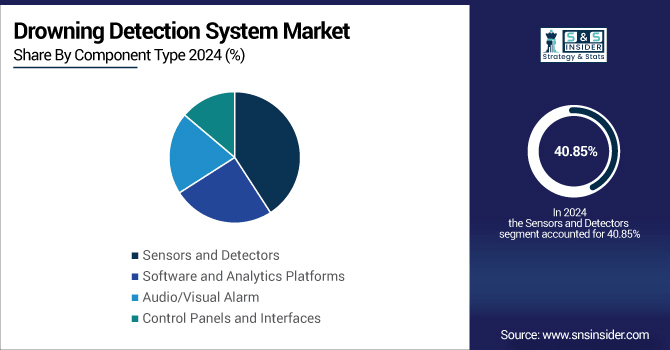
  • By Component Type, Sensors and Detectors led with ~41% share in 2024; Software and Analytics Platforms fastest growing (CAGR 10.52%).
  • By Technology Type, Fixed Surveillance Systems dominated ~40% in 2024; Drones and Aerial Surveillance in growing (CAGR 11.02%).
  • By Deployment Mode, On-premise Solutions led ~45.10% in 2024, Cloud-based Solutions fastest growing (CAGR 10.13%).
  • By Application Area, Public Swimming Pools led ~40% in 2024, Beaches and Lakes fastest growing (CAGR 11.07%).
  • By End-User, Commercial Water Activity Providers led ~30% in 2024, Government and Municipal Bodies fastest growing (CAGR 10.45%).

By Component Type, Sensors and Detectors Leads Market While Software and Analytics Platforms Fastest Growth

In 2024, sensors and detectors will lead the drowning detection system market, providing critical real-time monitoring through camera-based systems, underwater sensors, and wearable devices. These elements have gained broad acceptance in commercial pools, water parks, resorts, and schools and homes, delivering early detection of drowning events and improving safety. During the same period, software and analytics platforms are expected to witness the fastest growth from 2025 to 2032, driven by AI-powered monitoring, machine learning algorithms, and IoT integration. The availability of these platforms enhances detection accuracy, reduces false alarms, enables remote supervision and extend actionable insights, thus making them indispensable for operators looking for efficient data-centric safety solutions across multiple aquatic environments.
Drowning-Detection-System-Market-By-Component-Type

By Technology Type, Fixed Surveillance Systems Leads Market While Drones and Aerial Surveillance Fastest Growth

In 2024, fixed surveillance systems will dominate the segment of the drowning detection system market, with real-time and continuous monitoring through stationary cameras and sensors installed in pools, water parks, resorts and schools. These systems Offering extremely reliable, predictable coverage and instantaneous alerts to drowning events, these systems tend to be used in commercial and public aquatic facilities. During the same period, drones and aerial surveillance technologies are expected to witness the fastest growth from 2025 to 2032, driven by their mobility, robust monitoring of large outdoor water bodies, and integration with AI analytics over the same period. This allows for a fast response, increased coverage in open-water environments, and actionable intelligence for an operator that is looking for additional, flexible monitoring capabilities.

By Deployment Mode, On-premise Solutions Leads Market While Cloud-based Solutions Fastest Growth

In 2024, On-premise solutions to account for majority share in the drowning detection system market, offering facilities with localized control, improved data security, and lower dependence on the internet. These solutions are popular where security and the ability to respond immediately are highly important; such as in high-security pools, schools, resorts and commercial aquatic facilities. During the same period, cloud-based solutions are expected to witness the fastest growth from 2025 to 2032, owing to the benefits which include remote monitoring, centralized management, scalability and minimal up-front infrastructure costs. cloud platforms allow operators to monitor multiple facilities in near real-time, utilize AI analytics within a cloud, pre-emptively establish safety measures and enhance operational efficiency across various aquaculture environments.

By Application Area, Public Swimming Pools Leads Market While Beaches and Lakes Fastest Growth

In 2024, public swimming pools is dominated to the drowning detection system market, owing to their high visitor volume and the critical need for continuous safety monitoring. These facilities widely adopt camera-based systems, sensors, and wearables to ensure rapid detection of drowning incidents, improve lifeguard response times, and comply with regulatory safety standards. During the same period, beaches and lakes are expected to witness the fastest growth from 2025 to 2032, driven by increasing recreational water activities, tourism expansion, and the deployment of advanced AI-enabled drones, wearable devices, and remote monitoring platforms. These solutions provide flexible, large-area coverage and actionable insights, enhancing safety in open-water environments.

By End-User, Commercial Water Activity Providers Leads Market While Government and Municipal Bodies Fastest Growth

In 2024, commercial water activity providers will dominate the market for drowning detection systems, with the operators of water parks, resorts, hotels and private aquatic facilities emphasizing safety and the need for compliance with regulations. End-users which are widely using these products are deploying in a large number of advanced sensors, fixed surveillance type systems, and wearable devices to monitor high-trafficked areas, minimize the chances of fatal drowning, and secure fast emergency assistance. During the same period, government and municipal bodies are expected to witness the fastest growth from 2025 to 2032, driven by increasing public investments in community pools, recreational water facilities, and coastal safety programs. The adoption of AI-enabled monitoring tools, IoT powered platforms, and drones assist in public water body monitoring, rendering safety and local body management of the site more efficiently.

North America Drowning Detection System Market Insights:

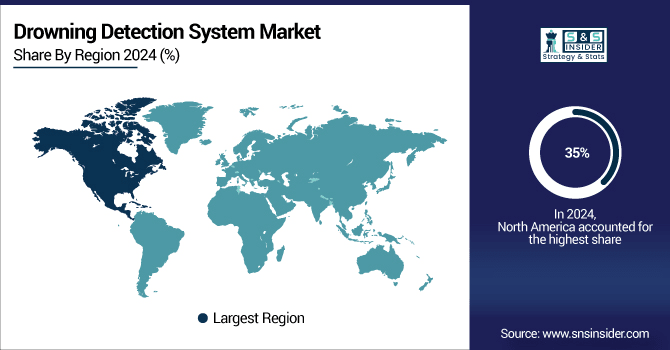
In 2024, North America held a 35% share of the drowning detection system market, due to high water safety awareness, stringent regulations related to pool safety measures, and technology adoption. AI-enabled sensors, cameras, and portable devices are being installed in many public pools, water parks, resorts, and schools to enhance safety and drown prevention efforts. Its strong infrastructure, government support and high infrastructural investments for recreational and commercial aquatic facilities have made the region a leading market.
Drowning-Detection-System-Market-By-Region

Get Customized Report as Per Your Business Requirement - Enquiry Now

U.S. Leads Drowning Detection System Market with Policy Support and Technological Adoption

The U.S. leads the region due to Strong regulatory policies, high investment in AI based surveillance systems and strong adoption of IoT based drowning detection systems. Over 4,000 drowning deaths annually have accelerated adoption in public and private pools. The real-time alerts, wearable devices, and AI analytics help to ensure better response times and efficient operations across schools, resorts, and commercial facilities. Market expansion is further aided by government initiatives and public safety campaigns.

Asia-Pacific Drowning Detection System Market Insights

In 2024, The Asia-Pacific region was the most rapidly growing market, with a 10.84% share due, to rapid urbanisation, growth in water-related recreational activities and rising awareness about pedestrian safety on and around water bodies. In an effort to improve monitoring and preventive safety measures in pools, resorts and beaches, countries like China, India, Japan and Australia are readily incorporating AI-powered sensors, wearable devices and analytics platforms. The further development of tourism and leisure infrastructure on the back of rising tourism also offers strong growth opportunities.

China and India Drive Rapid Growth in Drowning Detection System Market

China and India are witnessing strong growth due to large-scale public and private pool installations, resorts, and water parks. Verticals such as government safety regulations, awareness campaigns, and rise in adoption of AI- and IoT-enabled systems will contribute to market growth. Moreover, a growing investment in development of smart monitoring solutions and recreational facilities boosts the uptake of drowning detection systems in region.

Europe Drowning Detection System Market Insights

In 2024, Europe accounted for of the market, owing to an established infrastructure, high rate of safety regulations, and a demand for intelligent monitoring across public pools, hotels and recreational facilities. Germany, the U.K., and France have already introduced technology such as AI-enabled sensors, fixed surveillance, and even wearable devices to improve safety and prevent drownings.

Germany Leads Europe in Drowning Detection System Market Growth

Germany and the U.K. lead adoption due to high penetration of AI-powered and IoT-enabled drowning detection systems. At real-time monitoring, analytics and wearable like establish use in public pools, resorts and schools ensure to speed up response actions during emergencies. This is further supported by the penetration of sound regulatory frameworks and safety campaigns, along with the deployment of existing technologies to optimally operate them, to ensure maximum operational efficiency.

Latin America (LATAM) and Middle East & Africa (MEA) Drowning Detection System Market Insights

In 2024, Latin America and the Middle East & Africa (MEA) together witnessed steady growth in the Drowning Detection System Market, driven by rising investments in recreational water infrastructure, tourism expansion, and growing awareness of aquatic safety. Latin America benefits from the expansion of resorts, commercial pools, and urban recreational facilities, while MEA leverages luxury resorts, hotels, and government-supported safety initiatives.

Competitive Landscape for Drowning Detection System Market

SwimEye is a Norway-based provider of underwater drowning detection systems, offering AI-powered monitoring platforms that use cameras and object recognition to alert lifeguards in real time. The company focuses on improving swimmer safety and lifeguard efficiency in commercial pools, aquatic centers, and recreational facilities.

  • In May 2025, SwimEye announced the upcoming release of Version 5 of its underwater monitoring system, scheduled for late 2025, promising enhanced features for swimmer safety and lifeguard efficiency.

WAVE Systems is a U.S.-based provider of drowning prevention solutions, specializing in wearable tracking technology that monitors swimmers’ activity and alerts staff to emergencies. The company focuses on creating real-time monitoring systems for pools, waterparks, and open-water environments to improve safety and reduce risks.

  • In March 2025, WAVE introduced its GUARDian system, employing wearable tracking devices for swimmers and lifeguards to monitor underwater activity in real time and alert staff to potential drowning incidents.

Sentag is a Sweden-based developer of drowning detection technologies, offering wristband-based systems that track swimmers’ depth and duration in water. The company focuses on enhancing aquatic safety by equipping pools and leisure facilities with intelligent early-warning systems for lifeguards.

  • In June 2025, Sentag introduced a wristband-based drowning detection system that monitors swimmers' depths and durations, alerting staff if preset thresholds are exceeded, enhancing safety measures in aquatic environments.

Drowning detection system market Key Players:

Some of the drowning detection system market Companies

  • SwimEye

  • AngelEye

  • WAVE Systems

  • Coral Detection Systems (MYLO)

  • Poseidon Technologies

  • Sentag

  • Poolview Limited

  • Variopool B.V.

  • SEAL SwimSafe

  • Lifeguard AI

  • Blueguard

  • AquaEye (VodaSafe)

  • diWatch

  • Poolwatch

  • Mobotix

  • AquaGuard

  • SafeWave

  • AquaSense

  • Poolview Technologies

  • Lynxight

Drowning Detection System Market Report Scope:

Report Attributes Details
Market Size in 2024 USD 2.14 Billion
Market Size by 2032 USD  4.45 Billion
CAGR CAGR of 9.59 % From 2025 to 2032
Base Year 2024
Forecast Period 2025-2032
Historical Data 2021-2023
Report Scope & Coverage Market Size, Segments Analysis, Competitive  Landscape, Regional Analysis, DROC & SWOT Analysis, Forecast Outlook
Key Segments •By Component Type (Sensors and Detectors, Software and Analytics Platforms, Audio/Visual Alarms, and Control Panels and Interfaces)
•By Technology Type (Wearable Devices, Fixed Surveillance Systems, Drones and Aerial Surveillance, and Mobile Applications)
•By Deployment Mode (On-premise Solutions, Cloud-based Solutions, Hybrid Deployment Models, and Managed Services)
•By Application Area (Residential Swimming Pools, Public Swimming Pools, Water Parks, and Beaches and Lakes)
•By End-User (Homeowners, Commercial Water Activity Providers, Government and Municipal Bodies, and Tourism and Hospitality Sector)
Regional Analysis/Coverage North America (US, Canada, Mexico), Europe (Germany, France, UK, Italy, Spain, Poland, Turkey, Rest of Europe), Asia Pacific (China, India, Japan, South Korea, Singapore, Australia, Taiwan,  Rest of Asia Pacific), Middle East & Africa (UAE, Saudi Arabia, Qatar, South Africa, Rest of Middle East & Africa), Latin America (Brazil, Argentina, Rest of Latin America)
Company Profiles SwimEye, AngelEye, Lynxight, WAVE Systems, Coral Detection Systems (MYLO), Poseidon Technologies, Sentag, Poolview Limited, Variopool B.V., SEAL SwimSafe, Lifeguard AI, Blueguard, AquaEye (VodaSafe), diWatch, Poolwatch, Mobotix, AquaGuard, SafeWave, AquaSense, Poolview Technologies, and Others.

Table Of Contents

1. Introduction

1.1 Market Definition & Scope

 1.2 Research Assumptions & Abbreviations

 1.3 Research Methodology

2. Executive Summary

2.1 Market Snapshot

 2.2 Market Absolute $ Opportunity Assessment & Y-o-Y Analysis, 2021–2032

 2.3 Market Size & Forecast, By Segmentation, 2021–2032

  2.3.1 Market Size By Component Type

  2.3.2 Market Size By Technology Type

         2.3.2 Market Size By Deployment Mode

         2.3.2 Market Size By Application Area

         2.3.2 Market Size By End-User

 2.4 Market Share & BPS Analysis By Region, 2024

 2.5 Industry Growth Scenarios – Conservative, Likely & Optimistic

 2.6 Industry CxO’s Perspective

3. Market Overview

3.1 Market Dynamics

  3.1.1 Drivers

  3.1.2 Restraints

  3.1.3 Opportunities

  3.1.4 Key Market Trends

 3.2 Industry PESTLE Analysis

 3.3 Key Industry Forces (Porter’s) Impacting Market Growth

 3.4 Industry Supply Chain Analysis

  3.4.1 Raw Material Suppliers

  3.4.2 Manufacturers

  3.4.3 Distributors/Suppliers

  3.4.4 Customers/End-Users

 3.5 Industry Life Cycle Assessment

 3.6 Parent Market Overview

 3.7 Market Risk Assessment

4. Statistical Insights & Trends Reporting

4.1 Market Share & Ranking Statistics

 4.1.1 Overview

 4.1.2 Market Share Analysis By Company

 4.1.3 Market Share Analysis By Region

 4.1.4 Ranking of Key Players

4.2 Growth & Trend Statistics

 4.2.1 Overview

 4.2.2 Year-on-Year Growth Trends By Segment

 4.2.3 Technology Adoption Trends

 4.2.4 End-Use Industry Adoption Trends

4.3 Pricing & Revenue Metrics

 4.3.1 Overview

 4.3.2 Pricing Trends By Detection Technology

 4.3.3 Price Benchmarking By Key Players

 4.3.4 Revenue Contribution By Product Line

4.4 Operational & Performance Metrics

 4.4.1 Overview

 4.4.2 Production Volume By Region

 4.4.3 Capacity Utilization Rates

 4.4.4 Domestic vs. Export Consumption Ratios

4.5 Supply Chain & Trade Statistics

 4.5.1 Overview

 4.5.2 Import Analysis By Country

 4.5.3 Export Analysis By Country

 4.5.4 Raw Material Availability & Pricing Trends

 4.5.5 Supply Chain Concentration Index

4.6 Investment & Financing Statistics

 4.6.1 Overview

 4.6.2 Venture Capital & Private Equity Investments

 4.6.3 Mergers & Acquisitions Analysis

 4.6.4 Expansion & Infrastructure Investments

5. Thermal Printable Wristband Market Segmental Analysis & Forecast, By Component Type, 2021 – 2032, Value (USD Billion)

5.1 Introduction

 5.2 Sensors and Detectors

  5.2.1 Key Trends

  5.2.2 Market Size & Forecast, 2021 – 2032

 5.3 Software and Analytics Platforms

  5.3.1 Key Trends

  5.3.2 Market Size & Forecast, 2021 – 2032

     5.2 Audio/Visual Alarm

  5.2.1 Key Trends

  5.2.2 Market Size & Forecast, 2021 – 2032

 5.3 Control Panels and Interfaces

  5.3.1 Key Trends

  5.3.2 Market Size & Forecast, 2021 – 2032

6. Thermal Printable Wristband Market Segmental Analysis & Forecast, By Technology Type, 2021 – 2032, Value (USD Billion)

    6.1 Introduction

 6.2 Wearable Devices

  6.2.1 Key Trends

  6.2.2 Market Size & Forecast, 2021 – 2032

 6.3 Fixed Surveillance Systems

  6.3.1 Key Trends

  6.3.2 Market Size & Forecast, 2021 – 2032

 6.4 Drones and Aerial Surveillance

  6.4.1 Key Trends

  6.4.2 Market Size & Forecast, 2021 – 2032

6.4 Mobile Applications

  6.4.1 Key Trends

  6.4.2 Market Size & Forecast, 2021 – 2032

7. Thermal Printable Wristband Market Segmental Analysis & Forecast, By Deployment Mode, 2021 – 2032, Value (USD Billion)

    7.1 Introduction

 7.2 On-premise Solutions

  7.2.1 Key Trends

  7.2.2 Market Size & Forecast, 2021 – 2032

 7.3 Cloud-based Solutions

  7.3.1 Key Trends

  7.3.2 Market Size & Forecast, 2021 – 2032

   7.4 Hybrid Deployment Models

  7.4.1 Key Trends

  7.4.2 Market Size & Forecast, 2021 – 2032

7.4 Managed Services

  7.4.1 Key Trends

  7.4.2 Market Size & Forecast, 2021 – 2032

8. Thermal Printable Wristband Market Segmental Analysis & Forecast, By Application Area, 2021 – 2032, Value (USD Billion)

    8.1 Introduction

 8.2 Residential Swimming Pools

  8.2.1 Key Trends

  8.2.2 Market Size & Forecast, 2021 – 2032

 8.3 Public Swimming Pools

  8.3.1 Key Trends

  8.3.2 Market Size & Forecast, 2021 – 2032

 8.4 Water Parks

  8.4.1 Key Trends

  8.4.2 Market Size & Forecast, 2021 – 2032

 8.5 Beaches and Lakes

  8.5.1 Key Trends

  8.5.2 Market Size & Forecast, 2021 – 2032

9. Thermal Printable Wristband Market Segmental Analysis & Forecast, By End-User, 2021 – 2032, Value (USD Billion)

    9.1 Introduction 

  9.2 Homeowners

   9.2.1 Key Trends 

   9.2.2 Market Size & Forecast, 2021 – 2032 

  9.3 Commercial Water Activity Providers

   9.3.1 Key Trends 

   9.3.2 Market Size & Forecast, 2021 – 2032 

         9.4 Government and Municipal Bodies

   9.4.1 Key Trends   

   9.4.2 Market Size & Forecast, 2021 – 2032 

         9.5 Tourism and Hospitality Sector

   9.5.1 Key Trends 

   9.5.2 Market Size & Forecast, 2021 – 2032 

10. Thermal Printable Wristband Market Segmental Analysis & Forecast By Region, 2021 – 2032, Value (USD Billion)

 10.1 Introduction

 10.2 North America

  10.2.1 Key Trends

  10.2.2 Thermal Printable Wristband Market Size & Forecast, By Component Type, 2021 – 2032

  10.2.3 Thermal Printable Wristband Market Size & Forecast, By Technology Type, 2021 – 2032

  10.2.4 Thermal Printable Wristband Market Size & Forecast, By Deployment Mode, 2021 – 2032

  10.2.5 Thermal Printable Wristband Market Size & Forecast, By Application Area, 2021 – 2032

  10.2.6 Thermal Printable Wristband Market Size & Forecast, By End-User, 2021 – 2032

  10.2.7 Thermal Printable Wristband Market Size & Forecast, By Country, 2021 – 2032

   10.2.7.1 USA

    10.2.7.1.1 Thermal Printable Wristband Market Size & Forecast, By Component Type, 2021 – 2032

    10.2.7.1.2 Thermal Printable Wristband Market Size & Forecast, By Technology Type, 2021 – 2032

    10.2.7.1.3 Thermal Printable Wristband Market Size & Forecast, By Deployment Mode, 2021 – 2032

    10.2.7.1.4 Thermal Printable Wristband Market Size & Forecast, By Application Area, 2021 – 2032

    10.2.7.1.5 Thermal Printable Wristband Market Size & Forecast, By End-User, 2021 – 2032

   10.2.7.2 Canada

    10.2.7.2.1 Thermal Printable Wristband Market Size & Forecast, By Component Type, 2021 – 2032

    10.2.7.2.2 Thermal Printable Wristband Market Size & Forecast, By Technology Type, 2021 – 2032

    10.2.7.2.3 Thermal Printable Wristband Market Size & Forecast, By Deployment Mode, 2021 – 2032

    10.2.7.2.4 Thermal Printable Wristband Market Size & Forecast, By Application Area, 2021 – 2032

    10.2.7.2.5 Thermal Printable Wristband Market Size & Forecast, By End-User, 2021 – 2032

10.3 Europe

 10.3.1 Key Trends

 10.3.2 Thermal Printable Wristband Market Size & Forecast, By Component Type, 2021 – 2032

 10.3.3 Thermal Printable Wristband Market Size & Forecast, By Technology Type, 2021 – 2032

 10.3.4 Thermal Printable Wristband Market Size & Forecast, By Deployment Mode, 2021 – 2032

 10.3.5 Thermal Printable Wristband Market Size & Forecast, By Application Area, 2021 – 2032

 10.3.6 Thermal Printable Wristband Market Size & Forecast, By End-User, 2021 – 2032

 10.3.7 Thermal Printable Wristband Market Size & Forecast, By Country, 2021 – 2032

  10.3.7.1 Germany

   10.3.7.1.1 Thermal Printable Wristband Market Size & Forecast, By Component Type, 2021 – 2032

   10.3.7.1.2 Thermal Printable Wristband Market Size & Forecast, By Technology Type, 2021 – 2032

   10.3.7.1.3 Thermal Printable Wristband Market Size & Forecast, By Deployment Mode, 2021 – 2032

   10.3.7.1.4 Thermal Printable Wristband Market Size & Forecast, By Application Area, 2021 – 2032

   10.3.7.1.5 Thermal Printable Wristband Market Size & Forecast, By End-User, 2021 – 2032

  10.3.7.2 UK

   10.3.7.2.1 Thermal Printable Wristband Market Size & Forecast, By Component Type, 2021 – 2032

   10.3.7.2.2 Thermal Printable Wristband Market Size & Forecast, By Technology Type, 2021 – 2032

   10.3.7.2.3 Thermal Printable Wristband Market Size & Forecast, By Deployment Mode, 2021 – 2032

   10.3.7.2.4 Thermal Printable Wristband Market Size & Forecast, By Application Area, 2021 – 2032

   10.3.7.2.5 Thermal Printable Wristband Market Size & Forecast, By End-User, 2021 – 2032

  10.3.7.3 France

   10.3.7.3.1 Thermal Printable Wristband Market Size & Forecast, By Component Type, 2021 – 2032

   10.3.7.3.2 Thermal Printable Wristband Market Size & Forecast, By Technology Type, 2021 – 2032

   10.3.7.3.3 Thermal Printable Wristband Market Size & Forecast, By Deployment Mode, 2021 – 2032

   10.3.7.3.4 Thermal Printable Wristband Market Size & Forecast, By Application Area, 2021 – 2032

   10.3.7.3.5 Thermal Printable Wristband Market Size & Forecast, By End-User, 2021 – 2032

  10.3.7.4 Italy

   10.3.7.4.1 Thermal Printable Wristband Market Size & Forecast, By Component Type, 2021 – 2032

   10.3.7.4.2 Thermal Printable Wristband Market Size & Forecast, By Technology Type, 2021 – 2032

   10.3.7.4.3 Thermal Printable Wristband Market Size & Forecast, By Deployment Mode, 2021 – 2032

   10.3.7.4.4 Thermal Printable Wristband Market Size & Forecast, By Application Area, 2021 – 2032

   10.3.7.4.5 Thermal Printable Wristband Market Size & Forecast, By End-User, 2021 – 2032

  10.3.7.5 Spain

   10.3.7.5.1 Thermal Printable Wristband Market Size & Forecast, By Component Type, 2021 – 2032

   10.3.7.5.2 Thermal Printable Wristband Market Size & Forecast, By Technology Type, 2021 – 2032

   10.3.7.5.3 Thermal Printable Wristband Market Size & Forecast, By Deployment Mode, 2021 – 2032

   10.3.7.5.4 Thermal Printable Wristband Market Size & Forecast, By Application Area, 2021 – 2032

   10.3.7.5.5 Thermal Printable Wristband Market Size & Forecast, By End-User, 2021 – 2032

  10.3.7.6 Russia

   10.3.7.6.1 Thermal Printable Wristband Market Size & Forecast, By Component Type, 2021 – 2032

   10.3.7.6.2 Thermal Printable Wristband Market Size & Forecast, By Technology Type, 2021 – 2032

   10.3.7.6.3 Thermal Printable Wristband Market Size & Forecast, By Deployment Mode, 2021 – 2032

   10.3.7.6.4 Thermal Printable Wristband Market Size & Forecast, By Application Area, 2021 – 2032

   10.3.7.6.5 Thermal Printable Wristband Market Size & Forecast, By End-User, 2021 – 2032

  10.3.7.7 Poland

   10.3.7.7.1 Thermal Printable Wristband Market Size & Forecast, By Component Type, 2021 – 2032

   10.3.7.7.2 Thermal Printable Wristband Market Size & Forecast, By Technology Type, 2021 – 2032

   10.3.7.7.3 Thermal Printable Wristband Market Size & Forecast, By Deployment Mode, 2021 – 2032

   10.3.7.7.4 Thermal Printable Wristband Market Size & Forecast, By Application Area, 2021 – 2032

   10.3.7.7.5 Thermal Printable Wristband Market Size & Forecast, By End-User, 2021 – 2032

  10.3.7.8 Rest of Europe

   10.3.7.8.1 Thermal Printable Wristband Market Size & Forecast, By Component Type, 2021 – 2032

   10.3.7.8.2 Thermal Printable Wristband Market Size & Forecast, By Technology Type, 2021 – 2032

   10.3.7.8.3 Thermal Printable Wristband Market Size & Forecast, By Deployment Mode, 2021 – 2032

   10.3.7.8.4 Thermal Printable Wristband Market Size & Forecast, By Application Area, 2021 – 2032

   10.3.7.8.5 Thermal Printable Wristband Market Size & Forecast, By End-User, 2021 – 2032

10.4 Asia-Pacific

 10.4.1 Key Trends

 10.4.2 Thermal Printable Wristband Market Size & Forecast, By Component Type, 2021 – 2032

 10.4.3 Thermal Printable Wristband Market Size & Forecast, By Technology Type, 2021 – 2032

 10.4.4 Thermal Printable Wristband Market Size & Forecast, By Deployment Mode, 2021 – 2032

 10.4.5 Thermal Printable Wristband Market Size & Forecast, By Application Area, 2021 – 2032

 10.4.6 Thermal Printable Wristband Market Size & Forecast, By End-User, 2021 – 2032

 10.4.7 Thermal Printable Wristband Market Size & Forecast, By Country, 2021 – 2032

  10.4.7.1 China

   10.4.7.1.1 Thermal Printable Wristband Market Size & Forecast, By Component Type, 2021 – 2032

   10.4.7.1.2 Thermal Printable Wristband Market Size & Forecast, By Technology Type, 2021 – 2032

   10.4.7.1.3 Thermal Printable Wristband Market Size & Forecast, By Deployment Mode, 2021 – 2032

   10.4.7.1.4 Thermal Printable Wristband Market Size & Forecast, By Application Area, 2021 – 2032

   10.4.7.1.5 Thermal Printable Wristband Market Size & Forecast, By End-User, 2021 – 2032

  10.4.7.2 India

   10.4.7.2.1 Thermal Printable Wristband Market Size & Forecast, By Component Type, 2021 – 2032

   10.4.7.2.2 Thermal Printable Wristband Market Size & Forecast, By Technology Type, 2021 – 2032

   10.4.7.2.3 Thermal Printable Wristband Market Size & Forecast, By Deployment Mode, 2021 – 2032

   10.4.7.2.4 Thermal Printable Wristband Market Size & Forecast, By Application Area, 2021 – 2032

   10.4.7.2.5 Thermal Printable Wristband Market Size & Forecast, By End-User, 2021 – 2032

  10.4.7.3 Japan

   10.4.7.3.1 Thermal Printable Wristband Market Size & Forecast, By Component Type, 2021 – 2032

   10.4.7.3.2 Thermal Printable Wristband Market Size & Forecast, By Technology Type, 2021 – 2032

   10.4.7.3.3 Thermal Printable Wristband Market Size & Forecast, By Deployment Mode, 2021 – 2032

   10.4.7.3.4 Thermal Printable Wristband Market Size & Forecast, By Application Area, 2021 – 2032

   10.4.7.3.5 Thermal Printable Wristband Market Size & Forecast, By End-User, 2021 – 2032

  10.4.7.4 South Korea

   10.4.7.4.1 Thermal Printable Wristband Market Size & Forecast, By Component Type, 2021 – 2032

   10.4.7.4.2 Thermal Printable Wristband Market Size & Forecast, By Technology Type, 2021 – 2032

   10.4.7.4.3 Thermal Printable Wristband Market Size & Forecast, By Deployment Mode, 2021 – 2032

   10.4.7.4.4 Thermal Printable Wristband Market Size & Forecast, By Application Area, 2021 – 2032

   10.4.7.4.5 Thermal Printable Wristband Market Size & Forecast, By End-User, 2021 – 2032

  10.4.7.5 Australia

   10.4.7.5.1 Thermal Printable Wristband Market Size & Forecast, By Component Type, 2021 – 2032

   10.4.7.5.2 Thermal Printable Wristband Market Size & Forecast, By Technology Type, 2021 – 2032

   10.4.7.5.3 Thermal Printable Wristband Market Size & Forecast, By Deployment Mode, 2021 – 2032

   10.4.7.5.4 Thermal Printable Wristband Market Size & Forecast, By Application Area, 2021 – 2032

   10.4.7.5.5 Thermal Printable Wristband Market Size & Forecast, By End-User, 2021 – 2032

  10.4.7.6 ASEAN Countries

   10.4.7.6.1 Thermal Printable Wristband Market Size & Forecast, By Component Type, 2021 – 2032

   10.4.7.6.2 Thermal Printable Wristband Market Size & Forecast, By Technology Type, 2021 – 2032

   10.4.7.6.3 Thermal Printable Wristband Market Size & Forecast, By Deployment Mode, 2021 – 2032

   10.4.7.6.4 Thermal Printable Wristband Market Size & Forecast, By Application Area, 2021 – 2032

   10.4.7.6.5 Thermal Printable Wristband Market Size & Forecast, By End-User, 2021 – 2032

  10.4.7.7 Rest of Asia-Pacific

   10.4.7.7.1 Thermal Printable Wristband Market Size & Forecast, By Component Type, 2021 – 2032

   10.4.7.7.2 Thermal Printable Wristband Market Size & Forecast, By Technology Type, 2021 – 2032

   10.4.7.7.3 Thermal Printable Wristband Market Size & Forecast, By Deployment Mode, 2021 – 2032

   10.4.7.7.4 Thermal Printable Wristband Market Size & Forecast, By Application Area, 2021 – 2032

   10.4.7.7.5 Thermal Printable Wristband Market Size & Forecast, By End-User, 2021 – 2032

10.5 Latin America

 10.5.1 Key Trends

 10.5.2 Thermal Printable Wristband Market Size & Forecast, By Component Type, 2021 – 2032

 10.5.3 Thermal Printable Wristband Market Size & Forecast, By Technology Type, 2021 – 2032

 10.5.4 Thermal Printable Wristband Market Size & Forecast, By Deployment Mode, 2021 – 2032

 10.5.5 Thermal Printable Wristband Market Size & Forecast, By Application Area, 2021 – 2032

 10.5.6 Thermal Printable Wristband Market Size & Forecast, By End-User, 2021 – 2032

 10.5.7 Thermal Printable Wristband Market Size & Forecast, By Country, 2021 – 2032

  10.5.7.1 Brazil

   10.5.7.1.1 Thermal Printable Wristband Market Size & Forecast, By Component Type, 2021 – 2032

   10.5.7.1.2 Thermal Printable Wristband Market Size & Forecast, By Technology Type, 2021 – 2032

   10.5.7.1.3 Thermal Printable Wristband Market Size & Forecast, By Deployment Mode, 2021 – 2032

   10.5.7.1.4 Thermal Printable Wristband Market Size & Forecast, By Application Area, 2021 – 2032

   10.5.7.1.5 Thermal Printable Wristband Market Size & Forecast, By End-User, 2021 – 2032

  10.5.7.2 Argentina

   10.5.7.2.1 Thermal Printable Wristband Market Size & Forecast, By Component Type, 2021 – 2032

   10.5.7.2.2 Thermal Printable Wristband Market Size & Forecast, By Technology Type, 2021 – 2032

   10.5.7.2.3 Thermal Printable Wristband Market Size & Forecast, By Deployment Mode, 2021 – 2032

   10.5.7.2.4 Thermal Printable Wristband Market Size & Forecast, By Application Area, 2021 – 2032

   10.5.7.2.5 Thermal Printable Wristband Market Size & Forecast, By End-User, 2021 – 2032

  10.5.7.3 Mexico

   10.5.7.3.1 Thermal Printable Wristband Market Size & Forecast, By Component Type, 2021 – 2032

   10.5.7.3.2 Thermal Printable Wristband Market Size & Forecast, By Technology Type, 2021 – 2032

   10.5.7.3.3 Thermal Printable Wristband Market Size & Forecast, By Deployment Mode, 2021 – 2032

   10.5.7.3.4 Thermal Printable Wristband Market Size & Forecast, By Application Area, 2021 – 2032

   10.5.7.3.5 Thermal Printable Wristband Market Size & Forecast, By End-User, 2021 – 2032

  10.5.7.4 Colombia

   10.5.7.4.1 Thermal Printable Wristband Market Size & Forecast, By Component Type, 2021 – 2032

   10.5.7.4.2 Thermal Printable Wristband Market Size & Forecast, By Technology Type, 2021 – 2032

   10.5.7.4.3 Thermal Printable Wristband Market Size & Forecast, By Deployment Mode, 2021 – 2032

   10.5.7.4.4 Thermal Printable Wristband Market Size & Forecast, By Application Area, 2021 – 2032

   10.5.7.4.5 Thermal Printable Wristband Market Size & Forecast, By End-User, 2021 – 2032

  10.5.7.5 Rest of Latin America

   10.5.7.5.1 Thermal Printable Wristband Market Size & Forecast, By Component Type, 2021 – 2032

   10.5.7.5.2 Thermal Printable Wristband Market Size & Forecast, By Technology Type, 2021 – 2032

   10.5.7.5.3 Thermal Printable Wristband Market Size & Forecast, By Deployment Mode, 2021 – 2032

   10.5.7.5.4 Thermal Printable Wristband Market Size & Forecast, By Application Area, 2021 – 2032

   10.5.7.5.5 Thermal Printable Wristband Market Size & Forecast, By End-User, 2021 – 2032

10.6 Middle East & Africa

 10.6.1 Key Trends

 10.6.2 Thermal Printable Wristband Market Size & Forecast, By Component Type, 2021 – 2032

 10.6.3 Thermal Printable Wristband Market Size & Forecast, By Technology Type, 2021 – 2032

 10.6.4 Thermal Printable Wristband Market Size & Forecast, By Deployment Mode, 2021 – 2032

 10.6.5 Thermal Printable Wristband Market Size & Forecast, By Application Area, 2021 – 2032

 10.6.6 Thermal Printable Wristband Market Size & Forecast, By End-User, 2021 – 2032

 10.6.7 Thermal Printable Wristband Market Size & Forecast, By Country, 2021 – 2032

  10.6.7.1 UAE

   10.6.7.1.1 Thermal Printable Wristband Market Size & Forecast, By Component Type, 2021 – 2032

   10.6.7.1.2 Thermal Printable Wristband Market Size & Forecast, By Technology Type, 2021 – 2032

   10.6.7.1.3 Thermal Printable Wristband Market Size & Forecast, By Deployment Mode, 2021 – 2032

   10.6.7.1.4 Thermal Printable Wristband Market Size & Forecast, By Application Area, 2021 – 2032

   10.6.7.1.5 Thermal Printable Wristband Market Size & Forecast, By End-User, 2021 – 2032

  10.6.7.2 Saudi Arabia

   10.6.7.2.1 Thermal Printable Wristband Market Size & Forecast, By Component Type, 2021 – 2032

   10.6.7.2.2 Thermal Printable Wristband Market Size & Forecast, By Technology Type, 2021 – 2032

   10.6.7.2.3 Thermal Printable Wristband Market Size & Forecast, By Deployment Mode, 2021 – 2032

   10.6.7.2.4 Thermal Printable Wristband Market Size & Forecast, By Application Area, 2021 – 2032

   10.6.7.2.5 Thermal Printable Wristband Market Size & Forecast, By End-User, 2021 – 2032

  10.6.7.3 Qatar

   10.6.7.3.1 Thermal Printable Wristband Market Size & Forecast, By Component Type, 2021 – 2032

   10.6.7.3.2 Thermal Printable Wristband Market Size & Forecast, By Technology Type, 2021 – 2032

   10.6.7.3.3 Thermal Printable Wristband Market Size & Forecast, By Deployment Mode, 2021 – 2032

   10.6.7.3.4 Thermal Printable Wristband Market Size & Forecast, By Application Area, 2021 – 2032

   10.6.7.3.5 Thermal Printable Wristband Market Size & Forecast, By End-User, 2021 – 2032

  10.6.7.4 Egypt

   10.6.7.4.1 Thermal Printable Wristband Market Size & Forecast, By Component Type, 2021 – 2032

   10.6.7.4.2 Thermal Printable Wristband Market Size & Forecast, By Technology Type, 2021 – 2032

   10.6.7.4.3 Thermal Printable Wristband Market Size & Forecast, By Deployment Mode, 2021 – 2032

   10.6.7.4.4 Thermal Printable Wristband Market Size & Forecast, By Application Area, 2021 – 2032

   10.6.7.4.5 Thermal Printable Wristband Market Size & Forecast, By End-User, 2021 – 2032

  10.6.7.5 South Africa

   10.6.7.5.1 Thermal Printable Wristband Market Size & Forecast, By Component Type, 2021 – 2032

   10.6.7.5.2 Thermal Printable Wristband Market Size & Forecast, By Technology Type, 2021 – 2032

   10.6.7.5.3 Thermal Printable Wristband Market Size & Forecast, By Deployment Mode, 2021 – 2032

   10.6.7.5.4 Thermal Printable Wristband Market Size & Forecast, By Application Area, 2021 – 2032

   10.6.7.5.5 Thermal Printable Wristband Market Size & Forecast, By End-User, 2021 – 2032

  10.6.7.6 Rest of Middle East & Africa

   10.6.7.6.1 Thermal Printable Wristband Market Size & Forecast, By Component Type, 2021 – 2032

   10.6.7.6.2 Thermal Printable Wristband Market Size & Forecast, By Technology Type, 2021 – 2032

   10.6.7.6.3 Thermal Printable Wristband Market Size & Forecast, By Deployment Mode, 2021 – 2032

   10.6.7.6.4 Thermal Printable Wristband Market Size & Forecast, By Application Area, 2021 – 2032

   10.6.7.6.5 Thermal Printable Wristband Market Size & Forecast, By End-User, 2021 – 2032

11. Competitive Landscape

 11.1 Key Players' Positioning

 11.2 Competitive Developments

  11.2.1 Key Strategies Adopted (%), By Key Players, 2024

  11.2.2 Year-Wise Strategies & Development, 2021 – 2025

  11.2.3 Number Of Strategies Adopted By Key Players, 2024

 11.3 Market Share Analysis, 2024

 11.4 Product/Service & Application Benchmarking

  11.4.1 Product/Service Specifications & Features By Key Players

  11.4.2 Product/Service Heatmap By Key Players

  11.4.3 Application Heatmap By Key Players

 11.5 Industry Start-Up & Innovation Landscape

11.6 Key Company Profiles

 11.6.1 SwimEye

  11.6.1.1 Company Overview & Snapshot

  11.6.1.2 Product/Service Portfolio

  11.6.1.3 Key Company Financials

  11.6.1.4 SWOT Analysis

 11.6.2 AngelEye

  11.6.2.1 Company Overview & Snapshot

  11.6.2.2 Product/Service Portfolio

  11.6.2.3 Key Company Financials

  11.6.2.4 SWOT Analysis

 11.6.3 WAVE Systems

  11.6.3.1 Company Overview & Snapshot

  11.6.3.2 Product/Service Portfolio

  11.6.3.3 Key Company Financials

  11.6.3.4 SWOT Analysis

 11.6.4 Coral Detection Systems (MYLO)

  11.6.4.1 Company Overview & Snapshot

  11.6.4.2 Product/Service Portfolio

  11.6.4.3 Key Company Financials

  11.6.4.4 SWOT Analysis

 11.6.5 Poseidon Technologies

  11.6.5.1 Company Overview & Snapshot

  11.6.5.2 Product/Service Portfolio

  11.6.5.3 Key Company Financials

  11.6.5.4 SWOT Analysis

 11.6.6 Sentag

  11.6.6.1 Company Overview & Snapshot

  11.6.6.2 Product/Service Portfolio

  11.6.6.3 Key Company Financials

  11.6.6.4 SWOT Analysis

 11.6.7 Poolview Limited

  11.6.7.1 Company Overview & Snapshot

  11.6.7.2 Product/Service Portfolio

  11.6.7.3 Key Company Financials

  11.6.7.4 SWOT Analysis

 11.6.8 Variopool B.V

  11.6.8.1 Company Overview & Snapshot

  11.6.8.2 Product/Service Portfolio

  11.6.8.3 Key Company Financials

  11.6.8.4 SWOT Analysis

 11.6.9 SEAL SwimSafe

  11.6.9.1 Company Overview & Snapshot

  11.6.9.2 Product/Service Portfolio

  11.6.9.3 Key Company Financials

  11.6.9.4 SWOT Analysis

 11.6.10 Lifeguard AI

  11.6.10.1 Company Overview & Snapshot

  11.6.10.2 Product/Service Portfolio

  11.6.10.3 Key Company Financials

  11.6.10.4 SWOT Analysis

 11.6.11 Blueguard

  11.6.11.1 Company Overview & Snapshot

  11.6.11.2 Product/Service Portfolio

  11.6.11.3 Key Company Financials

  11.6.11.4 SWOT Analysis

 11.6.12 AquaEye (VodaSafe)

  11.6.12.1 Company Overview & Snapshot

  11.6.12.2 Product/Service Portfolio

  11.6.12.3 Key Company Financials

  11.6.12.4 SWOT Analysis

 11.6.13 diWatch

  11.6.13.1 Company Overview & Snapshot

  11.6.13.2 Product/Service Portfolio

  11.6.13.3 Key Company Financials

  11.6.13.4 SWOT Analysis

 11.6.14 Poolwatch

  11.6.14.1 Company Overview & Snapshot

  11.6.14.2 Product/Service Portfolio

  11.6.14.3 Key Company Financials

  11.6.14.4 SWOT Analysis

 11.6.15 Mobotix

  11.6.15.1 Company Overview & Snapshot

  11.6.15.2 Product/Service Portfolio

  11.6.15.3 Key Company Financials

  11.6.15.4 SWOT Analysis

 11.6.16 AquaGuard

  11.6.16.1 Company Overview & Snapshot

  11.6.16.2 Product/Service Portfolio

  11.6.16.3 Key Company Financials

  11.6.16.4 SWOT Analysis

 11.6.17 SafeWave

  11.6.17.1 Company Overview & Snapshot

  11.6.17.2 Product/Service Portfolio

  11.6.17.3 Key Company Financials

  11.6.17.4 SWOT Analysis

 11.6.18 AquaSense

  11.6.18.1 Company Overview & Snapshot

  11.6.18.2 Product/Service Portfolio

  11.6.18.3 Key Company Financials

  11.6.18.4 SWOT Analysis

 11.6.19 Poolview Technologies

  11.6.19.1 Company Overview & Snapshot

  11.6.19.2 Product/Service Portfolio

  11.6.19.3 Key Company Financials

  11.6.19.4 SWOT Analysis

 11.6.20 Lynxight

  11.6.20.1 Company Overview & Snapshot

  11.6.20.2 Product/Service Portfolio

  11.6.20.3 Key Company Financials

  11.6.20.4 SWOT Analysis

12. Analyst Recommendations

 12.1 SNS Insider Opportunity Map

 12.2 Industry Low-Hanging Fruit Assessment

 12.3 Market Entry & Growth Strategy

 12.4 Analyst Viewpoint & Suggestions On Market Growth

13. Assumptions

14. Disclaimer

15. Appendix

 15.1 List Of Tables

 15.2 List Of Figures

Key Segments: 

By Component Type

  • Sensors and Detectors

  • Software and Analytics Platforms

  • Audio/Visual Alarm

  • Control Panels and Interfaces

By Technology Type

  • Wearable Devices

  • Fixed Surveillance Systems

  • Drones and Aerial Surveillance

  • Mobile Applications

By Deployment Mode

  • On-premise Solutions

  • Cloud-based Solutions

  • Hybrid Deployment Models

  • Managed Services

By Application Area

  • Residential Swimming Pools

  • Public Swimming Pools

  • Water Parks

  • Beaches and Lakes

By End-User

  • Homeowners

  • Commercial Water Activity Providers

  • Government and Municipal Bodies

  • Tourism and Hospitality Sector

Request for Segment Customization as per your Business Requirement: Segment Customization Request

Regional Coverage:

North America

  • US

  • Canada

Europe

  • Germany

  • UK

  • France

  • Italy

  • Spain

  • Russia

  • Poland

  • Rest of Europe

Asia Pacific

  • China

  • India

  • Japan

  • South Korea

  • Australia

  • ASEAN Countries

  • Rest of Asia Pacific

Middle East & Africa

  • UAE

  • Saudi Arabia

  • Qatar

  • South Africa

  • Rest of Middle East & Africa

Latin America

  • Brazil

  • Argentina

  • Mexico

  • Colombia

  • Rest of Latin America

Request for Country Level Research Report: Country Level Customization Request

Available Customization 

With the given market data, SNS Insider offers customization as per the company’s specific needs. The following customization options are available for the report: 

  • Detailed Volume Analysis 

  • Criss-Cross segment analysis (e.g. Product X Application) 

  • Competitive Product Benchmarking 

  • Geographic Analysis 

  • Additional countries in any of the regions 

  • Customized Data Representation 

  • Detailed analysis and profiling of additional market players

An accurate research report requires proper strategizing as well as implementation. There are multiple factors involved in the completion of good and accurate research report and selecting the best methodology to compete the research is the toughest part. Since the research reports we provide play a crucial role in any company’s decision-making process, therefore we at SNS Insider always believe that we should choose the best method which gives us results closer to reality. This allows us to reach at a stage wherein we can provide our clients best and accurate investment to output ratio.

Each report that we prepare takes a timeframe of 350-400 business hours for production. Starting from the selection of titles through a couple of in-depth brain storming session to the final QC process before uploading our titles on our website we dedicate around 350 working hours. The titles are selected based on their current market cap and the foreseen CAGR and growth.


The 5 steps process:

Step 1: Secondary Research:

Secondary Research or Desk Research is as the name suggests is a research process wherein, we collect data through the readily available information. In this process we use various paid and unpaid databases which our team has access to and gather data through the same. This includes examining of listed companies’ annual reports, Journals, SEC filling etc. Apart from this our team has access to various associations across the globe across different industries. Lastly, we have exchange relationships with various university as well as individual libraries.

Secondary Research

Step 2: Primary Research

When we talk about primary research, it is a type of study in which the researchers collect relevant data samples directly, rather than relying on previously collected data.  This type of research is focused on gaining content specific facts that can be sued to solve specific problems. Since the collected data is fresh and first hand therefore it makes the study more accurate and genuine.

We at SNS Insider have divided Primary Research into 2 parts.

Part 1 wherein we interview the KOLs of major players as well as the upcoming ones across various geographic regions. This allows us to have their view over the market scenario and acts as an important tool to come closer to the accurate market numbers. As many as 45 paid and unpaid primary interviews are taken from both the demand and supply side of the industry to make sure we land at an accurate judgement and analysis of the market.

This step involves the triangulation of data wherein our team analyses the interview transcripts, online survey responses and observation of on filed participants. The below mentioned chart should give a better understanding of the part 1 of the primary interview.

Primary Research

Part 2: In this part of primary research the data collected via secondary research and the part 1 of the primary research is validated with the interviews from individual consultants and subject matter experts.

Consultants are those set of people who have at least 12 years of experience and expertise within the industry whereas Subject Matter Experts are those with at least 15 years of experience behind their back within the same space. The data with the help of two main processes i.e., FGDs (Focused Group Discussions) and IDs (Individual Discussions). This gives us a 3rd party nonbiased primary view of the market scenario making it a more dependable one while collation of the data pointers.

Step 3: Data Bank Validation

Once all the information is collected via primary and secondary sources, we run that information for data validation. At our intelligence centre our research heads track a lot of information related to the market which includes the quarterly reports, the daily stock prices, and other relevant information. Our data bank server gets updated every fortnight and that is how the information which we collected using our primary and secondary information is revalidated in real time.

Data Bank Validation

Step 4: QA/QC Process

After all the data collection and validation our team does a final level of quality check and quality assurance to get rid of any unwanted or undesired mistakes. This might include but not limited to getting rid of the any typos, duplication of numbers or missing of any important information. The people involved in this process include technical content writers, research heads and graphics people. Once this process is completed the title gets uploader on our platform for our clients to read it.

Step 5: Final QC/QA Process:

This is the last process and comes when the client has ordered the study. In this process a final QA/QC is done before the study is emailed to the client. Since we believe in giving our clients a good experience of our research studies, therefore, to make sure that we do not lack at our end in any way humanly possible we do a final round of quality check and then dispatch the study to the client.