E-bikes Market Size & Overview
Get More Information on E-bikes Market - Request Sample Report
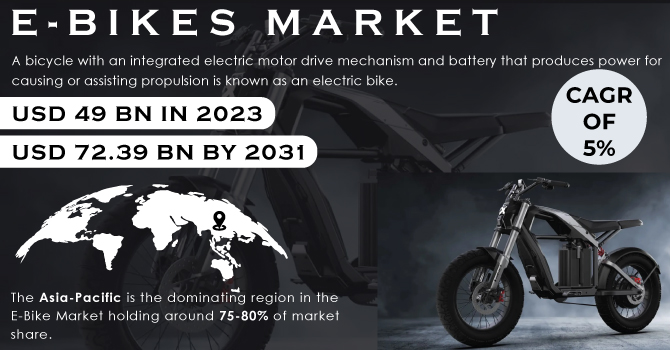
The E-bikes Market size was valued at USD 49 billion in 2023 and is expected to reach USD 72.39 billion by 2031 and grow at a CAGR of 5% over the forecast period 2024-2031.
The world of electric bikes (e-bikes) offers a spectrum of options, from those with gentle motors that support a rider's pedalling to powerful machines that propel the bike entirely with a throttle. This versatility, coupled with their eco-friendly nature and stylish designs, has made e-bikes a compelling transportation choice.
Many consumers see them as a viable alternative to traditional options like scooters, smart cars, and even public transport. E-bikes contribute to decongesting roads due to their smaller size and ability to reach higher speeds with minimal effort. The added health benefit of pedalling further sweetens the deal. Manufacturers are constantly innovating to enhance the user experience. By integrating e-bikes with smartphones, they provide real-time data on factors like speed and battery level, creating a more intuitive and engaging user interface. The rising demand for e-bikes in last-mile delivery services, along with the general increase in consumer interest, suggests a bright future for electric bicycles in India.
MARKET DYNAMICS:
KEY DRIVERS:
-
Rising Fuel Prices Drive E-Bike Market Expansion
Rising fuel prices are driving a surge in demand for electric bikes. This is due in part to the rising cost of crude oil, controlled by OPEC countries. Governments are stepping up by developing charging infrastructure to support this shift towards electric transportation. Additionally, subsidies and programs are making e-bikes more affordable. With their eco-friendly nature and user-friendly operation, e-bikes are a compelling option for many. As gasoline prices continue to grow, the e-bike market is expected to rise, fueled by this growing consumer preference.
-
Government initiatives, rising health concerns about traditional vehicles, and environmental anxieties drive e-bike market growth
RESTRAINTS:
-
High upfront costs due to batteries and electric motors limit electric bike market growth
E-bikes faces a problem in their high upfront cost. The electric motor and lithium-ion battery significantly inflate the price tag compared to traditional bikes and scooters, putting them out of reach for budget-minded consumers. This price difference makes traditional options much more attractive. The high cost of lithium-ion batteries further restricts market growth, limiting the affordability of e-bikes for a wider audience.
-
E-Bike Market Hindered by Limited Charging Infrastructure
OPPORTUNITIES:
-
Rising fuel costs create a prime opportunity for e-bikes as a budget-friendly and eco-conscious transportation alternative.
-
Technological advancements can unlock new features and functionalities in e-bikes, enhancing user experience and attracting tech-savvy consumers.
CHALLENGES:
-
High upfront costs due to batteries and motors make e-bikes less affordable.
-
Competition from cheaper traditional bikes and scooters hinders e-bike market growth.
IMPACT OF RUSSIA-UKRAINE WAR
The war in Russia-Ukraine has disrupted the E-bike market in several ways. It has disrupted global supply chains, impacting the availability and cost of raw materials needed for e-bike production. Nickel, a critical component in Lithium-ion batteries, has seen a price surge of over 64% since the invasion. This translates to potentially higher production costs for e-bikes, which could trickle down to consumers in the form of increased prices. The war has diverted resources and attention away from clean energy initiatives in some countries. Governments that were previously prioritizing investments in electric vehicle infrastructure, including charging stations, might need to reallocate funds towards defence spending. This could slow down the development of a robust charging network, which is crucial for widespread e-bike adoption, especially for longer commutes and delivery services.
IMPACT OF ECONOMIC SLOWDOWN
An economic slowdown has disrupted the e-bikes market. With disposable incomes limiting, consumers may be less willing to spend on a higher-priced electric option compared to a traditional bike. This could lead to a decline in overall sales figures, especially for premium e-bikes with advanced features. The economic slowdowns can also disrupt supply chains, leading to shortages of key components like lithium-ion batteries and electric motors. This can cause production delays and price fluctuations, further discouraging potential buyers. Additionally, job losses during economic downturns can disproportionately affect discretionary spending on non-essential items like e-bikes. While discretionary spending might decline, economic slowdowns can also lead to a rise in fuel costs. This could incentivize budget-conscious consumers to explore e-bikes as a more affordable transportation option, potentially mitigating some of the slowdown's impact.
KEY MARKET SEGMENTS:
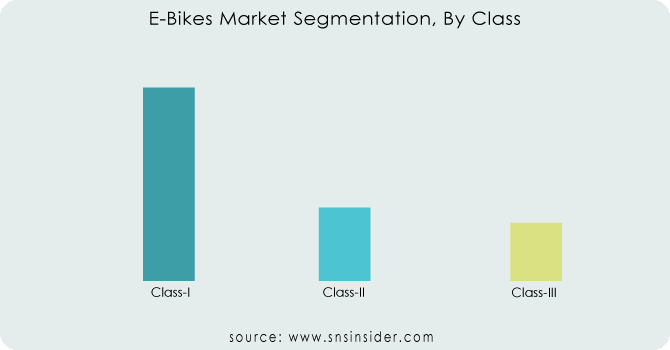
By Class
-
Class-I
-
Class-II
-
Class-III
Class-I is the dominating sub-segment in the E-Bikes Market by class holding around 75-80% of market share. These e-bikes are most popular due to their regulatory advantages. They often face fewer restrictions compared to higher-powered classes, making them easier to ride on bike paths and in designated areas. Additionally, their lower power consumption translates to longer ranges on a single charge, ideal for commuting and recreation.
To Get Customized Report as per your Business Requirement - Request For Customized Report
By Speed
-
Up to 25 Km/h
-
25-45 Km/h
Up to 25 Km/h is the dominating sub-segment in the E-Bikes Market by speed holding around 60-70% of market share. This segment aligns with Class-I regulations in many regions, offering a familiar riding experience with pedal assistance. It also caters to a wider audience, including those who may not be comfortable with higher speeds, making it a safe and accessible option.
By Motor Type
-
Mid
-
Hub
Mid-drive motors is the dominating sub-segment in the E-Bikes Market by motor type. Mid-drive motors offer a more natural riding experience by directly engaging the drivetrain. This allows for smoother power delivery and better handling, especially on hills. While hub motors are generally cheaper, their weight distribution can affect handling.
By Mode
-
Pedal Assist
-
Throttle
Pedal Assist is the dominating sub-segment in the E-Bikes Market by mode. Pedal-assist e-bikes comply with most regulations and provide a more exercise-oriented experience. Riders still get a workout while benefiting from the motor's assistance, making them ideal for fitness enthusiasts and commuters seeking a balance between effort and speed. Throttle-only e-bikes, while convenient, may face legal restrictions in certain areas.
By Component
-
Batteries
-
Electric Motors
-
Frames with Forks
-
Crank Gears
-
Wheels
-
Motor Controllers
-
Brake Systems
By Usage
-
Mountain/Trekking
-
City/Urban
-
Cargo
-
Others
By Battery Type
-
Lithium-ion
-
Lithium-ion Polymer
-
Lead Acid
-
Others
By Battery Capacity
-
<250W
-
>250 & <450W
-
>450 & <650W
-
>650W
By Ownership
-
Shared
-
Personal
By Motor Weight
-
<2 kg
-
>2 kg & <2.4 kg
-
>2.4 kg
REGIONAL ANALYSES
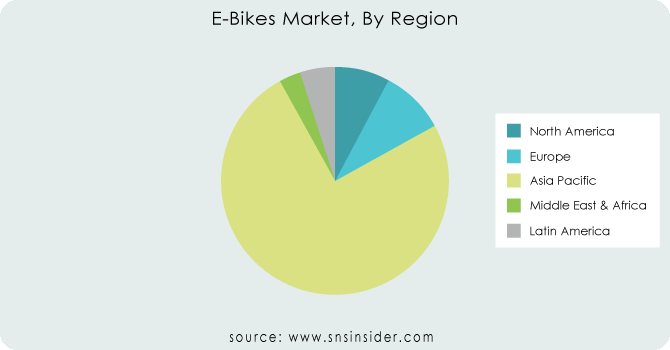
The Asia-Pacific is the dominating region in the E-Bike Market holding around 75-80% of market share. This dominance stems from the factors such as established cycling infrastructure in countries like China and India, high population density in urban areas demanding efficient transportation, and government support through subsidies and incentives.
Europe is the second highest region in this market, fueled by its strong cycling culture, growing environmental consciousness, and government initiatives promoting electric mobility.
North America is the fastest growing region with a CAGR of around 9.1%. This rapid rise can be attributed to two key factors: rising fuel costs pushing consumers towards alternative transportation, and growing investment in e-bike infrastructure and consumer awareness campaigns.
REGIONAL COVERAGE:
North America
-
US
-
Canada
-
Mexico
Europe
-
Eastern Europe
-
Poland
-
Romania
-
Hungary
-
Turkey
-
Rest of Eastern Europe
-
-
Western Europe
-
Germany
-
France
-
UK
-
Italy
-
Spain
-
Netherlands
-
Switzerland
-
Austria
-
Rest of Western Europe
-
Asia Pacific
-
China
-
India
-
Japan
-
South Korea
-
Vietnam
-
Singapore
-
Australia
-
Rest of Asia Pacific
Middle East & Africa
-
Middle East
-
UAE
-
Egypt
-
Saudi Arabia
-
Qatar
-
Rest of the Middle East
-
-
Africa
-
Nigeria
-
South Africa
-
Rest of Africa
-
Latin America
-
Brazil
-
Argentina
-
Colombia
-
Rest of Latin America
KEY PLAYERS:
The major key players are Accell Group, Pon Bike, Giant Manufacturing Co., Ltd., Trek Bicycle Corporation, Aima Technology Group Co. Ltd, Merida Industry Co. Ltd, Yadea Group Holdings, Rad Power Bikes Inc, Padego Electric Bikes, Yamaha Motor Co., Ltd. and other key players.
Accell Group-Company Financial Analysis
RECENT DEVELOPMENT
-
In Oct 2023: Rad Power Bikes and Uber Eats teamed up for a Miami, Florida pilot program. This initiative sees Uber Eats delivery staff using e-bikes to fulfill customer orders.
-
In Sept. 2023: Dutch e-bike company VanMoof launched their upgraded S5 model boasting an extended 150 kilometre range and a more powerful motor compared to its predecessor.
-
In Sept. 2023: American e-bike company Ride1Up has teamed up with Walmart to expand sales. Ride1Up e-bikes will now be available for purchase online and in select Walmart stores, making them more accessible to a wider range of consumers.
| Report Attributes | Details |
|---|---|
| Market Size in 2023 | US$ 49 Billion |
| Market Size by 2031 | US$ 72.39 Billion |
| CAGR | CAGR of 5% From 2024 to 2031 |
| Base Year | 2023 |
| Forecast Period | 2021-2031 |
| Historical Data | 2020-2022 |
| Report Scope & Coverage | Market Size, Segments Analysis, Competitive Landscape, Regional Analysis, DROC & SWOT Analysis, Forecast Outlook |
| Key Segments |
|
| Regional Analysis/Coverage |
North America (US, Canada, Mexico), Europe (Eastern Europe [Poland, Romania, Hungary, Turkey, Rest of Eastern Europe] Western Europe] Germany, France, UK, Italy, Spain, Netherlands, Switzerland, Austria, Rest of Western Europe]), Asia Pacific (China, India, Japan, South Korea, Vietnam, Singapore, Australia, Rest of Asia Pacific), Middle East & Africa (Middle East [UAE, Egypt, Saudi Arabia, Qatar, Rest of Middle East], Africa [Nigeria, South Africa, Rest of Africa], Latin America (Brazil, Argentina, Colombia, Rest of Latin America) |
| Company Profiles |
Accell Group, Pon Bike, Giant Manufacturing Co., Ltd., Trek Bicycle Corporation, Aima Technology Group Co. Ltd, Merida Industry Co. Ltd, Yadea Group Holdings, Rad Power Bikes Inc, Padego Electric Bikes and Yamaha Motor Co., Ltd. |
| Key Drivers | • Demand for eco-friendly transportation is expected to rise, propelling the market growth. • Government measures to encourage the usage of electric bikes are being implemented. |
| RESTRAINTS | • The high sticker price of most e-bikes is one of the major constraints limiting growth in the global e-bike market. • Purchasing batteries is inexpensive. Maintenance can be costly and time-consuming. |
Get in Touch
