Get More Information on Autonomous Cars Market - Request Sample Report
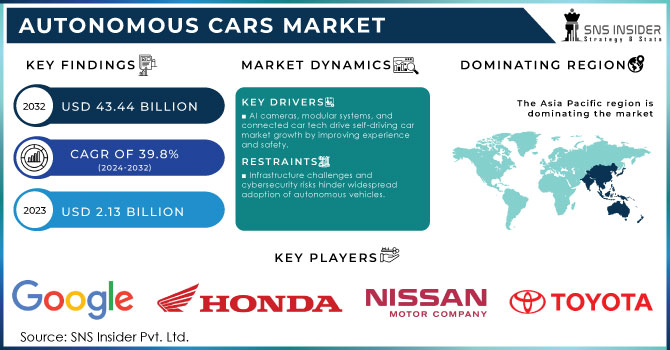
The Autonomous Cars Market Size was valued at USD 2.13 billion in 2023 and is expected to reach USD 43.44 billion by 2032 and grow at a CAGR of 39.8% over the forecast period 2024-2032.
Autonomous vehicles, also known as self-driving cars, utilize a combination of sensors and artificial intelligence to navigate and operate without human input. These cars utilize LiDAR, RADAR, and cameras to make a 3D outline of their environment and utilize this data to perform tasks like situational analysis, motion planning, and trajectory control. It has found that over 90% of street accidents include human error. Autonomous vehicles eliminate this risk by depending on advanced sensors and computers to make choices. Not at all like human drivers, they do not get diverted, intoxicated, or exhausted. This continuous and objective perception of the environment permits them to respond much quicker and avoid situations that might lead to accidents. As autonomous vehicle technology develops, it has the potential to drastically reduces crashes, driving to more secure roads for everyone. This potential for expanded security is a major driving force behind the advancement and adoption of autonomous vehicles. In expansion to security benefits, autonomous vehicles also offer advantages like reduced traffic blockage and emissions due to more efficient operation. These variables, combined with the safety improvements, are driving major automakers and tech companies to invest heavily in autonomous vehicle development.
KEY DRIVERS:
AI cameras, modular systems, and connected car tech drive self-driving car market growth by improving experience and safety.
The Advanced technology is fueling the growth of self-driving cars. AI-powered camera systems provide a smoother ride and ensure passenger safety. Modular self-driving systems, where carmakers can choose the tech they integrate, are crucial for wider adoption. These advancements entice consumers. Additionally, the development of dynamic mobility apps and connected car technologies are key drivers, making self-driving cars an increasingly attractive option.
Self-driving cars promise cheaper rides, fewer accidents, and lower emissions.
RESTRAINTS:
Infrastructure challenges and cybersecurity risks hinder widespread adoption of autonomous vehicles.
The problems are still there, despite Autonomous Vehicle promises to improve road safety through AI powered decision making. Poor infrastructure in both developed and developing nations can confuse a self-driving car's sensors. Additionally, the heavy reliance on data collection for vehicle improvement creates a vulnerability. Cyberattacks exploiting security weaknesses could potentially disrupt vehicle operations and endanger passenger safety.
OPPORTUNITIES:
Development of self-driving trucks can revolutionize logistics by optimizing delivery routes and reducing transportation costs.
Advancements in mapping technology can unlock the potential for autonomous vehicles in complex urban environments, expanding their reach.
CHALLENGES:
Limited sensor effectiveness in poor weather or complex road environments can hinder a self-driving car's ability to navigate safely.
High costs for development, manufacturing, and integrating advanced sensor and AI technologies remain a barrier to mass adoption.
By Type:
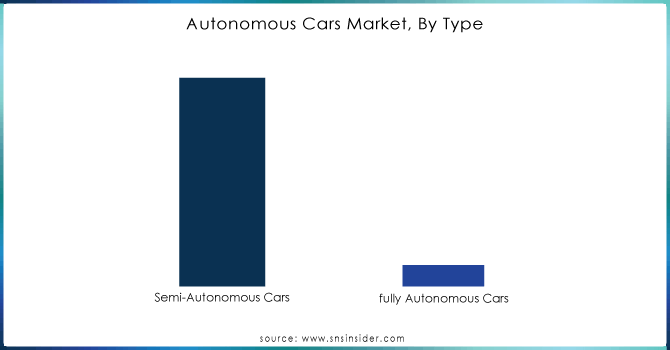
Semi-Autonomous Cars is the dominating sub-segment in the autonomous cars market by type holding around 95% of market share due to their lower development costs. Sophisticated sensors and AI systems aren't required to the same extent as fully autonomous cars, making them more readily available at a consumer-friendly price point. The regulatory landscape for fully autonomous vehicles is still under construction, whereas semi-autonomous features already have established guidelines.
Get Customized Report as per your Business Requirement - Request For Customized Report
By Autonomy Level:
Level 2 Autonomy is the dominating sub-segment in the autonomous cars market by autonomy level holding around 70% of market share. Level 2 features are well-developed and readily available in many mass-produced vehicles. Furthermore, they strike a sweet spot between affordability and offering advanced driver assistance features. Consumers are increasingly familiar and comfortable navigating with Level 2 systems, further solidifying its dominance.
By Vehicle Type:
Passenger cars is the dominating sub-segment in the autonomous cars market by vehicle type holding around 74% of market share due to the sheer size of the existing passenger car market compared to commercial vehicles. Major players in the automotive and tech industries are also prioritizing development efforts in passenger car technology.
KEY PLAYERS:
The major key players are Audi AG, Google LLC, Honda Motor Co., Ltd.; Nissan Motor Company; Tesla; Toyota Motor Corporation; Uber Technologies, BMW AG, Daimler AG, Ford Motor Company, General Motors, Nissan Motors Co., Ltd., Tesla, Inc., Robert Bosch GMBH, Aptiv, Continental AG, Denso Corporation, Honda Motor Co., Ltd., Toyota Motor Corporation, and Volkswagen AG.
REGIONAL ANALYSES
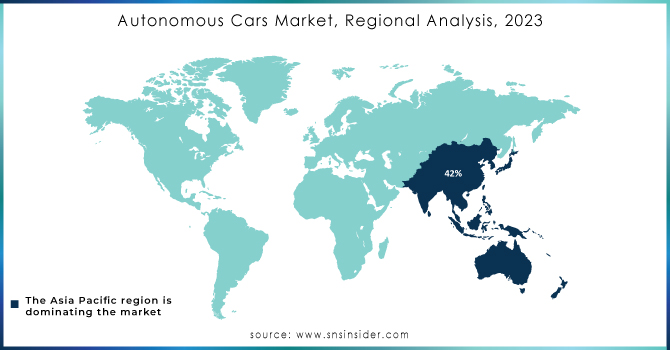
The Asia Pacific region is dominating the autonomous cars market holding around 42% of market share due to government support, massive populations with growing middle classes, and strong tech infrastructure. North America is the second highest region in this market with 35% of market share due to established automakers, advancements in key components, and a consumer base open to new technology. Europe is experiencing the fastest growth holding a share of 18% with projected CAGR of 28.4% due to its focus on stringent safety regulations, strong existing infrastructure, and increasing investments in research and development.
In Dec. 2023: Mercedes-Benz announced that they got the approval from California and Nevada to use special turquoise lights on their self-driving cars. These lights will help other drivers easily identify vehicles operating in autonomous mode, promoting better awareness and potentially safer roads.
In April 2023: DiDi announced that it is developing self-driving taxis for launch in 2025. They've also unveiled two key hardware components: the DiDi Beiyao Beta LiDAR, co-developed with Benewake, a Chinese tech firm. This move positions DiDi as a major player in the autonomous vehicle race.
Report Attributes | Details |
---|---|
Market Size in 2023 | US$ 2.13 Billion |
Market Size by 2032 |
US$ 43.44 Billion |
CAGR | CAGR of 39.8% From 2024 to 2032 |
Base Year | 2023 |
Forecast Period | 2024-2032 |
Historical Data | 2020-2022 |
Report Scope & Coverage | Market Size, Segments Analysis, Competitive Landscape, Regional Analysis, DROC & SWOT Analysis, Forecast Outlook |
Key Segments | • by Type (Semi-Autonomous cars, Fully-Autonomous cars), • by Autonomy Level (Level 1, Level 2, Level 3, Level 4) • by Vehicle Type (Passenger cars, Commercial vehicles) |
Regional Analysis/Coverage | North America (US, Canada, Mexico), Europe (Eastern Europe [Poland, Romania, Hungary, Turkey, Rest of Eastern Europe] Western Europe] Germany, France, UK, Italy, Spain, Netherlands, Switzerland, Austria, Rest of Western Europe]), Asia Pacific (China, India, Japan, South Korea, Vietnam, Singapore, Australia, Rest of Asia Pacific), Middle East & Africa (Middle East [UAE, Egypt, Saudi Arabia, Qatar, Rest of Middle East], Africa [Nigeria, South Africa, Rest of Africa], Latin America (Brazil, Argentina, Colombia Rest of Latin America |
Company Profiles | Audi AG, Google LLC, Honda Motor Co., Ltd.; Nissan Motor Company; Tesla; Toyota Motor Corporation; Uber Technologies, BMW AG, Daimler AG, Ford Motor Company, General Motors, Nissan Motors Co., Ltd., Tesla, Inc., Robert Bosch GMBH, Aptiv, Continental AG, Denso Corporation, Honda Motor Co., Ltd., Toyota Motor Corporation, and Volkswagen AG |
Key Drivers | •Increasing research and development activity for self-driving vehicles. •Auto-tech investment is increasing. |
RESTRAINTS | •The large first investment may limit expansion. •The considerable risk of hackers gaining unauthorized access to system data and vehicle functions could stifle market expansion. |
An autonomous car is one that can drive itself without the assistance of a human. Depending on the extent of automation, many types of self-driving or autonomous vehicles are developed.
Ans: The Expected value of Autonomous Cars Market USD 43.44 billion in 2032
These cars are being designed to reduce human-caused accidents, reduce traffic congestion, and provide hassle-free transportation.
The rise of ride-sharing will be aided by the development of driverless vehicles.
Autonomous vehicles are expensive.
Safety and security.
Infrastructure deficits in developing nations.
North America region dominate the Autonomous Cars market
Table of Contents:
1. Introduction
1.1 Market Definition
1.2 Scope (Inclusion and Exclusions)
1.3 Research Assumptions
2. Executive Summary
2.1 Market Overview
2.2 Regional Synopsis
2.3 Competitive Summary
3. Research Methodology
3.1 Top-Down Approach
3.2 Bottom-up Approach
3.3. Data Validation
3.4 Primary Interviews
4. Market Dynamics Impact Analysis
4.1 Market Driving Factors Analysis
4.1.1 Drivers
4.1.2 Restraints
4.1.3 Opportunities
4.1.4 Challenges
4.2 PESTLE Analysis
4.3 Porter’s Five Forces Model
5. Statistical Insights and Trends Reporting
5.1 Vehicle Production and Sales Volumes, 2020-2032, by Region
5.2 Emission Standards Compliance, by Region
5.3 Vehicle Technology Adoption, by Region
5.4 Consumer Preferences, by Region
5.5 Aftermarket Trends (Data on vehicle maintenance, parts, and services)
6. Competitive Landscape
6.1 List of Major Companies, By Region
6.2 Market Share Analysis, By Region
6.3 Product Benchmarking
6.3.1 Product specifications and features
6.3.2 Pricing
6.4 Strategic Initiatives
6.4.1 Marketing and promotional activities
6.4.2 Distribution and supply chain strategies
6.4.3 Expansion plans and new product launches
6.4.4 Strategic partnerships and collaborations
6.5 Technological Advancements
6.6 Market Positioning and Branding
7. Autonomous Cars Device Market Segmentation, by Type
7.1 Chapter Overview
7.2 Semi-Autonomous cars
7.2.1 Semi-Autonomous cars Market Trends Analysis (2020-2032)
7.2.2 Semi-Autonomous cars Market Size Estimates and Forecasts to 2032 (USD Billion)
7.3 Fully-Autonomous cars
7.3.1 Fully-Autonomous cars Market Trends Analysis (2020-2032)
7.3.2 Fully-Autonomous cars Market Size Estimates and Forecasts to 2032 (USD Billion)
8. Autonomous Cars Device Market Segmentation, by Autonomy Level
8.1 Chapter Overview
8.2 Level 1
8.2.1 Level 1 Market Trends Analysis (2020-2032)
8.2.2 Level 1 Market Size Estimates and Forecasts to 2032 (USD Billion)
8.3 Level 2
8.3.1 Level 2 Market Trends Analysis (2020-2032)
8.3.2 Level 2 Market Size Estimates and Forecasts to 2032 (USD Billion)
8.4 Level 3
8.4.1 Level 3 Market Trends Analysis (2020-2032)
8.4.2 Level 3 Market Size Estimates and Forecasts to 2032 (USD Billion)
8.5 Level 4
8.5.1 Level 4 Market Trends Analysis (2020-2032)
8.5.2 Level 4 Market Size Estimates and Forecasts to 2032 (USD Billion)
9. Autonomous Cars Device Market Segmentation, by Vehicle Type
9.1 Chapter Overview
9.2 Passenger cars
9.2.1 Passenger cars Market Trends Analysis (2020-2032)
9.2.2 Passenger cars Market Size Estimates and Forecasts to 2032 (USD Billion)
9.3 Commercial Vehicles
9.3.1 Commercial Vehicles Market Trends Analysis (2020-2032)
9.3.2 Commercial Vehicles Market Size Estimates and Forecasts to 2032 (USD Billion)
10. Regional Analysis
10.1 Chapter Overview
10.2 North America
10.2.1 Trends Analysis
10.2.2 North America Autonomous Cars Device Market Estimates and Forecasts, by Country (2020-2032) (USD Billion)
10.2.3 North America Autonomous Cars Device Market Estimates and Forecasts, by Type (2020-2032) (USD Billion)
10.2.4 North America Autonomous Cars Device Market Estimates and Forecasts, by Autonomy Level (2020-2032) (USD Billion)
10.2.5 North America Autonomous Cars Device Market Estimates and Forecasts, by Vehicle Type (2020-2032) (USD Billion)
10.2.6 USA
10.2.6.1 USA Autonomous Cars Device Market Estimates and Forecasts, by Type (2020-2032) (USD Billion)
10.2.6.2 USA Autonomous Cars Device Market Estimates and Forecasts, by Autonomy Level (2020-2032) (USD Billion)
10.2.6.3 USA Autonomous Cars Device Market Estimates and Forecasts, by Vehicle Type (2020-2032) (USD Billion)
10.2.7 Canada
10.2.7.1 Canada Autonomous Cars Device Market Estimates and Forecasts, by Type (2020-2032) (USD Billion)
10.2.7.2 Canada Autonomous Cars Device Market Estimates and Forecasts, by Autonomy Level (2020-2032) (USD Billion)
10.2.7.3 Canada Autonomous Cars Device Market Estimates and Forecasts, by Vehicle Type (2020-2032) (USD Billion)
10.2.8 Mexico
10.2.8.1 Mexico Autonomous Cars Device Market Estimates and Forecasts, by Type (2020-2032) (USD Billion)
10.2.8.2 Mexico Autonomous Cars Device Market Estimates and Forecasts, by Autonomy Level (2020-2032) (USD Billion)
10.2.8.3 Mexico Autonomous Cars Device Market Estimates and Forecasts, by Vehicle Type (2020-2032) (USD Billion)
10.3 Europe
10.3.1 Eastern Europe
10.3.1.1 Trends Analysis
10.3.1.2 Eastern Europe Autonomous Cars Device Market Estimates and Forecasts, by Country (2020-2032) (USD Billion)
10.3.1.3 Eastern Europe Autonomous Cars Device Market Estimates and Forecasts, by Type (2020-2032) (USD Billion)
10.3.1.4 Eastern Europe Autonomous Cars Device Market Estimates and Forecasts, by Autonomy Level (2020-2032) (USD Billion)
10.3.1.5 Eastern Europe Autonomous Cars Device Market Estimates and Forecasts, by Vehicle Type (2020-2032) (USD Billion)
10.3.1.6 Poland
10.3.1.6.1 Poland Autonomous Cars Device Market Estimates and Forecasts, by Type (2020-2032) (USD Billion)
10.3.1.6.2 Poland Autonomous Cars Device Market Estimates and Forecasts, by Autonomy Level (2020-2032) (USD Billion)
10.3.1.6.3 Poland Autonomous Cars Device Market Estimates and Forecasts, by Vehicle Type (2020-2032) (USD Billion)
10.3.1.7 Romania
10.3.1.7.1 Romania Autonomous Cars Device Market Estimates and Forecasts, by Type (2020-2032) (USD Billion)
10.3.1.7.2 Romania Autonomous Cars Device Market Estimates and Forecasts, by Autonomy Level (2020-2032) (USD Billion)
10.3.1.7.3 Romania Autonomous Cars Device Market Estimates and Forecasts, by Vehicle Type (2020-2032) (USD Billion)
10.3.1.8 Hungary
10.3.1.8.1 Hungary Autonomous Cars Device Market Estimates and Forecasts, by Type (2020-2032) (USD Billion)
10.3.1.8.2 Hungary Autonomous Cars Device Market Estimates and Forecasts, by Autonomy Level (2020-2032) (USD Billion)
10.3.1.8.3 Hungary Autonomous Cars Device Market Estimates and Forecasts, by Vehicle Type (2020-2032) (USD Billion)
10.3.1.9 Turkey
10.3.1.9.1 Turkey Autonomous Cars Device Market Estimates and Forecasts, by Type (2020-2032) (USD Billion)
10.3.1.9.2 Turkey Autonomous Cars Device Market Estimates and Forecasts, by Autonomy Level (2020-2032) (USD Billion)
10.3.1.9.3 Turkey Autonomous Cars Device Market Estimates and Forecasts, by Vehicle Type (2020-2032) (USD Billion)
10.3.1.10 Rest of Eastern Europe
10.3.1.10.1 Rest of Eastern Europe Autonomous Cars Device Market Estimates and Forecasts, by Type (2020-2032) (USD Billion)
10.3.1.10.2 Rest of Eastern Europe Autonomous Cars Device Market Estimates and Forecasts, by Autonomy Level (2020-2032) (USD Billion)
10.3.1.10.3 Rest of Eastern Europe Autonomous Cars Device Market Estimates and Forecasts, by Vehicle Type (2020-2032) (USD Billion)
10.3.2 Western Europe
10.3.2.1 Trends Analysis
10.3.2.2 Western Europe Autonomous Cars Device Market Estimates and Forecasts, by Country (2020-2032) (USD Billion)
10.3.2.3 Western Europe Autonomous Cars Device Market Estimates and Forecasts, by Type (2020-2032) (USD Billion)
10.3.2.4 Western Europe Autonomous Cars Device Market Estimates and Forecasts, by Autonomy Level (2020-2032) (USD Billion)
10.3.2.5 Western Europe Autonomous Cars Device Market Estimates and Forecasts, by Vehicle Type (2020-2032) (USD Billion)
10.3.2.6 Germany
10.3.2.6.1 Germany Autonomous Cars Device Market Estimates and Forecasts, by Type (2020-2032) (USD Billion)
10.3.2.6.2 Germany Autonomous Cars Device Market Estimates and Forecasts, by Autonomy Level (2020-2032) (USD Billion)
10.3.2.6.3 Germany Autonomous Cars Device Market Estimates and Forecasts, by Vehicle Type (2020-2032) (USD Billion)
10.3.2.7 France
10.3.2.7.1 France Autonomous Cars Device Market Estimates and Forecasts, by Type (2020-2032) (USD Billion)
10.3.2.7.2 France Autonomous Cars Device Market Estimates and Forecasts, by Autonomy Level (2020-2032) (USD Billion)
10.3.2.7.3 France Autonomous Cars Device Market Estimates and Forecasts, by Vehicle Type (2020-2032) (USD Billion)
10.3.2.8 UK
10.3.2.8.1 UK Autonomous Cars Device Market Estimates and Forecasts, by Type (2020-2032) (USD Billion)
10.3.2.8.2 UK Autonomous Cars Device Market Estimates and Forecasts, by Autonomy Level (2020-2032) (USD Billion)
10.3.2.8.3 UK Autonomous Cars Device Market Estimates and Forecasts, by Vehicle Type (2020-2032) (USD Billion)
10.3.2.9 Italy
10.3.2.9.1 Italy Autonomous Cars Device Market Estimates and Forecasts, by Type (2020-2032) (USD Billion)
10.3.2.9.2 Italy Autonomous Cars Device Market Estimates and Forecasts, by Autonomy Level (2020-2032) (USD Billion)
10.3.2.9.3 Italy Autonomous Cars Device Market Estimates and Forecasts, by Vehicle Type (2020-2032) (USD Billion)
10.3.2.10 Spain
10.3.2.10.1 Spain Autonomous Cars Device Market Estimates and Forecasts, by Type (2020-2032) (USD Billion)
10.3.2.10.2 Spain Autonomous Cars Device Market Estimates and Forecasts, by Autonomy Level (2020-2032) (USD Billion)
10.3.2.10.3 Spain Autonomous Cars Device Market Estimates and Forecasts, by Vehicle Type (2020-2032) (USD Billion)
10.3.2.11 Netherlands
10.3.2.11.1 Netherlands Autonomous Cars Device Market Estimates and Forecasts, by Type (2020-2032) (USD Billion)
10.3.2.11.2 Netherlands Autonomous Cars Device Market Estimates and Forecasts, by Autonomy Level (2020-2032) (USD Billion)
10.3.2.11.3 Netherlands Autonomous Cars Device Market Estimates and Forecasts, by Vehicle Type (2020-2032) (USD Billion)
10.3.2.12 Switzerland
10.3.2.12.1 Switzerland Autonomous Cars Device Market Estimates and Forecasts, by Type (2020-2032) (USD Billion)
10.3.2.12.2 Switzerland Autonomous Cars Device Market Estimates and Forecasts, by Autonomy Level (2020-2032) (USD Billion)
10.3.2.12.3 Switzerland Autonomous Cars Device Market Estimates and Forecasts, by Vehicle Type (2020-2032) (USD Billion)
10.3.2.13 Austria
10.3.2.13.1 Austria Autonomous Cars Device Market Estimates and Forecasts, by Type (2020-2032) (USD Billion)
10.3.2.13.2 Austria Autonomous Cars Device Market Estimates and Forecasts, by Autonomy Level (2020-2032) (USD Billion)
10.3.2.13.3 Austria Autonomous Cars Device Market Estimates and Forecasts, by Vehicle Type (2020-2032) (USD Billion)
10.3.2.14 Rest of Western Europe
10.3.2.14.1 Rest of Western Europe Autonomous Cars Device Market Estimates and Forecasts, by Type (2020-2032) (USD Billion)
10.3.2.14.2 Rest of Western Europe Autonomous Cars Device Market Estimates and Forecasts, by Autonomy Level (2020-2032) (USD Billion)
10.3.2.14.3 Rest of Western Europe Autonomous Cars Device Market Estimates and Forecasts, by Vehicle Type (2020-2032) (USD Billion)
10.4 Asia Pacific
10.4.1 Trends Analysis
10.4.2 Asia Pacific Autonomous Cars Device Market Estimates and Forecasts, by Country (2020-2032) (USD Billion)
10.4.3 Asia Pacific Autonomous Cars Device Market Estimates and Forecasts, by Type (2020-2032) (USD Billion)
10.4.4 Asia Pacific Autonomous Cars Device Market Estimates and Forecasts, by Autonomy Level (2020-2032) (USD Billion)
10.4.5 Asia Pacific Autonomous Cars Device Market Estimates and Forecasts, by Vehicle Type (2020-2032) (USD Billion)
10.4.6 China
10.4.6.1 China Autonomous Cars Device Market Estimates and Forecasts, by Type (2020-2032) (USD Billion)
10.4.6.2 China Autonomous Cars Device Market Estimates and Forecasts, by Autonomy Level (2020-2032) (USD Billion)
10.4.6.3 China Autonomous Cars Device Market Estimates and Forecasts, by Vehicle Type (2020-2032) (USD Billion)
10.4.7 India
10.4.7.1 India Autonomous Cars Device Market Estimates and Forecasts, by Type (2020-2032) (USD Billion)
10.4.7.2 India Autonomous Cars Device Market Estimates and Forecasts, by Autonomy Level (2020-2032) (USD Billion)
10.4.7.3 India Autonomous Cars Device Market Estimates and Forecasts, by Vehicle Type (2020-2032) (USD Billion)
10.4.8 Japan
10.4.8.1 Japan Autonomous Cars Device Market Estimates and Forecasts, by Type (2020-2032) (USD Billion)
10.4.8.2 Japan Autonomous Cars Device Market Estimates and Forecasts, by Autonomy Level (2020-2032) (USD Billion)
10.4.8.3 Japan Autonomous Cars Device Market Estimates and Forecasts, by Vehicle Type (2020-2032) (USD Billion)
10.4.9 South Korea
10.4.9.1 South Korea Autonomous Cars Device Market Estimates and Forecasts, by Type (2020-2032) (USD Billion)
10.4.9.2 South Korea Autonomous Cars Device Market Estimates and Forecasts, by Autonomy Level (2020-2032) (USD Billion)
10.4.9.3 South Korea Autonomous Cars Device Market Estimates and Forecasts, by Vehicle Type (2020-2032) (USD Billion)
10.4.10 Vietnam
10.4.10.1 Vietnam Autonomous Cars Device Market Estimates and Forecasts, by Type (2020-2032) (USD Billion)
10.4.10.2 Vietnam Autonomous Cars Device Market Estimates and Forecasts, by Autonomy Level (2020-2032) (USD Billion)
10.4.10.3 Vietnam Autonomous Cars Device Market Estimates and Forecasts, by Vehicle Type (2020-2032) (USD Billion)
10.4.11 Singapore
10.4.11.1 Singapore Autonomous Cars Device Market Estimates and Forecasts, by Type (2020-2032) (USD Billion)
10.4.11.2 Singapore Autonomous Cars Device Market Estimates and Forecasts, by Autonomy Level (2020-2032) (USD Billion)
10.4.11.3 Singapore Autonomous Cars Device Market Estimates and Forecasts, by Vehicle Type (2020-2032) (USD Billion)
10.4.12 Australia
10.4.12.1 Australia Autonomous Cars Device Market Estimates and Forecasts, by Type (2020-2032) (USD Billion)
10.4.12.2 Australia Autonomous Cars Device Market Estimates and Forecasts, by Autonomy Level (2020-2032) (USD Billion)
10.4.12.3 Australia Autonomous Cars Device Market Estimates and Forecasts, by Vehicle Type (2020-2032) (USD Billion)
10.4.13 Rest of Asia Pacific
10.4.13.1 Rest of Asia Pacific Autonomous Cars Device Market Estimates and Forecasts, by Type (2020-2032) (USD Billion)
10.4.13.2 Rest of Asia Pacific Autonomous Cars Device Market Estimates and Forecasts, by Autonomy Level (2020-2032) (USD Billion)
10.4.13.3 Rest of Asia Pacific Autonomous Cars Device Market Estimates and Forecasts, by Vehicle Type (2020-2032) (USD Billion)
10.5 Middle East and Africa
10.5.1 Middle East
10.5.1.1 Trends Analysis
10.5.1.2 Middle East Autonomous Cars Device Market Estimates and Forecasts, by Country (2020-2032) (USD Billion)
10.5.1.3 Middle East Autonomous Cars Device Market Estimates and Forecasts, by Type (2020-2032) (USD Billion)
10.5.1.4 Middle East Autonomous Cars Device Market Estimates and Forecasts, by Autonomy Level (2020-2032) (USD Billion)
10.5.1.5 Middle East Autonomous Cars Device Market Estimates and Forecasts, by Vehicle Type (2020-2032) (USD Billion)
10.5.1.6 UAE
10.5.1.6.1 UAE Autonomous Cars Device Market Estimates and Forecasts, by Type (2020-2032) (USD Billion)
10.5.1.6.2 UAE Autonomous Cars Device Market Estimates and Forecasts, by Autonomy Level (2020-2032) (USD Billion)
10.5.1.6.3 UAE Autonomous Cars Device Market Estimates and Forecasts, by Vehicle Type (2020-2032) (USD Billion)
10.5.1.7 Egypt
10.5.1.7.1 Egypt Autonomous Cars Device Market Estimates and Forecasts, by Type (2020-2032) (USD Billion)
10.5.1.7.2 Egypt Autonomous Cars Device Market Estimates and Forecasts, by Autonomy Level (2020-2032) (USD Billion)
10.5.1.7.3 Egypt Autonomous Cars Device Market Estimates and Forecasts, by Vehicle Type (2020-2032) (USD Billion)
10.5.1.8 Saudi Arabia
10.5.1.8.1 Saudi Arabia Autonomous Cars Device Market Estimates and Forecasts, by Type (2020-2032) (USD Billion)
10.5.1.8.2 Saudi Arabia Autonomous Cars Device Market Estimates and Forecasts, by Autonomy Level (2020-2032) (USD Billion)
10.5.1.8.3 Saudi Arabia Autonomous Cars Device Market Estimates and Forecasts, by Vehicle Type (2020-2032) (USD Billion)
10.5.1.9 Qatar
10.5.1.9.1 Qatar Autonomous Cars Device Market Estimates and Forecasts, by Type (2020-2032) (USD Billion)
10.5.1.9.2 Qatar Autonomous Cars Device Market Estimates and Forecasts, by Autonomy Level (2020-2032) (USD Billion)
10.5.1.9.3 Qatar Autonomous Cars Device Market Estimates and Forecasts, by Vehicle Type (2020-2032) (USD Billion)
10.5.1.10 Rest of Middle East
10.5.1.10.1 Rest of Middle East Autonomous Cars Device Market Estimates and Forecasts, by Type (2020-2032) (USD Billion)
10.5.1.10.2 Rest of Middle East Autonomous Cars Device Market Estimates and Forecasts, by Autonomy Level (2020-2032) (USD Billion)
10.5.1.10.3 Rest of Middle East Autonomous Cars Device Market Estimates and Forecasts, by Vehicle Type (2020-2032) (USD Billion)
10.5.2 Africa
10.5.2.1 Trends Analysis
10.5.2.2 Africa Autonomous Cars Device Market Estimates and Forecasts, by Country (2020-2032) (USD Billion)
10.5.2.3 Africa Autonomous Cars Device Market Estimates and Forecasts, by Type (2020-2032) (USD Billion)
10.5.2.4 Africa Autonomous Cars Device Market Estimates and Forecasts, by Autonomy Level (2020-2032) (USD Billion)
10.5.2.5 Africa Autonomous Cars Device Market Estimates and Forecasts, by Vehicle Type (2020-2032) (USD Billion)
10.5.2.6 South Africa
10.5.2.6.1 South Africa Autonomous Cars Device Market Estimates and Forecasts, by Type (2020-2032) (USD Billion)
10.5.2.6.2 South Africa Autonomous Cars Device Market Estimates and Forecasts, by Autonomy Level (2020-2032) (USD Billion)
10.5.2.6.3 South Africa Autonomous Cars Device Market Estimates and Forecasts, by Vehicle Type (2020-2032) (USD Billion)
10.5.2.7 Nigeria
10.5.2.7.1 Nigeria Autonomous Cars Device Market Estimates and Forecasts, by Type (2020-2032) (USD Billion)
10.5.2.7.2 Nigeria Autonomous Cars Device Market Estimates and Forecasts, by Autonomy Level (2020-2032) (USD Billion)
10.5.2.7.3 Nigeria Autonomous Cars Device Market Estimates and Forecasts, by Vehicle Type (2020-2032) (USD Billion)
10.5.2.8 Rest of Africa
10.5.2.8.1 Rest of Africa Autonomous Cars Device Market Estimates and Forecasts, by Type (2020-2032) (USD Billion)
10.5.2.8.2 Rest of Africa Autonomous Cars Device Market Estimates and Forecasts, by Autonomy Level (2020-2032) (USD Billion)
10.5.2.8.3 Rest of Africa Autonomous Cars Device Market Estimates and Forecasts, by Vehicle Type (2020-2032) (USD Billion)
10.6 Latin America
10.6.1 Trends Analysis
10.6.2 Latin America Autonomous Cars Device Market Estimates and Forecasts, by Country (2020-2032) (USD Billion)
10.6.3 Latin America Autonomous Cars Device Market Estimates and Forecasts, by Type (2020-2032) (USD Billion)
10.6.4 Latin America Autonomous Cars Device Market Estimates and Forecasts, by Autonomy Level (2020-2032) (USD Billion)
10.6.5 Latin America Autonomous Cars Device Market Estimates and Forecasts, by Vehicle Type (2020-2032) (USD Billion)
10.6.6 Brazil
10.6.6.1 Brazil Autonomous Cars Device Market Estimates and Forecasts, by Type (2020-2032) (USD Billion)
10.6.6.2 Brazil Autonomous Cars Device Market Estimates and Forecasts, by Autonomy Level (2020-2032) (USD Billion)
10.6.6.3 Brazil Autonomous Cars Device Market Estimates and Forecasts, by Vehicle Type (2020-2032) (USD Billion)
10.6.7 Argentina
10.6.7.1 Argentina Autonomous Cars Device Market Estimates and Forecasts, by Type (2020-2032) (USD Billion)
10.6.7.2 Argentina Autonomous Cars Device Market Estimates and Forecasts, by Autonomy Level (2020-2032) (USD Billion)
10.6.7.3 Argentina Autonomous Cars Device Market Estimates and Forecasts, by Vehicle Type (2020-2032) (USD Billion)
10.6.8 Colombia
10.6.8.1 Colombia Autonomous Cars Device Market Estimates and Forecasts, by Type (2020-2032) (USD Billion)
10.6.8.2 Colombia Autonomous Cars Device Market Estimates and Forecasts, by Autonomy Level (2020-2032) (USD Billion)
10.6.8.3 Colombia Autonomous Cars Device Market Estimates and Forecasts, by Vehicle Type (2020-2032) (USD Billion)
10.6.9 Rest of Latin America
10.6.9.1 Rest of Latin America Autonomous Cars Device Market Estimates and Forecasts, by Type (2020-2032) (USD Billion)
10.6.9.2 Rest of Latin America Autonomous Cars Device Market Estimates and Forecasts, by Autonomy Level (2020-2032) (USD Billion)
10.6.9.3 Rest of Latin America Autonomous Cars Device Market Estimates and Forecasts, by Vehicle Type (2020-2032) (USD Billion)
11. Company Profiles
11.1 Audi AG
11.1.1 Company Overview
11.1.2 Financial
11.1.3 Products/ Services Offered
11.1.4 SWOT Analysis
11.2 Honda Motor Co., Ltd.
11.2.1 Company Overview
11.2.2 Financial
11.2.3 Products/ Services Offered
11.2.4 SWOT Analysis
11.3 Tesla
11.3.1 Company Overview
11.3.2 Financial
11.3.3 Products/ Services Offered
11.3.4 SWOT Analysis
11.4 Toyota Motor Corporation
11.4.1 Company Overview
11.4.2 Financial
11.4.3 Products/ Services Offered
11.4.4 SWOT Analysis
11.5 Uber Technologies
11.5.1 Company Overview
11.5.2 Financial
11.5.3 Products/ Services Offered
11.5.4 SWOT Analysis
11.6 BMW AG
11.6.1 Company Overview
11.6.2 Financial
11.6.3 Products/ Services Offered
11.6.4 SWOT Analysis
11.7 Daimler AG
11.7.1 Company Overview
11.7.2 Financial
11.7.3 Products/ Services Offered
11.7.4 SWOT Analysis
11.8 Ford Motor Company
11.8.1 Company Overview
11.8.2 Financial
11.8.3 Products/ Services Offered
11.8.4 SWOT Analysis
11.9 General Motors
11.9.1 Company Overview
11.9.2 Financial
11.9.3 Products/ Services Offered
11.9.4 SWOT Analysis
11.10 Others
11.10.1 Company Overview
11.10.2 Financial
11.10.3 Products/ Services Offered
11.10.4 SWOT Analysis
12. Use Cases and Best Practices
13. Conclusion
An accurate research report requires proper strategizing as well as implementation. There are multiple factors involved in the completion of good and accurate research report and selecting the best methodology to compete the research is the toughest part. Since the research reports we provide play a crucial role in any company’s decision-making process, therefore we at SNS Insider always believe that we should choose the best method which gives us results closer to reality. This allows us to reach at a stage wherein we can provide our clients best and accurate investment to output ratio.
Each report that we prepare takes a timeframe of 350-400 business hours for production. Starting from the selection of titles through a couple of in-depth brain storming session to the final QC process before uploading our titles on our website we dedicate around 350 working hours. The titles are selected based on their current market cap and the foreseen CAGR and growth.
The 5 steps process:
Step 1: Secondary Research:
Secondary Research or Desk Research is as the name suggests is a research process wherein, we collect data through the readily available information. In this process we use various paid and unpaid databases which our team has access to and gather data through the same. This includes examining of listed companies’ annual reports, Journals, SEC filling etc. Apart from this our team has access to various associations across the globe across different industries. Lastly, we have exchange relationships with various university as well as individual libraries.
Step 2: Primary Research
When we talk about primary research, it is a type of study in which the researchers collect relevant data samples directly, rather than relying on previously collected data. This type of research is focused on gaining content specific facts that can be sued to solve specific problems. Since the collected data is fresh and first hand therefore it makes the study more accurate and genuine.
We at SNS Insider have divided Primary Research into 2 parts.
Part 1 wherein we interview the KOLs of major players as well as the upcoming ones across various geographic regions. This allows us to have their view over the market scenario and acts as an important tool to come closer to the accurate market numbers. As many as 45 paid and unpaid primary interviews are taken from both the demand and supply side of the industry to make sure we land at an accurate judgement and analysis of the market.
This step involves the triangulation of data wherein our team analyses the interview transcripts, online survey responses and observation of on filed participants. The below mentioned chart should give a better understanding of the part 1 of the primary interview.
Part 2: In this part of primary research the data collected via secondary research and the part 1 of the primary research is validated with the interviews from individual consultants and subject matter experts.
Consultants are those set of people who have at least 12 years of experience and expertise within the industry whereas Subject Matter Experts are those with at least 15 years of experience behind their back within the same space. The data with the help of two main processes i.e., FGDs (Focused Group Discussions) and IDs (Individual Discussions). This gives us a 3rd party nonbiased primary view of the market scenario making it a more dependable one while collation of the data pointers.
Step 3: Data Bank Validation
Once all the information is collected via primary and secondary sources, we run that information for data validation. At our intelligence centre our research heads track a lot of information related to the market which includes the quarterly reports, the daily stock prices, and other relevant information. Our data bank server gets updated every fortnight and that is how the information which we collected using our primary and secondary information is revalidated in real time.
Step 4: QA/QC Process
After all the data collection and validation our team does a final level of quality check and quality assurance to get rid of any unwanted or undesired mistakes. This might include but not limited to getting rid of the any typos, duplication of numbers or missing of any important information. The people involved in this process include technical content writers, research heads and graphics people. Once this process is completed the title gets uploader on our platform for our clients to read it.
Step 5: Final QC/QA Process:
This is the last process and comes when the client has ordered the study. In this process a final QA/QC is done before the study is emailed to the client. Since we believe in giving our clients a good experience of our research studies, therefore, to make sure that we do not lack at our end in any way humanly possible we do a final round of quality check and then dispatch the study to the client.
MARKET SEGMENTS:
By Type:
Semi-Autonomous cars
Fully-Autonomous cars
By Autonomy Level:
Level 1
Level 2
Level 3
Level 4
By Vehicle Type:
Passenger cars
Commercial vehicles
Request for Segment Customization as per your Business Requirement: Segment Customization Request
REGIONAL COVERAGE
North America
US
Canada
Mexico
Europe
Eastern Europe
Poland
Romania
Hungary
Turkey
Rest of Eastern Europe
Western Europe
Germany
France
UK
Italy
Spain
Netherlands
Switzerland
Austria
Rest of Western Europe
Asia Pacific
China
India
Japan
South Korea
Vietnam
Singapore
Australia
Rest of Asia Pacific
Middle East & Africa
Middle East
UAE
Egypt
Saudi Arabia
Qatar
Rest of Middle East
Africa
Nigeria
South Africa
Rest of Africa
Latin America
Brazil
Argentina
Colombia
Rest of Latin America
Request for Country Level Research Report: Country Level Customization Request
Available Customization
The Electric 3-Wheeler Market size was valued at USD 2.90 billion in 2023, and is expected to reach USD 7.42 billion by 2032, and grow at a CAGR of 9.88% over the forecast period 2024-2032.
The Automotive Collision Avoidance System Market size was valued at USD 58.05 billion in 2023 and is expected to reach USD 128.38 billion by 2032 and grow at a CAGR of 9.22% over the forecast period 2024-2032.
The Automotive Hinges Market Size was $5.29 billion in 2023 and is expected to reach USD 7.4 billion by 2031 and grow at a CAGR of 4.3% by 2024-2031.
The Advanced Driver Assistance Market Size will reach USD 162.04 billion by 2032, was $56.81 billion in 2023 and will grow at a CAGR of 12.4% by 2024-2032.
The Electric Vehicle On-board Charger Market Size was valued at USD 4.88 billion in 2023 and is expected to reach USD 19.64 billion by 2031 and grow at a CAGR of 19% over the forecast period 2024-2031.
Automotive Electronic Brake System Market Report Scope & Overview:
Hi! Click one of our member below to chat on Phone