Electric Vehicle Connector Market Report Scope & Overview
Get More Information on Electric Vehicle Connector Market - Request Sample Report
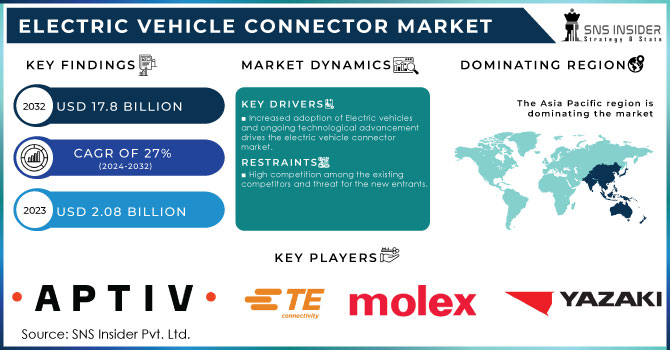
The Electric Vehicle Connector Market Size was recorded at USD 2.08 billion in 2023 and is expected to reach USD 17.8 billion by 2032, growing at a CAGR of 27% over the forecast period 2024-2032.
Due to the increasing global demand for electric vehicles, the market for EV charging connectors is growing swiftly. The need to provide a dependable and efficient infrastructure for charging electric vehicles which are growing more and more popular is driving the market.
The market is growing as a result of consumer desire for fast-charging options and car model compatibility. The market's expansion is, however, constrained by issues including high installation prices and sparse charging infrastructure in some areas. Despite these obstacles, industry participants have a lot of room to grow and develop within the changing electric car ecosystem.
Furthermore, the increasing emphasis on road safety along with surging knowledge about autonomous vehicles has amended the sales of advanced driver-assistance systems (ADAS) such as lane departure warnings, blind-spot monitoring, or automatic emergency braking. A common explanation revolves around the growing popularity of BEVs and PHEVs with ADAS features. This includes ADAS in vehicles, such as the Audi Q5 e-tron or BMW i7 xDrive 60; longer-range BEVs like the Nissan Leaf e+ and Hyundai Ioniq Hybrid Plug-in Hybrid SUVs like that Toyota Harrier PHEV offering greater electric range can now offer more than just driving assistance. There is potential for over USD 55 billion in revenue as the total ADAS feature market globally.
The electric car industry is expanding by leaps and bounds with a huge surge in the demand for new EVs as well as roadside charging stations. For Instance, Up to Feb. 2024, around 61,000 public charging stations with Level 2/ DC charging are, established in the U.S. As like same, china led the market with the highest number of EV charging stations, with more than 2 million, accessed publicly.
Another trend in the electric vehicle connector market is Vehicle-to-Grid (V2G) integration. Fast and reversible modulation of V2G technology allows EVs to be used both as consumers, drawing power from the grid for charging batteries; and alternatively as dischargers to support preservation in energy (thanks to bidirectional flow) helping absorb excess renewable generation during periods when it is available.
MARKET DYNAMICS:
KEY DRIVERS:
-
Increased adoption of Electric vehicles and ongoing technological advancement, drives the electric vehicle connector market.
One of the major factors driving the electric vehicle connector market is the rapid adoption of EVs and hybrid-electric vehicles (HEVs). The rising demand for EV connectors, owing to the necessity of specialized charging plugs in electric vehicles. Is being fueled by several factors: The adoption, etc. due to these ongoing improvements in EV tech, an extended 500 km+ driving range and faster charge times are making the consumer more and more interested. Support for the environmental aspects and reduction of greenhouse gases make EVs an ever more popular means to avoid it. Moreover, Technological advancement also going side-by-side with the development of High-speed charging capabilities, the introduction of a Combination of connectors like AC& DC in a single unit, and increased safety and reliability.
RESTRAINTS:
-
The fluctuation in the price of raw materials and the high cost associated with the Connectors hinders the market growth.
-
High competition among the existing competitors and threat for the new entrants.
KEY MARKET SEGMENTS:
By Propulsion:
BEV (Battery Electric Vehicle) is expected to account for a significant value share of the EV connector market during the forecast period. Because of these complex electrical systems- particularly the electric motors, high-voltage batteries, and an array of actuators-the BEVs require more EV connectors than traditional gasoline-powered vehicles. EV connectors, by contrast, are an essential link in the chain of power and data transfer that weaves among many components inside a BEV to help maintain reliable and efficient operation. The rapidly growing popularity of electric vehicles (EVs) in automotive engineering means that we are now seeing a plethora of highly effective battery management systems (BMS), all designed to constantly monitor the state-of-charge and overall operating conditions for individual cells throughout many charge/discharge cycles useful life.
By Application:
In this segmentation, Battery Management Systems led the market with more than 35% of the revenue share in 2023. These then play a very central part in maintaining the best battery performance and protecting an essential prolongation of its useful life. They monitor important details of the operation, such as current and voltage levels and the internal temperature which ensures that each unit only supplies exactly what is needed to run the electric vehicle motor with minimal stress on battery cells. Battery management systems have power optimization, damage minimization, and the control of charging/discharging processes as their key functions. In addition, Electric Vehicle (EV) connectors as part of the Battery Management System (BMS), also play various important roles including cell monitoring, temperature acquisition and control voltage levels sensing, communication with vehicle control systems such things like SoC estimation/data reporting means, etc. Links in the BMS connect EV connectors to monitoring circuits of individual cells and enable monitoring of their voltage level, temperature rate, or other characteristics.
By Voltage:
In this segmentation, the High Voltage type segment led the market with more than 40% of the market share in 2023. Fast charging of EV batteries is made possible by high voltage connectors, which has a big impact on consumer choice. High-voltage connectors are essential components in electric vehicles. They safely transfer power between the battery, electric motor, and other systems. There are several kinds of these connectors for varied uses, like charging, driving the motor, and running auxiliary systems. Their design incorporates safety elements like as interlocking and waterproofing, which guarantee dependable and effective operation while guarding against electrical risks.
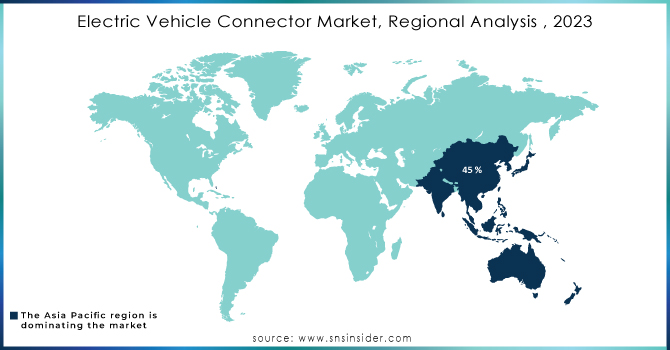
REGIONAL ANALYSES
The Asia Pacific holds the dominant position with more than 45 % of the market share in 2023. As more electric vehicles hit the roads, the demand for charging infrastructure also increases and consequently boosts the EV connectors. Supportive government policies with subsidies and tax breaks for EV purchases further accelerate market growth in this region.
Europe holds the second-highest position in the EV Connector market, due to the stringent emission regulations and ambitious plans to promote electric mobility. Governments of this region also invest heavily in charging infrastructure and offer incentives for EV adoption.
North America is recorded as the fastest-growing region in this market, due to its rapid growth in the EV market. EV ownership is being made possible by government programs that include tax rebates and investments in charging infrastructure.
Get Customized Report as per your Business Requirement - Request For Customized Report
KEY PLAYERS
The major key players are Molex LLC, Aptiv PLC, TE Connectivity, ABB, Yazaki, Schneider Electric, Fujikura, Amphenol, Tesla, Bosch, Huber+Suhner, Sumitomo, and other key players.
RECENT DEVELOPMENTS:
- In Nov. 2023: Compact connectors for automotive components like ECUs, sensors, and lights, the MX81 series, were introduced by Japan Aviation Electronics (JAE). These non-waterproof connectors are made to tuck into small car openings.
-
February 2023: TE Connectivity (TE) and Preddio Technologies (Preddio), have created a partnership to incorporate wireless technology from Preddio's portfolio of solutions, cloud-based analytics together with the energy-efficient sensors from TE.
| Report Attributes | Details |
|---|---|
| Market Size in 2023 | US$ 2.08 billion |
| Market Size by 2032 | US$ 17.8 billion |
| CAGR | CAGR of 27% From 2024 to 2032 |
| Base Year | 2023 |
| Forecast Period | 2024-2032 |
| Historical Data | 2020-2022 |
| Report Scope & Coverage | Market Size, Segments Analysis, Competitive Landscape, Regional Analysis, DROC & SWOT Analysis, Forecast Outlook |
| Key Segments |
• by Propulsion (BEV, HEV, PHEV, FCEV) |
| Regional Analysis/Coverage | North America (US, Canada, Mexico), Europe (Eastern Europe [Poland, Romania, Hungary, Turkey, Rest of Eastern Europe] Western Europe] Germany, France, UK, Italy, Spain, Netherlands, Switzerland, Austria, Rest of Western Europe]), Asia Pacific (China, India, Japan, South Korea, Vietnam, Singapore, Australia, Rest of Asia Pacific), Middle East & Africa (Middle East [UAE, Egypt, Saudi Arabia, Qatar, Rest of Middle East], Africa [Nigeria, South Africa, Rest of Africa], Latin America (Brazil, Argentina, Colombia, Rest of Latin America) |
| Company Profiles | Molex LLC, Aptiv PLC, TE Connectivity, ABB, Yazaki, Schneider Electric, Fujikura, Amphenol, Tesla, Bosch, Huber+Suhner, Sumitomo |
| Key Drivers | • Increased adoption of Electric vehicles and ongoing technological advancement, drives the electric vehicle connector market. |
| RESTRAINTS | • The fluctuation in the price of raw materials and the high cost associated with the Connectors hinders the market growth.
• High competition among the existing competitors and threat for the new entrants. |
Frequently Asked Questions
Ans:- The study includes a comprehensive analysis of market trends, as well as present and future market forecasts. DROC analysis, as well as impact analysis for the projected period. Porter’s five forces analysis aids in the study of buyer and supplier potential as well as the competitive landscape etc.
Ans:- Yes.
Ans:- The adoption of electric vehicles & integration of all-EV charging station systems are the primary market drivers for the Electric Vehicle Connector market.
Ans:- Asia pacific region is anticipated to be the primary driver of the market.
Ans:- The market size is expected to reach USD17.8 billion by 2032.
Get in Touch
