Electro-Oxidation Market Analysis & Overview
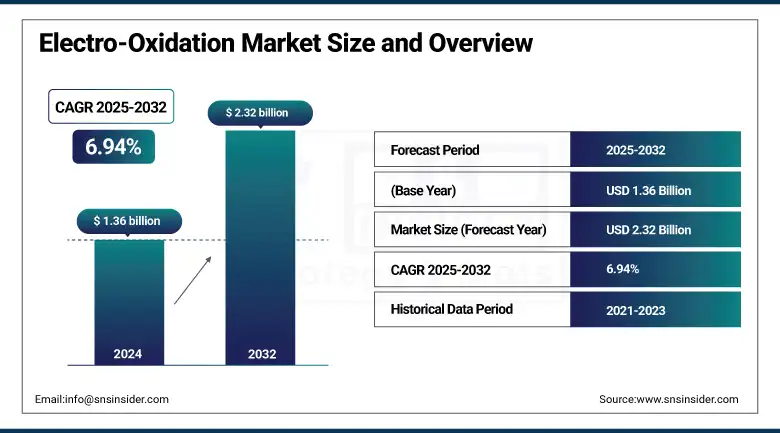
The Electro-Oxidation Market size was valued at USD 1.36 billion in 2024 and is expected to reach USD 2.32 billion by 2032, growing at a CAGR of 6.94% over the forecast period of 2025-2032.
Electro-Oxidation Market Analysis that increases in the demand for compact and decentralized treatment systems, particularly in industrial areas, remote areas, and rural areas where substantial centralized wastewater infrastructure is neither feasible nor affordable. This trend is responding to the demand for modular, energy-efficient, and scalable solutions that can be up and running directly at the jobsite, thus minimizing the complications associated with chemical wastewater to treatment plants. Silenna Energy's compact electro-oxidation units are developing into a widely-adopted application in sectors like pharmaceutical, food & beverage, and oil & gas, as they allow for the degradation of complex organic pollutants and lower the use of chemicals. These systems also fit in well with sustainability objectives by minimizing water pollution and encouraging wastewater recovery, which drive the electro-oxidation market growth.
In the U.S., the EPA has highlighted the importance of decentralized treatment systems in the Clean Water State Revolving Fund (CWSRF), which distributed over USD 7.8 billion in funding in 2023 for state-level water infrastructure investment, including distributed and advanced treatment systems.
This is in addition to the USD 2.7 billion apportioned by the U.S. Department of Agriculture (USDA) in 2023 for rural water treatment projects under its Water and Waste Disposal Loan and Grant Program, further highlighting the federal government’s newfound emphasis on small-scale, innovative treatment technologies, such as electro-oxidation.
Electro-Oxidation Market Size and Forecast:
-
Market Size in 2024: USD 1.36 Billion
-
Market Size by 2032: USD 2.32 Billion
-
CAGR: 6.94% from 2025 to 2032
-
Base Year: 2024
-
Forecast Period: 2025–2032
-
Historical Data: 2022–2024
To Get more information On Electro-Oxidation Market - Request Free Sample Report
Electro-Oxidation Market Trends:
-
Rising adoption of compact and decentralized wastewater treatment systems
-
Increasing demand for advanced oxidation processes to treat complex industrial effluents
-
Growing integration of electro-oxidation with renewable energy sources such as solar and wind
-
Expanding regulatory funding support for distributed and innovative water treatment technologies
-
Rapid deployment in pharmaceutical, textile, chemical, and oil & gas industries
-
Technological advancements in electrode materials such as BDD and MMO for improved efficiency and durability
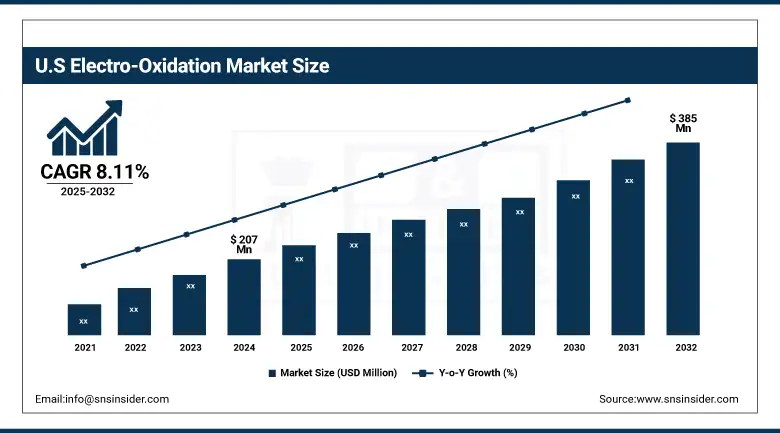
The U.S Electro-Oxidation market size was USD 207million in 2024 and is expected to reach USD 385 million by 2032 and grow at a CAGR of 8.11% over the forecast period of 2025-2032. Its dominance is a function of a large highway network, a large fleet of light trucks and SUVs, and high gasoline consumption per capita. The use of additives is pervasive in consumer retail (in branded products like STP or Lucas Oil) as well as in commercial fleet, especially diesel maintenance. Regulatory programs, such as EPA Tier 3 and CARB fuel standards, have made available low-sulfur, detergent-based fuel a standard product. There’s increasing attention on both biofuels and synthetic fuels, both of which frequently need an additive alteration for purposefulness.
Electro-Oxidation Market Drivers
-
Rising Industrial Wastewater Complexity Drives the Market Growth
Electro-oxidation has been gaining importance as it can efficiently treat complex and nonbiodegradable industrial effluents, especially those from pharmaceuticals, petrochemicals, and dyes. Classic biological techniques do not treat Persistent Organic Pollutants (POPs), and then industries rely on advanced oxidation processes such as electro-oxidation. The system's potential to mineralize toxic pollutants without the generation of secondary sludge is an advantage.
For instance, the 2023 European Union’s Horizon Europe Program has supported €95 million in funding for two projects on innovative wastewater technologies - electrochemical oxidation pursued at the pharma and dye industries.
Electro-Oxidation Market Restrain
-
High Operational and Electrode Replacement Costs May Hamper the Market Growth
The high operating cost due to the consumption of electricity and the maintenance of the electrode is one of the major hindrances to applying the electro-oxidation technology broadly. This demands that electro-oxidation reactions necessitate a steady energy input to produce reactive species (as in hydroxyl radicals) to degrade pollutants. The energy requirement for such long-term or large-scale deployments may lead to significant utility costs from continuous energy consumption, particularly in regions of high electricity costs.
Another major expense is the consumption and renewal of high-performance electrodes, like boron-doped diamond (BDD) and mixed metal oxide (MMO).
Electro-Oxidation Market Opportunities
-
Integration with Renewable Energy for Sustainable Operations Create an Opportunity in the Market
Electro-oxidation technology represents a potential strategy for both environmental and process improvement in combination with renewable energy supplies using solar and wind energy. However, advanced electro-oxidation systems and conventional electro-oxidation systems pose problems of high electricity consumption with consequent high operational cost and environmental damage. But integrating these systems with clean energy production can address them both. The seamless decentralized character of the electro-oxidation process renders it an excellent choice to integrate this process with off-grid or hybrid renewable energy systems, thereby increasing energy security and independence esp., especially in secluded or industrial areas which drive the electro-oxidation market trends.
This approach is in consonance with the global sustainability objectives and is being suitably recognized by the policy-level interventions. For example, in 2023, the US Department of Energy (DOE), as part of a Water-Energy Nexus initiative, granted USD 16 million to pilot projects based on combinations of solar power and electrochemical technologies for wastewater treatment.
Electro-Oxidation Market Segmentation Analysis
By Type
Indirect Electro-Oxidation is the dominating segment, holding a 66.0% share in 2024. Due to its higher oxidation potential and ability to generate strong oxidizing agents like chlorine/hypochlorite. Its application is rapidly expanding in complex wastewater treatment, particularly in the textile and pharmaceutical industries, where resistant compounds must be degraded.
Direct Electro-Oxidation is the fastest growing segment of the electro-oxidation market owing to its simple design, cost-effectiveness, and ability to handle a wide range of contaminants. It is particularly effective in treating organic pollutants without the need for chemical additives, making it a preferred method in municipal and industrial sectors.
By Electrode Material
Mixed Metal Oxide (MMO) Electrodes lead the electro-oxidation market share with the largest share as they offer high conductivity, stability, and durability, making them suitable for large-scale wastewater treatment applications. Their cost-effectiveness and extended lifespan contribute significantly to their dominance.
Boron-doped diamond (BDD) Electrodes are the fastest-growing due to their superior oxidation capabilities, long electrode life, and minimal sludge production. Their increasing adoption in high-strength industrial effluent treatment, such as leachate and chemical wastewater, is driving this growth.
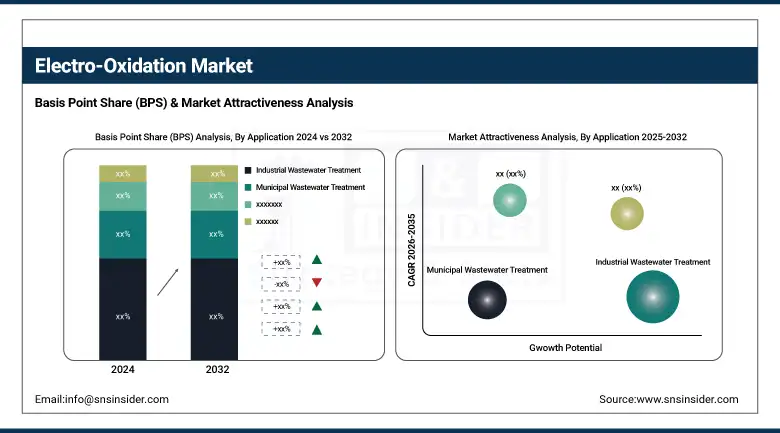
By Application
Industrial Wastewater Treatment holds the largest share as industries including chemicals, textiles, and mining face strict discharge regulations and require effective treatment technologies. The versatility and efficiency of electro-oxidation in degrading recalcitrant pollutants boost its dominance in this segment.
Leachate Treatment is the fastest-growing application due to increasing global concerns over landfill pollution and regulatory pressures. Electro-oxidation offers an effective solution for managing toxic compounds and persistent organic pollutants in leachate streams.
By End-Use Industry
Chemical Manufacturing dominates the end-use segment due to the high volume of hazardous effluents generated, which require advanced oxidation solutions. Electro-oxidation's adaptability and ability to treat high-COD effluents drive its widespread adoption in this industry.
Municipal Utilities are the fastest-growing as governments and municipalities globally invest in decentralized and energy-efficient water treatment infrastructure. The compact design and operational flexibility of electro-oxidation systems make them ideal for urban wastewater treatment and water reuse applications.
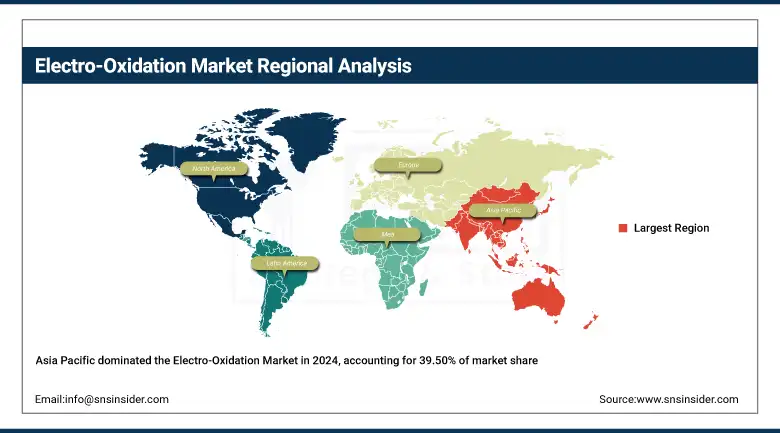
Electro-Oxidation Market Regional Outlook
Asia Pacific Electro-Oxidation market held the largest market share, around 39.50%, in 2024. It is driven by the rapid motorization of middle-income countries such as India, China, Indonesia, and Vietnam. The surge in two- and four-wheeler commoditization is leading to increased requirements for fuel-efficient as well as emission-reducing technologies. Governments are increasingly cracking down on such tailpipe and fuel standards, like India’s BSVI and China’s National VI emission norms, based on or even above Euro standards. Indeed, this has forced OEMs as well as consumers to look for cleaner-burning fuels with the aid of additives. What's more, with urban congestion and inferior quality fuels in some regions, engine fouling is increasing the need for detergent-type fuel additives.
Get Customized Report as per Your Business Requirement - Enquiry Now
In 2024, Chinese company Aorun Advanced Materials increased the capacity of its metal-based fuel detergent by 15,000 MT/year to satisfy the local and export market in South East Asia. It was a transition from reliance on imports to a regional self-sufficient production.
North America is the fastest-growing market in the Electro-Oxidation market as driven primarily by a large fleet of aging vehicles, tough environmental norms and consumer inclination towards performance-enhancing products. In CA and TX, consumers and fleets are forced to buy additives to cut emissions and mileage due to the ever-increasing LEV program and OBD specifications. Consumers are also becoming increasingly aware and have expanded access to detergent containing additive packages typically found in many premium grades of gasoline. Furthermore, the culture of do-it-yourself vehicle maintenance in the United States and Canada has led to high demand for aftermarket additives at the retail level.
In 2023, the US Department of Energy funded pilot-scale production of alternative base oils for additives made from renewable feedstocks in Missouri and Illinois. These advances are intended to lessen reliance on hydrocarbons derived from fossil sources in additive manufacturing, and in line with fuel efficiency policies.
Infineum USA (a joint Anglo-Dutch venture between ExxonMobil and Shell) launched field tests of a new range of fuel additives for heavy-duty trucks that will be compatible for use with both renewable methanol and ethanol blends, with the cooperation of trucking companies in California and Nevada
The European market is innovation and regulation-led, with countries such as Germany, France, and the UK dominating in both production and consumption. The region has the most stringent emissions standards in the world (Euro 6/7), and as such, cleaner fuels and highly effective additives are required. Diesel passenger cars are still everywhere in parts of Europe need regular optimization using cetane boosters and fuel stabilisers. In addition, Europe is driving forward the alternative fuels HVO and biodiesel, which creates new demand for compatibility additives. Sustainability legislations, such as the Green Deal and REACH, also require environmental disclosure of chemical additives.
In 2024, Company Dorf Ketal introduced two new branded fuel additives (mpH for gasoline and milEx for diesel) that are designed specifically to meet strict EU blending mandates. These have already been deployed by distributors in Germany and Spain for retail pump compliance.
Key Players
-
Toray Industries Inc.
-
Teijin Limited
-
Mitsubishi Chemical Group
-
SGL Carbon
-
Zoltek Corporation
-
Gurit Holding AG
-
Park Aerospace Corp.
-
Royal DSM
-
Solvay S.A.
-
Celanese Corporation
-
Rhein Composite GmbH
-
TCR Composites
-
SHD Composite Materials Ltd.
-
North Thin Ply Technology (NTPT)
-
ATC Manufacturing
-
Cytec Engineered Materials
-
PRF Composite Materials
-
TenCate Advanced Composites
Recent Development:
-
In February 2024, Ovivo expanded its offering with the purchase of E2metrix, complementing E2metrix’s unique PFAS-destruction electro-oxidation technologies. This allows Ovivo to offer state of the art Industrial Water Treatment Solutions directly onsite even in those high-risk contaminated areas.
-
In May 2023, Lummus purchased Zimpro wet air oxidation and electro-oxidation technology, which was being made available for sale by Siemens Energy, along with the latter’s PACT systems and IP rights.
| Report Attributes | Details |
|---|---|
| Market Size in 2024 | USD 1.36 Billion |
| Market Size by 2032 | USD 2.32 Billion |
| CAGR | CAGR of 6.94% From 2025 to 2032 |
| Base Year | 2024 |
| Forecast Period | 2025-2032 |
| Historical Data | 2021-2023 |
| Report Scope & Coverage | Market Size, Segments Analysis, Competitive Landscape, Regional Analysis, DROC & SWOT Analysis, Forecast Outlook |
| Key Segments | • By Type: Direct Electro-Oxidation, Indirect Electro-Oxidation • By Electrode Material: Boron-Doped Diamond (BDD) Electrodes, Mixed Metal Oxide (MMO) Electrodes, Graphite Electrodes, Platinum Electrodes, Others (Titanium Electrodes, Stainless Steel Electrodes) • By Application: Industrial Wastewater Treatment, Municipal Wastewater Treatment, Leachate Treatment, Oil & Gas Produced Water Treatment, Food & Beverage Industry Effluents, Others (Pulp & Paper Effluents, Cosmetics Wastewater, Landfill Runoff) • By End-Use Industry: Chemical Manufacturing, Pharmaceuticals, Textile & Dye Industry, Oil & Gas, Mining, Food & Beverage, Municipal Utilities, Others (Cosmetics, Electronics Manufacturing, Pulp & Paper) |
| Regional Analysis/Coverage | North America (US, Canada), Europe (Germany, France, UK, Italy, Spain, Poland, Russsia, Rest of Europe), Asia Pacific (China, India, Japan, South Korea, Australia,ASEAN Countries, Rest of Asia Pacific), Middle East & Africa (UAE, Saudi Arabia, Qatar, Egypt, South Africa, Rest of Middle East & Africa), Latin America (Brazil, Argentina, Mexico, Colombia Rest of Latin America) |
| Company Profiles | Aqua-Aerobic Systems Inc., Veolia Water Technologies, SUEZ Water Technologies & Solutions, Electrocell Systems Inc., AdEdge Water Technologies, MIOX Corporation, De Nora Water Technologies, Aquarden Technologies, Dow Water & Process Solutions, Genesis Water Technologies, Ecolutia Services, Applied CleanTech, BioGill, Arvia Technology Ltd., Aqualia, Oxymem, Xylem Inc., EnviroChemie GmbH, Blue Eden CleanTech Solutions, Clean TeQ Water. |
Frequently Asked Questions
Ans High capital costs, electrode degradation, and energy consumption remain key challenges in large-scale electro-oxidation system implementation.
Ans: Tightening environmental regulations (e.g., for PFAS and COD/BOD limits) compel industries to adopt advanced oxidation like EO.
Ans The Electro-Oxidation Market is projected to grow at a CAGR of around 6.94 from 2025 to 2032, driven by technology adoption and sustainability goals.
North America leads due to established industrial infrastructure and strong environmental enforcement.
Ans Strict wastewater discharge norms, increasing industrial pollution, and demand for advanced oxidation processes are driving adoption.
Get in touch
