Electronic Cash Register Market Size & Growth:
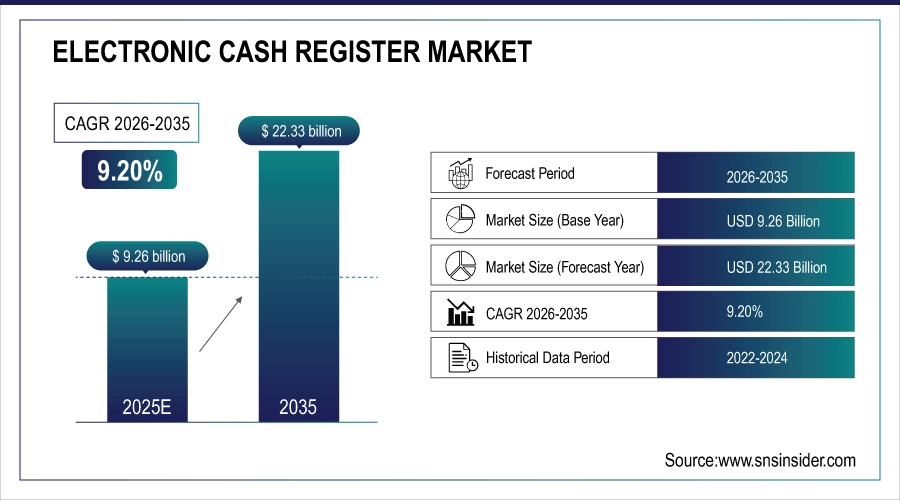
The Electronic Cash Register Market was valued at USD 9.26 billion in 2025 and is expected to reach USD 22.33 billion by 2035, growing at a CAGR of 9.20% from 2026-2035.
Electronic Cash Register Market trends are driven by cloud-based systems, touchscreen interfaces, mobile integration, and rising demand for self-checkout solutions. The Electronic Cash Register market is growing due to increasing adoption of digital payment solutions, rising demand for efficient point-of-sale systems, and rapid expansion of retail and hospitality sectors globally. Small and medium-sized businesses are embracing affordable and easy-to-use ECRs to streamline operations and enhance customer experience.
Over 5.4 million retail establishments operate in the U.S. alone as of 2024, many requiring ECRs for transaction handling.
Electronic Cash Register Market Size and Forecast
-
Market Size in 2025: USD 9.26 Billion
-
Market Size by 2035: USD 22.33 Billion
-
CAGR: 9.20% from 2026 to 2035
-
Base Year: 2025
-
Forecast Period: 2026–2035
-
Historical Data: 2022–2024
To Get more information on Electronic Cash Register Market - Request Free Sample Report
Electronic Cash Register Market Trends
-
Rising demand for automated and efficient retail checkout systems is driving the electronic cash register (ECR) market.
-
Growing adoption by small and medium-sized retailers for transaction management and inventory tracking is boosting market growth.
-
Expansion of cloud-based and integrated POS solutions is enhancing reporting, analytics, and scalability.
-
Increasing focus on improving customer experience, faster billing, and accuracy is shaping adoption trends.
-
Advancements in touchscreen interfaces, barcode scanning, and contactless payment integration are improving usability.
-
Rising retail modernization and digital transformation initiatives are fueling market adoption.
-
Collaborations between ECR manufacturers, software providers, and retail enterprises are accelerating innovation and global deployment.
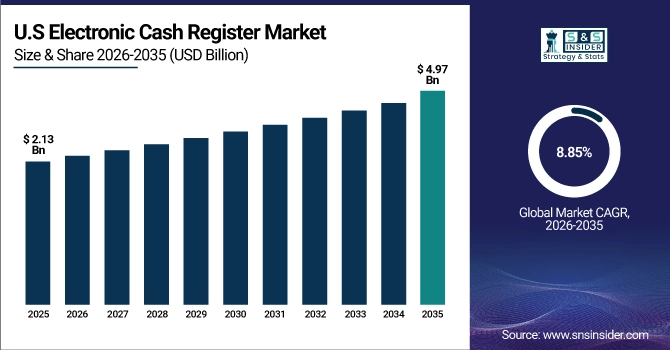
The U.S. Electronic Cash Register Market was valued at USD 2.13 billion in 2025E and is expected to reach USD 4.97 billion by 2035, growing at a CAGR of 8.85% from 2026-2035.The U.S. Electronic Cash Register market is growing due to increased adoption of digital payment systems, rising demand for self-checkout solutions, cloud-based POS integration, and retail sector modernization.
Electronic Cash Register Market Drivers:
-
Digital Payments and SME Expansion Fuel Demand for Modern Electronic Cash Register Solutions Worldwide
The global Electronic Cash Register market growth is primarily driven by the rapid shift toward digital payment solutions and the growing need for efficient and automated point-of-sale systems across retail and hospitality sectors. The expansion of small and medium-sized enterprises (SMEs), particularly in emerging economies, is increasing demand for affordable, user-friendly ECR solutions. Additionally, rising customer expectations for faster checkouts and real-time inventory management is pushing businesses to upgrade legacy systems with modern ECRs that offer touchscreen interfaces and integrated payment functionalities.
As of 2024, over 60% of SMEs globally have adopted some form of digital cash register or mobile POS system to improve efficiency.
Electronic Cash Register Market Restraints:
-
Legacy Systems and Digital Literacy Barriers Slowing Electronic Cash Register Adoption in Traditional Retail Markets
A key restraint in the global Electronic Cash Register market is the reliance on legacy infrastructure, especially among traditional retailers and businesses in rural or underdeveloped regions. Many of these establishments are hesitant to adopt new technologies due to lack of digital literacy or disruption concerns during transition. Additionally, integration complexities with existing inventory or accounting systems can hinder seamless deployment, delaying decision-making for upgrades.
Electronic Cash Register Market Opportunities:
-
Cloud Integration and Emerging Markets Driving Future Growth in Global Electronic Cash Register Adoption
Significant growth opportunities lie in the integration of cloud-based ECRs with analytics, CRM, and mobile wallets. Emerging markets in Asia-Pacific, Latin America, and Africa present untapped potential due to ongoing retail infrastructure development and favorable government initiatives promoting digital transactions.
Over 57% of global retailers implemented CRM-integrated POS or ECR systems to personalize customer engagement and improve retention in 2023.
Electronic Cash Register Market Segmentation Analysis:
By Component
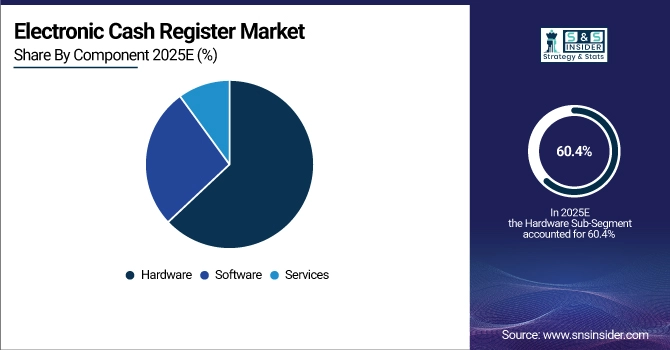
In 2025, hardware accounted for the largest share of the Electronic Cash Register market at 60.4%, driven by the essential need for physical components such as terminals, receipt printers, cash drawers, and barcode scanners. Hardware forms the core of every ECR setup, especially in traditional retail and hospitality environments where physical transactions and in-store operations remain dominant. The widespread presence of legacy systems further sustains hardware demand, particularly in developing regions.
Software is projected to experience the fastest CAGR from 2026 to 2035, fueled by growing demand for advanced functionalities such as real-time analytics, customer relationship management (CRM), and cloud-based inventory tracking. Businesses are increasingly investing in ECR software to enhance customer experience, enable seamless digital payments, and support multi-channel operations across physical and online platforms.
By Product Type
Basic Electronic Cash Registers (ECRs) dominated the market in 2025 with a 37.4% share, primarily due to their affordability, simplicity, and widespread use among small retailers and local businesses. These systems require minimal setup and technical knowledge, making them ideal for micro and small enterprises, especially in developing economies where advanced infrastructure may be lacking. Their durability and offline functionality continue to support their relevance despite the rise of digital alternatives.
Mobile/Tablet-Based ECRs are projected to witness the fastest CAGR from 2026 to 2035, driven by increasing adoption among startups, food trucks, and pop-up shops. Their portability, cloud integration, and compatibility with mobile wallets make them ideal for modern, flexible business models focused on mobility and real-time operations.
By Technology
Standalone Electronic Cash Register systems dominated the global market in 2025 with a 41.8% share, largely due to their reliability, ease of use, and offline capabilities. These systems are particularly favored by small and mid-sized retailers that operate in areas with limited internet connectivity. Their ability to perform essential transaction functions without the need for network integration makes them cost-effective and practical for basic retail environments.
Cloud-based and connected ECR systems are expected to grow at the fastest CAGR from 2026 to 2035, fueled by increasing demand for real-time data access, multi-store integration, and remote system management. Their ability to integrate with analytics, inventory management, and digital payment platforms makes them ideal for modern, scalable retail and hospitality operations.
By End-Use Industry
Retail stores dominated the Electronic Cash Register market share in 2025 with a 51.3%, owing to widespread adoption across supermarkets, convenience stores, department stores, and specialty outlets. The consistent demand for fast, reliable, and cost-effective transaction processing in high-footfall retail environments sustains hardware-based ECR deployment. Many retailers continue to rely on ECR systems for essential billing, inventory control, and receipt printing especially in emerging markets with growing retail infrastructure.
The hospitality sector is expected to witness the fastest CAGR from 2026 to 2035, driven by increased adoption of digital ordering, mobile payment integration, and cloud-based ECRs in restaurants, cafes, and fast-food chains. As customer expectations shift toward seamless, tech-enabled service experiences, businesses in hospitality are upgrading to advanced ECR systems for faster checkout, table-side ordering, and integrated kitchen workflows.
Electronic Cash Register Market Regional Outlook:
Asia Pacific Electronic Cash Register Market Insights
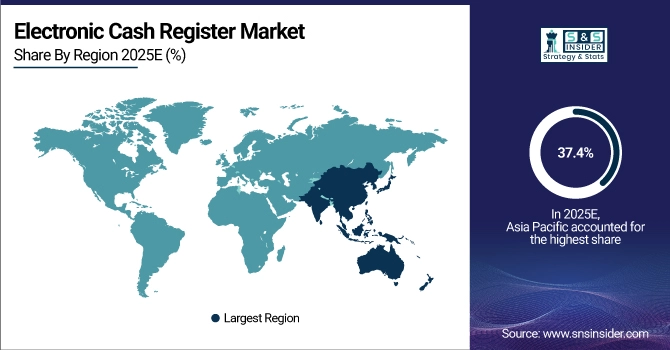
Asia Pacific dominated the global Electronic Cash Register market in 2025 with a 37.4% share and is expected to grow at the fastest CAGR from 2026 to 2035. This growth is driven by rapid urbanization, the expansion of organized retail, increasing digital payment adoption, and supportive government initiatives promoting digital transactions across emerging economies. Small and medium enterprises (SMEs) in countries like India, Indonesia, and Vietnam are accelerating ECR adoption due to affordability and ease of use. The region’s evolving retail ecosystem and rising tech integration continue to drive robust demand for both basic and cloud-based ECR systems.
Get Customized Report as per Your Business Requirement - Enquiry Now
China dominates the Asia Pacific ECR market due to its advanced retail digitization, vast merchant base, and widespread adoption of mobile and integrated POS systems.
North America Electronic Cash Register Market Insights
North America remains a mature and technologically advanced market for Electronic Cash Registers (ECR), driven by widespread adoption across retail, hospitality, and entertainment sectors. The region benefits from strong digital infrastructure, high consumer preference for contactless payments, and rapid integration of cloud-based and mobile POS systems. Businesses increasingly upgrade to feature-rich ECRs with real-time analytics, CRM, and inventory management. Regulatory compliance, data security, and demand for enhanced customer experience continue to shape innovation and sustained adoption across the U.S. and Canada.
Europe Electronic Cash Register Market Insights
Europe's Electronic Cash Register market is characterized by steady growth, driven by widespread modernization of retail infrastructure and increasing adoption of integrated, cloud-based POS systems. Countries like Germany, the U.K., and France are leading in digital payment adoption, prompting businesses to shift from traditional registers to smarter, connected solutions. Regulatory frameworks such as GDPR influence data handling features in ECR software, while demand for mobility, multi-language support, and omnichannel capabilities further drives ECR upgrades across retail and hospitality environments.
Middle East & Africa and Latin America Electronic Cash Register Market Insights
Latin America and the Middle East & Africa are emerging markets in the Electronic Cash Register landscape, experiencing growing adoption due to retail expansion and increasing digital payment penetration. In Latin America, countries like Brazil and Mexico are embracing mobile and cloud-based ECRs, driven by fintech growth and government-led digital initiatives. In the Middle East & Africa, rising urbanization, tourism, and modernization of retail and hospitality sectors are fueling demand for user-friendly, portable ECR systems with basic inventory and billing capabilities.
Electronic Cash Register Market Competitive Landscape:
SUNMI
SUNMI is a leading provider of Android-based point-of-sale (POS) terminals and commercial checkout solutions, delivering modern electronic cash register systems for retail, hospitality, and enterprise environments. Its hardware integrates advanced Android OS features, mobile connectivity, and flexible payment options, enabling streamlined transactions and operational efficiency. SUNMI’s solutions support cloud management, real-time analytics, and third-party app integrations, positioning it as a key player in the global POS market and advancing digital retail transformation.
-
2025 – Expanded Android-based POS terminals, highlighting SUNMI’s growing market presence in commercial POS systems.
Posiflex
Posiflex specializes in hardware POS terminals and electronic cash register solutions for retail, hospitality, and commercial operations worldwide. Its product portfolio includes robust Android and Windows-based terminals, touch-screen systems, and peripheral devices designed for reliability, flexibility, and seamless integration with software applications. Posiflex targets enhanced customer experiences and operational efficiency, supporting digital payment trends and smart retail workflows. The company is recognized for innovative terminals that bridge traditional cash register functions with modern, connected commerce ecosystems.
-
2025 (Feb & Apr) – Launched GT-7100 Series POS Terminal and Sunmi V3 flagship Android terminals at industry fairs, strengthening presence in electronic cash register and commercial POS markets.
Toshiba Global Commerce Solutions
Toshiba Global Commerce Solutions delivers retail technology solutions, including POS systems, electronic cash registers, and integrated commerce platforms. The company focuses on enhancing transaction efficiency, retail analytics, and multi-channel commerce management. Its ELERA commerce platform allows retailers to access partner applications, integrate payment solutions, and optimize in-store operations. Toshiba emphasizes scalable and secure POS ecosystems, supporting retailers in global markets through technology-driven operational improvements and smarter checkout experiences.
-
December 2024 – Launched Toshiba Commerce Marketplace to expand access to POS/electronic cash register solutions and partner apps within its ELERA commerce ecosystem.
Diebold Nixdorf
Diebold Nixdorf provides automated retail solutions, including POS systems, self-checkout solutions, and electronic cash registers, targeting retail, banking, and service environments. Its technology leverages AI and advanced automation to optimize checkout speed, accuracy, and customer experience. Diebold Nixdorf emphasizes modular, secure, and integrated systems that adapt to evolving retail trends, helping businesses streamline operations while supporting omnichannel commerce and intelligent payment solutions.
-
January 2024 – Deployed AI-based checkout solutions to enhance POS and self-checkout operations, improving efficiency in retail environments.
Electronic Cash Register Market Key Players:
-
Toshiba
-
NCR
-
CASIO
-
Sharp
-
Epson
-
Fujitsu
-
HP
-
Panasonic
-
SUNMI
-
Hisense
-
Bixolon
-
Star Micronics
-
Sam4s
-
Olivetti
-
CITAQ
-
Xinguodu
-
AURES Technologies
| Report Attributes | Details |
|---|---|
| Market Size in 2025 | USD 9.26 Billion |
| Market Size by 2035 | USD 22.33 Billion |
| CAGR | CAGR of 9.20% From 2026 to 2035 |
| Base Year | 2025 |
| Forecast Period | 2026-2035 |
| Historical Data | 2022-2024 |
| Report Scope & Coverage | Market Size, Segments Analysis, Competitive Landscape, Regional Analysis, DROC & SWOT Analysis, Forecast Outlook |
| Key Segments | • By Product Type (Basic ECRs, Advanced ECRs with POS Integration, Mobile/Tablet-Based ECRs, and Self-Checkout ECRs) • By Technology (Standalone Systems, Cloud-Based / Connected Systems, Touchscreen Interface Systems, and Barcode & RFID Integrated Systems) • By Component (Online (Hardware, Software, and Services) • By End-Use Industry (Retail Stores, Hospitality, Entertainment, Healthcare, and Transportation & Logistics) |
| Regional Analysis/Coverage | North America (US, Canada, Mexico), Europe (Germany, France, UK, Italy, Spain, Poland, Turkey, Rest of Europe), Asia Pacific (China, India, Japan, South Korea, Singapore, Australia, Taiwan, Rest of Asia Pacific), Middle East & Africa (UAE, Saudi Arabia, Qatar, South Africa, Rest of Middle East & Africa), Latin America (Brazil, Argentina, Rest of Latin America) |
| Company Profiles | Toshiba, NCR, Diebold Nixdorf, CASIO, Sharp, Epson, Posiflex, Fujitsu, HP, Panasonic, SUNMI, Hisense, Bixolon, Star Micronics, Sam4s, Olivetti, CITAQ, Xinguodu, and AURES Technologies. |
Frequently Asked Questions
Asia Pacific dominated the Electronic Cash Register Market in 2025.
Standalone Systems segment dominated the Electronic Cash Register Market.
The major growth factor driving the Electronic Cash Register market is the rising demand for digital payment and point-of-sale automation in retail and hospitality sectors.
The Electronic Cash Register Market was valued at USD 9.26 billion in 2025 and is expected to reach USD 22.33 billion by 2035.
The Electronic Cash Register Market is expected to grow at a CAGR of 9.20% from 2026-2035.
Get in Touch
