Engineered fluids (Fluorinated fluids) Market Report Scope & Overview:
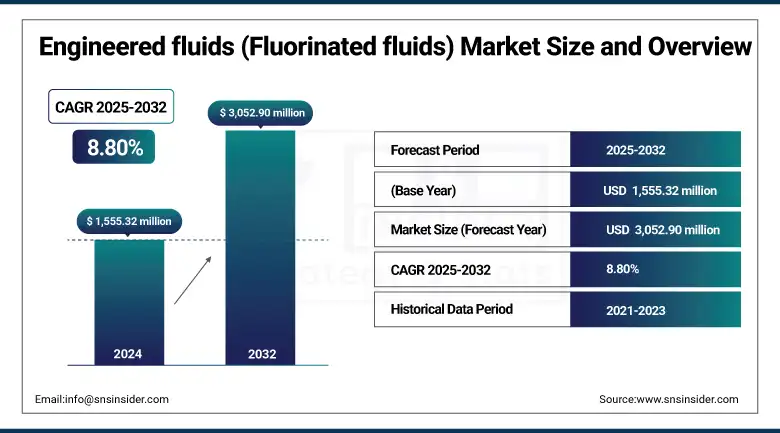
The Engineered Fluids (Fluorinated fluids) Market size was valued at USD 1,555.32 million in 2024 and is expected to reach USD 3,052.90 million by 2032, growing at a CAGR of 8.80% over the forecast period of 2025-2032.
The growth of the engineered fluids (fluorinated fluids) market is fueled by high demand for PFPE and HFE fluids in electronics and electric vehicle (EV) battery cooling and in aerospace systems. Increasing attention towards sustainability, low-GWP alternatives, and excellent thermal stability are some of the key factors driving the growth of the engineered fluids (fluorinated fluids) market. Leading manufacturers of key engineered fluids (fluorinated fluids) are using virtual twins and blending on-the-fly for added, tailor-made performance. Key market trends engineered fluids (fluorinated fluids) include increasing in semiconductor fabs and data centers.
To Get more information On Engineered fluids (Fluorinated fluids) Market - Request Free Sample Report
-
Under the U.S. AIM Act, HFCs must be reduced to 15% of baseline by 2036 driving the use of engineered fluorinated fluids.
-
The Chemours Company introduced a PFAS stewardship program that will affect PFPE manufacture by 2025.
-
Honeywell said in its 2024 annual report it would spin off its Solstice HFO division.
Engineered fluids (fluorinated fluids) industry analysis is based on product application of fluorinated lubricants and heat transfer fluids which enhances engineered fluids (fluorinated fluids) market's growing demand.
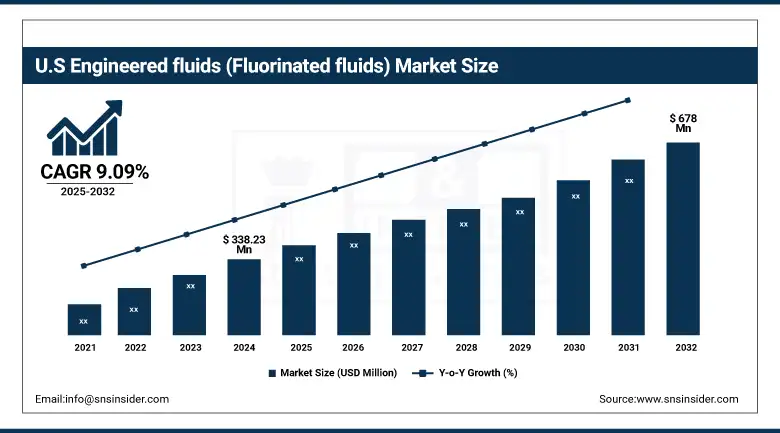
The U.S. leads North America’s engineered fluids market with a market size of USD 338.23 million in 2024 and is projected to reach USD 678 million in 2032 with a CAGR of 9.09% during the forecast period of 2025 – 2032. In the U.S., where the market is dominated by a thriving aerospace and electronics manufacturing base. The market for application solutions for thermal management with fluorinated fluids will grow as projects are supported by funding from the U.S. Department of Energy’s Office of Energy Efficiency and Renewable Energy. Chemours' news release notes expanded production capacity for its Krytox PFPE lubricants, emphasizing the American emphasis on sustainable high-performance fluids. The U.S. Environmental Protection Agency’s (EPA) regulations on the emission of greenhouse gases are also driving companies to choose environmentally sustainable fluorinated heat transfer fluids.
Engineered fluids Market Drivers:
-
Surging data center deployment elevates demand for advanced PFPE and HFE thermal management fluids
Further expansion of hyperscale data centers is contributing to the growth of engineered fluids (fluorinated fluids), as PFPE and HFE provide superior thermal transfer and electrical isolation. According to the U.S. Department of Energy, electricity use in data centers crossed 205 billion kWh in 2022, growing at almost 8% per year. This trend acceleration supports the growth of the engineered fluorinated fluids market and correlates with the engineered fluids (fluorinated fluids) market trend towards high performance cooling. Key engineered fluids (fluorinated fluids) players including 3M Company and The Chemours Company are expanding fluorinated lubricants and heat transfer fluids manufacturing capacities in a bid to grab higher share of the engineered fluids (fluorinated fluids) market.
-
Industry 4.0 automation boosts engineered fluids (fluorinated fluids) market growth across manufacturing sectors
The uptake of Industry 4.0 tools such as robotics, additive manufacturing, predictive maintenance is also fuelling the need for chemically inert PFPE and HFE fluids in precision machining and sensor cooling applications. 22% expansion of smart factory installations between 21-23 announce the strong growth in the Engineered Fluids Market (Fluorinated fluids) by the National Institute of Standards and Technology. This alteration in engineered fluorinated fluids market trends is encouraging the adoption of digital twins for the live monitoring of fluid performance to create customized products and increasing the size of the overall engineered fluids (fluorinated fluids) market.
Engineered fluids Market Restraints:
-
Growing scrutiny over PFAS compounds raises compliance costs and restricts PFPE fluid formulations
Increased regulatory scrutiny on per- and polyfluoroalkyl substances (PFAS) is increasing compliance pressures for engineered fluids (fluorinated fluids) firms due to PFPE-based fluids, which are subject to additional reporting and phase-out considerations. The U.S. Environmental Protection Agency’s PFAS National Leadership Summit in 2023 set the stage for the proposed restrictions, which could raise testing and certification costs by as much as 25 percent. Such examination is a physical limitation for engineered fluorinated fluids, which reduces available formulations for PFPE and HFE fluids, delays introduction of new products and reduces engineered fluids (fluorinated fluids) market penetration into applications subject to tougher environmental limitations.
Engineered fluids Market Segmentation Analysis:
By Type
Lubricants dominated the engineered fluids (fluorinated fluids) market in 2024, fueled by their dominance with 47.60% market share. This leadership can be largely attributed to the wide use of PFPE lubricants in aerospace control systems and high speed bearings. The Chemours Company has increased its global capacity in PFPE and Daikin Industries continues to make tailored fluorinated products for automotive EV platforms available. These lubricants exhibit superior thermal stability and dielectric properties that are required in demanding, high performance applications.
Heat transfer fluids emerged as the fastest-growing segment in 2024, registering a strong CAGR of 9.17%. This expansion is driven by a growing penetration of HFE-based coolants in data centers and semiconductor tools. Energy use in the data centers nearly tripled over the last decade, according to the U.S. Department of Energy. 3M and Honeywell are working based on the low toxic, high thermal transfer performance of HFE to support increasing environmental regulatory and thermal management requirement trends in electronics and cleanroom cooling.
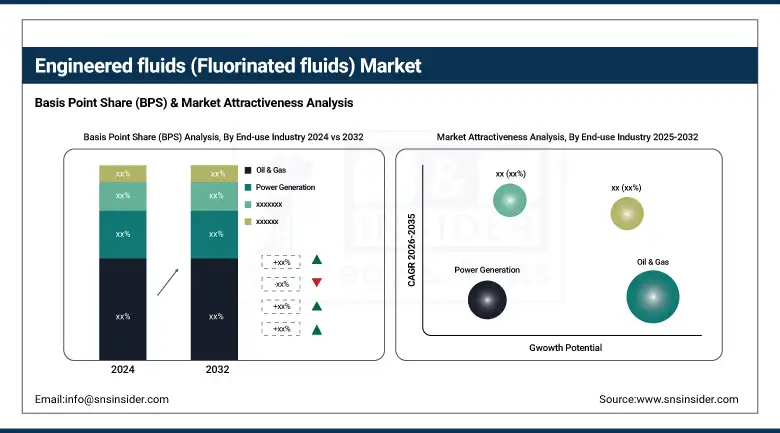
By End-use Industry
The oil & gas industry dominated and held the largest market share of 25.2% in the engineered fluids (fluorinated fluids) market in 2024. PFPE lubricants are widely used in downhole tools and drilling operations due to their chemical inertness and performance under extreme pressure. The U.S. Energy Information Administration reported a record output of 13.2 million barrels per day in 2024, driving demand for robust lubricants. These fluids reduce maintenance frequency and prevent thermal breakdown in highly volatile upstream and midstream applications.
Electronics & semiconductor applications registered the fastest CAGR of 9.55% in 2024, due to the fast-paced use of the fluorinated fluids in chip cooling and precise cleaning. According to the National Institute of Standards and Technology, HFE fluids are better at dielectric strength and outgassing than DME for producing microprocessors. Manufacturers namely, AGC Chemicals and Solvay S.A. have increased the production of HFE, that will be predominantly used in immersion cooling systems, in particular in AI server farms and 5G base stations, as uniformity of temperature is crucial.
Engineered fluids Market Regional Analysis:
North America holds the second-largest share and is the fastest-growing region with the highest CAGR of 9.13% in the engineered fluids (fluorinated fluids) market, driven by the fast growing fleet in the burgeoning aerospace, automotive and semiconductor industries. The need to achieve government-mandated efficiency standards is driving demand for PFPE and HFE fluids. The Department of Energy is advancing cooling technologies with a beneficial effect on fluorinated lubricants and heat transfer fluids. Market Competition Key players such as 3M and Chemours concentrate on research and development to comply with strict environmental regulations, thereby contributing to innovation and uptake in the region’s engineered fluids market.
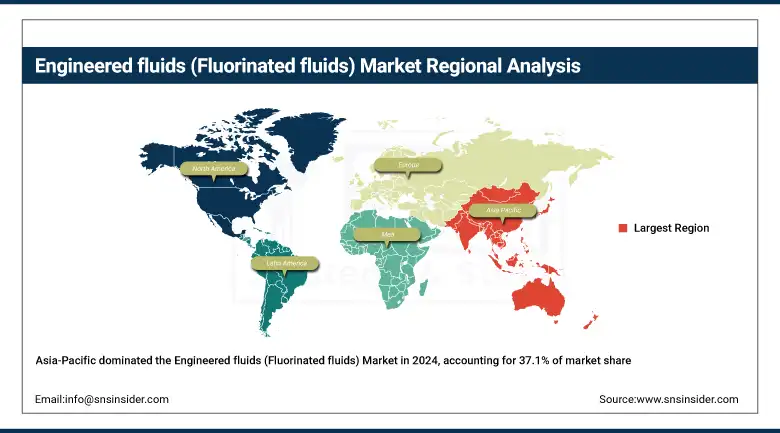
Asia Pacific leads the engineered fluids (fluorinated fluids) market with a commanding 37.1% market share in 2024, driven by accelerated industrialization and the growth of electronics and automobile production. In China, there are government subsidies for semiconductor and green energy projects that generate demand for fluorinated lubricants and heat transfer fluids. Local players such as Daikin, expand PFPE and HFE fluids production to cater to growing demand. Migration of clean technologies in the Asia Pacific region continues to drive market growth across multiple challenging industrial verticals.
Get Customized Report as per Your Business Requirement - Enquiry Now
The market of engineered fluids in China is dominated by strong government-backed investments in semiconductor fabs and clean energy infrastructure. The Ministry of Industry and Information Technology (MIIT) promotes vigorously the upgrading of high-tech equipment manufacturing, thus driving more demand for high-end fluorinated fluids. Daikin Chemical is responding to this boom with their plant expansion in China in 2023, designed to increase the supply of PFPE and HFE fluids. Such endeavours are also undergirded by the policy decisions of the National Energy Administration in China which promotes efficient thermoelectric solutions to lower industrial emissions.
Engineered fluids Market Companies are:
The major engineered fluids (fluorinated fluids) market competitors include 3M Company, Daikin Industries Ltd., The Chemours Company, Solvay SA, AGC Chemicals (Asahi Glass Company), Honeywell International Inc., Halocarbon Products Corporation, Halopolymer Kirovo-Chepetsk, F2 Chemicals Ltd., and Nye Lubricants, Inc.
Recent Developments:
-
In May 2025, Engineered Fluids collaborated with Iceotope and Juniper to deploy fluorinated immersion cooling fluids in data centers, enhancing energy efficiency and thermal management in high-performance computing systems.
-
In February 2025, MicroCare launched sustainable engineered fluorinated fluids as eco-friendly replacements for traditional cleaning solvents, targeting electronics and precision cleaning industries with improved performance and regulatory compliance.
| Report Attributes | Details |
|---|---|
| Market Size in 2024 | USD 1,555.32 million |
| Market Size by 2032 | USD 3,052.90 million |
| CAGR | CAGR of 8.80% From 2025 to 2032 |
| Base Year | 2024 |
| Forecast Period | 2025-2032 |
| Historical Data | 2021-2023 |
| Report Scope & Coverage | Market Size, Segments Analysis, Competitive Landscape, Regional Analysis, DROC & SWOT Analysis, Forecast Outlook |
| Key Segments | •By Type (Lubricants, Solvents, Heat Transfer Fluids) •By End-use Industry (Aerospace, Automotive, Electronics & Semiconductor, Oil & Gas, Power Generation, Chemical Processing, Others) |
| Regional Analysis/Coverage | North America (US, Canada, Mexico), Europe (Germany, France, UK, Italy, Spain, Poland, Turkey, Rest of Europe), Asia Pacific (China, India, Japan, South Korea, Singapore, Australia, Rest of Asia Pacific), Middle East & Africa (UAE, Saudi Arabia, Qatar, South Africa, Rest of Middle East & Africa), Latin America (Brazil, Argentina, Rest of Latin America) |
| Company Profiles | 3M Company, Daikin Industries Ltd., The Chemours Company, Solvay SA, AGC Chemicals (Asahi Glass Company), Honeywell International Inc., Halocarbon Products Corporation, Halopolymer Kirovo-Chepetsk, F2 Chemicals Ltd., and Nye Lubricants, Inc. |
Frequently Asked Questions
Rising demand for PFPE and HFE fluids in electronics, EV battery cooling, aerospace, and focus on sustainability are key growth drivers.
Lubricants led with a 47.6% market share due to their use in aerospace and EV applications requiring high thermal stability.
North America is the second-largest and fastest-growing region due to aerospace, automotive sectors, and government incentives promoting advanced cooling.
Asia Pacific holds 37.1% share, fueled by industrialization, government subsidies in China, and growing electronics and automotive manufacturing.
Major competitors include 3M, Daikin, Chemours, Solvay, AGC Chemicals, Honeywell, Halocarbon, F2 Chemicals, and Nye Lubricants.
Get in Touch
