Nonylphenol Ethoxylates Market Analysis & Overview
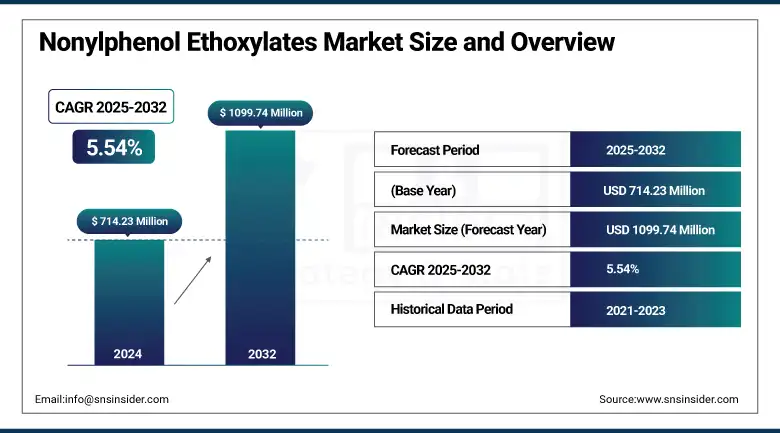
The Nonylphenol Ethoxylates Market size was valued at USD 714.23 Million in 2024 and is expected to reach USD 1099.74 Million by 2032, growing at a CAGR of 5.54% over the forecast period of 2025-2032.
Nonylphenol Ethoxylates Market Analysis indicates that growing attention toward cleanliness, hygiene, and routine industrial maintenance is strongly impacting market growth. With growing industries in manufacturing, oil & gas, and automobiles, the demand for efficient cleaning agents that can perform heavy-duty degreasing, surface cleaning, and equipment maintenance also grows. Nonylphenol ethoxylates (NPEs), having superior emulsifying and wetting properties, have extensive applications in industrial and institutional (I&I) cleaning products. As stricter hygiene practices and maintenance requirements are being followed globally, particularly post-pandemic, the demand for effective surfactants, such as NPEs has become even more critical. This increased demand for high-performance cleaning agents will help drive the future growth of the NPE market as well.
To Get more information On Nonylphenol Ethoxylates Market - Request Free Sample Report
The U.S. Environmental Protection Agency estimates that all U.S. industries used more than 910,000 metric tons of VOC solvents annually in industrial cleaning. Nonylphenol ethoxylates are widely used as surfactants and are key in many VOC-based cleaning products.
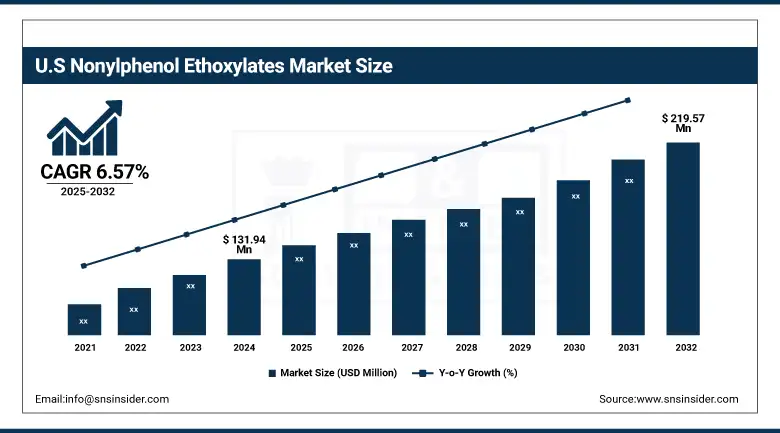
The U.S Nonylphenol Ethoxylates market size was USD 131.94 million in 2024 and is expected to reach USD 219.57 million by 2032 and grow at a CAGR of 6.57% over the forecast period of 2025-2032.
Nonylphenol Ethoxylates Market Drivers:
-
Growth in Paints and Coatings Industry Drive the Market Growth
The expansion in the paint and coating industry is a major growth driver for the Nonylphenol Ethoxylates Market since the chemicals are extensively employed as efficient surfactants and emulsifiers in paints. Owing to the global boom in construction activities, urbanization, and refurbishment programs, demand for high-quality paint that provides durability, weatherability, and easy application is continually on the rise. Nonylphenol ethoxylates (NPEs) are crucial to enhancing pigment dispersion and the stability of paints and coatings. Further, in industrial and automotive coatings, NPEs lower surface tension and wetting properties, leading to improved adhesion and finish. With infrastructure growth speeding up, especially in developing economies, applications of NPEs in this industry are anticipated to increase, further validating their significance and contributing to overall market growth.
Nonylphenol Ethoxylates Market Restraints:
-
Limited Use in Food and Pharmaceutical Sectors May Hamper the Market Growth.
The restricted usage of Nonylphenol Ethoxylates (NPEs) in the food industry and pharmaceutical market is a significant market restraint. On the basis of their toxicological characterization, especially their status as possible endocrine disruptors and environmental persistence, NPEs are not deemed safe for uses with human ingestion or medical application. Regulatory agencies operating in markets, such as North America and Europe have placed stringent limits on their application in processes that may lead to food product or pharmaceutical contamination. Therefore, the manufacturers in these industries are obliged to adopt alternative, non-toxic, biodegradable surfactants with strict health and safety requirements. This restriction constricts the area of application of NPEs, thus restraining their overall market growth opportunity.
Nonylphenol Ethoxylates Market Opportunities:
-
Innovation in Agrochemical Formulations Creates Opportunities in the Market.
Agrochemical formulation innovation is a promising direction for the Nonylphenol Ethoxylates Market growth. As the global population keeps growing, the need for greater agricultural output keeps rising, leading to more effective and targeted crop protection. Nonylphenol ethoxylates are widely applied as wetting agents and emulsifiers of pesticide and herbicide mixtures, enabling better distribution and absorption of active ingredients onto plant surfaces. New agrochemical innovations, including controlled-release products and nano-based delivery formats, depend on high-performance surfactants, such as NPEs to improve effectiveness. Increased access to modern agricultural practices in developing countries is further enhancing the demand for similar advanced agrochemical products, thus opening new growth opportunities for NPE producers even amid environmental concerns which drive the nonylphenol ethoxylates market trends.
In 2024, Clariant launched its Sapogenat T line of low-foaming, biodegradable adjuvants at the CAC 2024 exhibition as direct NPE replacements for spraying agrochemicals. These surfactants improve pesticide emulsification and foliar uptake to enhance crop protection efficacy.
Nonylphenol Ethoxylates Market Segmentation Analysis:
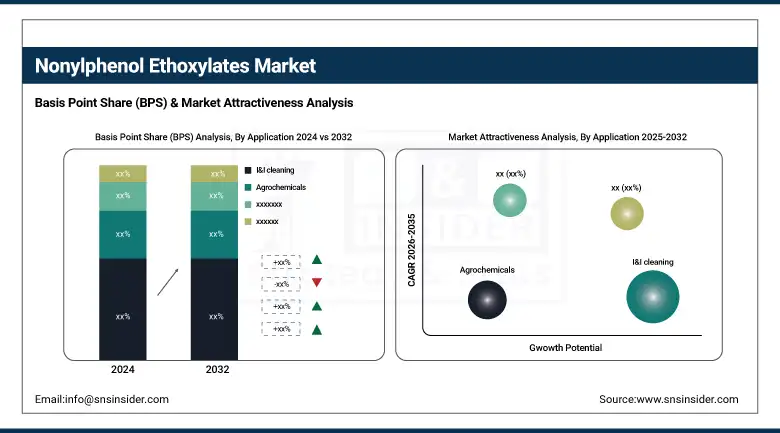
By Application
I&I cleaning held the largest Nonylphenol Ethoxylates market share, around 42%, in 2024 due to its widespread application in commercial and industrial sanitation processes. These ethoxylates are highly effective non-ionic surfactants known for their powerful emulsifying, dispersing, and wetting properties, making them ideal for use in cleaning formulations for hospitals, schools, restaurants, factories, and other public facilities. Their ability to break down tough greases and oils on various surfaces ensures efficient cleaning performance, which is critical for maintaining hygiene and regulatory compliance across industries.
Paints held a significant Nonylphenol Ethoxylates market share owing to their critical role as effective surfactants and emulsifying agents in paint formulations. NPEs help stabilize pigment dispersion, improve wetting properties, and enhance the uniformity of coatings, which are essential in achieving high-performance paint products. They also contribute to reducing surface tension, allowing better spread ability and adhesion on various substrates. The growth of the construction and automotive industries, particularly in emerging economies, has fueled demand for decorative and protective coatings, thereby increasing the consumption of NPEs in the paints sector.
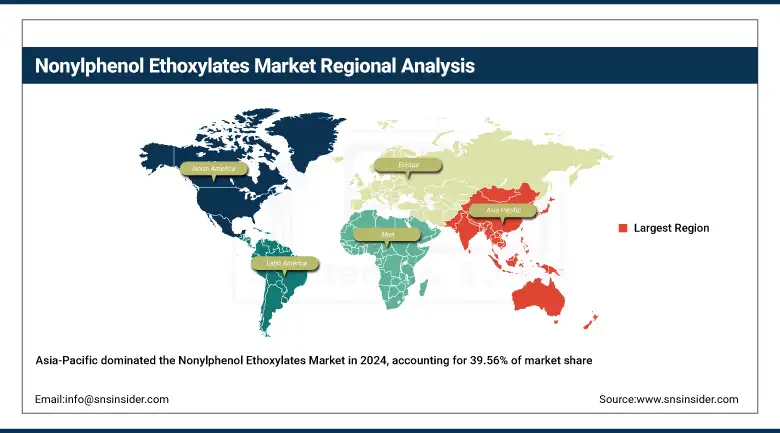
Nonylphenol Ethoxylates Market Regional Outlook:
Asia-Pacific held the largest market share, around 39.56%, in 2024 due to its leadership in manufacturing, agriculture, and industrial businesses that make extensive use of surfactants. China, India, and South Korea are leading textile production centers, agrochemical application areas, and paints & coatings production, all of which are important application fields for NPEs. Asia Pacific is favored by inexpensive labor, rich raw materials, and accommodating government regulations that favor industrial growth. Moreover, high urbanization and infrastructure growth have stimulated demand for cleaning products, paint, and industrial lubricants, further propelling NPE usage.
Get Customized Report as per Your Business Requirement - Enquiry Now
In October 2024, for example, industry associations launched pilot plants for manufacturing plant-based nonylphenol ethoxylates with the goal of decreasing the environmental persistence and toxicity that comes with conventional NPEs.
North America Nonylphenol Ethoxylates market held a significant market share and is the fastest-growing segment in the forecast period. It is a robust industrial base of the region and high demand in major end-use markets including industrial cleaning, paints & coatings, textiles, and oilfield chemicals. The U.S. specifically has a robust chemical manufacturing hub with widespread application of NPEs in institutional cleaning agents, lubricants, and emulsifiers. In addition, the area's focus on sanitation and hygiene in healthcare and commercial environments continues to justify consistent demand for NPEs in cleaning products.
The U.S. has a strong industrial base and massive consumption in a multitude of uses, such as industrial cleaning, paints & coatings, textile, and oilfield chemicals. The nation's firm demand for institutional and commercial cleaning chemicals, particularly in healthcare, hospitality, and government buildings, mandates repeated usage of NPEs due to their high-quality surfactant and emulsifying capabilities. The U.S. also contains a number of the world's greatest chemical producers and research facilities, ensuring innovations and high-volume manufacturing of NPE surfactants. Even with expanding environmental laws targeting phasing out some nonylphenol-based materials, NPEs are still heavily utilized in a multitude of approved industries.
Europe held a significant market share in the forecast period. It is because of its well-established industrial base and strong presence in industries such as textiles, paints & coatings, and agrochemicals. The European nations, and especially Germany, France, and the U.K., have a long-standing chemicals and manufacturing base in which NPEs have been used traditionally as good surfactants and emulsifiers. Although the European Union has ensured stringent regulations curtailing the use of nonylphenol ethoxylates due to environmental issues more so under REACH various industries continue to depend on NPEs for certain applications in which alternatives are not yet completely practical.
Nonylphenol Ethoxylates Market Companies are:
The major Nonylphenol Ethoxylates companies are Akzo Nobel N.V., BASF SE, Clariant AG, Dow, Huntsman Corporation, India Glycols Limited, PCC Exol SA, Sabic, Solvay S.A., and Stepan Company.
Recent Developments:
-
In 2023, BASF SE rolled out a new eco-friendly NPE variant specifically designed for cleaning and textile applications. This initiative aims to cut down on environmental impact while still delivering top-notch surfactant performance.
-
In 2023, Dow Inc. has ramped up its production capacity for NPEs to keep pace with the growing demand in the agricultural sector, showcasing its commitment to investing in essential industries, such as agrochemicals.
| Report Attributes | Details |
|---|---|
| Market Size in 2024 | USD 714.23 Million |
| Market Size by 2032 | USD 1099.74 Million |
| CAGR | CAGR of 5.54% From 2025 to 2032 |
| Base Year | 2024 |
| Forecast Period | 2025-2032 |
| Historical Data | 2021-2023 |
| Report Scope & Coverage | Market Size, Segments Analysis, Competitive Landscape, Regional Analysis, DROC & SWOT Analysis, Forecast Outlook |
| Key Segments | •By Application (I&I Cleaning, Paints, Agrochemicals, Leather, Textile, Oilfield Chemicals, Others) |
| Regional Analysis/Coverage | North America (US, Canada, Mexico), Europe (Germany, France, UK, Italy, Spain, Poland, Turkey, Rest of Europe), Asia Pacific (China, India, Japan, South Korea, Singapore, Australia, Rest of Asia Pacific), Middle East & Africa (UAE, Saudi Arabia, Qatar, South Africa, Rest of Middle East & Africa), Latin America (Brazil, Argentina, Rest of Latin America) |
| Company Profiles | DuPont, 3M, Honeywell International Akzo Nobel N.V., BASF SE, Clariant AG, Dow, Huntsman Corporation, India Glycols Limited, PCC Exol SA, Sabic, Solvay S.A., Stepan Company. |
Frequently Asked Questions
Asia Pacific led the Nonylphenol Ethoxylates Market in the region with the highest revenue share in 2024.
Growth in the paints and coatings industry drives the market growth.
I&I cleaning will grow rapidly in the Nonylphenol Ethoxylates Market from 2025 to 2032.
The expected CAGR of the global Nonylphenol Ethoxylates Market during the forecast period is 5.54%
The Nonylphenol Ethoxylates Market was valued at USD 714.23 million in 2024.
Get in Touch
