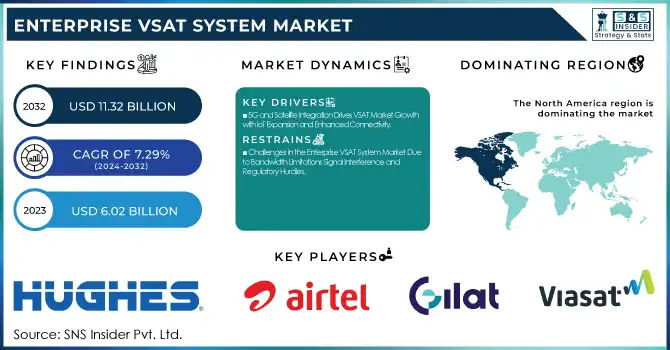
The Enterprise VSAT System Market was valued at USD 6.02 billion in 2023 and is expected to reach USD 11.32 billion by 2032, growing at a CAGR of 7.29% over the forecast period 2024-2032.
Get more information on Enterprise VSAT System Market - Request Sample Report
The increase in demand for reliable satellite communication solutions in remote and underserved regions primarily drives the growth of the Enterprise VSAT System Market. Agricultural, healthcare, mining, and other industries with operations worldwide have struggled to access traditional broadband infrastructure due to the time, cost, and complexity of installation, making VSAT systems a viable alternative. They provide DSL and secure communication networks even in the roughest terrains, essential for those industries that need 24/7 connectivity such as transportation, oil and gas, and defense. Additionally, the increasing trend of digital transformation and growing demand for cloud services and IoT solutions is driving more need for VSAT systems, particularly in developing countries with limited terrestrial infrastructure. 75% of maritime vessels were communicating via VSAT (up from 67% in 2022) and 100,000 VSAT terminals were delivered for governmental and military use around the world. The secure VSAT-enabled financial transactions registered 20% growth in rural Latin America, and in India, the government-connected more than 15,000 schools via VSAT supporting digital education. In 2023, high-throughput satellites reached bandwidth capacities above 1 Tbps with a latency of less than 600 ms, both vital to real-time use cases. VSAT healthcare facilities increased by 18% in Sub-Saharan Africa, aiding in telemedicine and data transfer.
The growing use of managed services is also driving the growth of the market. With enterprises looking for end-to-end communication solutions in VSATs which would entail installation, maintenance, and managing the network, VSAT service providers are gradually developing a portfolio of integrated services. This along with the continuous evolution of technology to optimize the performance and reduce the cost of VSAT systems, has resulted in more and more widespread acceptance of technology. Moreover, these next-generation VSAT system capabilities and cost structure can only be enhanced by the continued maturation and expansion of satellite constellations and the emergence of LEO satellite systems which should expect to see in the market over the next ten years. Demand for managed VSAT services surged 25% year over year through 2023 as more than 40% of SMEs outsourced their VSAT installation and maintenance. Speed of 50–100 Mbps was achieved in rural areas with the help of LEO satellites, while latency was cut down to less than 20 milliseconds. We also saw cloud-based deployments represent 35% of total installations along with rural connectivity expansions that brought connectivity to more than 5,000 underserved communities across Africa and Latin America.
KEY DRIVERS:
5G and Satellite Integration Drives VSAT Market Growth with IoT Expansion and Enhanced Connectivity
One of the most significant market growth factors for VSAT technology is the availability of new satellite communication opportunities with the introduction of 5G technology. Though utilizes high-speed, low-latency services, 5G-based networks address issues of terrestrial infrastructure resulting in under-served remote areas nowadays. Hence, enterprise VSAT systems are becoming complementary to 5G, serving to cover gaps where 5G isn´t available such as rural, mountainous, or offshore locations. While the traditional industry driver of satellite connectivity has been for pressure points across business landscapes that showcase increasing demand for more constant and dependable communication at various locales, remote workspaces, maritime, and healthcare centers mainly in rural areas, even the adoption of machine-to-machine (M2M) communications are driving demand for satellite connectivity, particularly in areas like transportation and energy to smart vehicles, smart homes, and smart cities (to name a few) that are greatly reliant on reliable connectivity.
5G connections worldwide reached 1.6 billion active connections in 2023 and are projected to grow to 2.4 billion by 2024, with 35% of the global population covered globally. Enterprise IoT connections fared even better at 10.7 billion and M2M devices using VSAT systems were estimated to be more than 25 million.
Meanwhile, over 1,500 LEO satellites were launched by providers such as SpaceX and OneWeb, allowing VSAT systems to reach latencies below 25 ms. Also, 5 million acres of farmland were tracked by satellite-enabled sensors, which contributed to a 15% growth in agriculture IoT deployments.
Rising Demand for Disaster Recovery Boosts VSAT System Adoption Amid Cyber Threats and Network Outages
The other key growth factor is the increasing demand for disaster recovery. As cyber threats escalate in sophistication, organizations just need very secure and reliable communication links to maintain continuity and protect sensitive data. That is why VSAT systems which are not just highly encrypted systems with anti-hacking defenses but also cyber-punk-blocking radio waves against sneaky shadowy characters are widely popular in risk-prone industries like finance and health care and your local defense contractors as the last stand against invasion. Besides, in the case of disasters communication via satellite is a role player in maintaining business continuity, i.e. when terrestrial networks are destroyed. The need for secure and disaster-resilient systems is driving this demand, as businesses increasingly depend on satellite-based systems to protect their operations and data. Average losses of USD 20,000 per day make every hour of downtime costly for businesses, and even higher over USD 100,000 reported for extended outages across industries in 2023-2024.
Statistics show that three out of four businesses without a disaster recovery plan shut down within three years after a cyberattack, and 50% of enterprises are not confident that data can be restored in full, as per the SLAs. The need for Disaster recovery is even more important it is found that 50% + of network outages are caused by either natural calamities or cyber-attacks. Moreover, businesses with a strong recovery strategy survive 96% of the time from ransomware attacks.
RESTRAIN:
Challenges in the Enterprise VSAT System Market Due to Bandwidth Limitations Signal Interference and Regulatory Hurdles
The high availability of frequency bandwidth and signal interference is one of the major restraints in the Enterprise VSAT System Market. Despite these advancements, satellite communication still inherently suffers from disadvantages like being affected by weather conditions, such as heavy rain or snow, which cause an attenuation in signals. VSAT has also limited bandwidth availability especially related to shared bandwidth, where users share the same frequency. It can cause slower speeds and less reliability, especially in high-demand areas, such as business centers or during busy times of the day. Even the satellite operators have to face their own set of challenges such as dealing with regulatory and licensing issues. Each of them has rules (such as frequency allocation and licensing) governing satellite communications. This introduces a compliance nightmare for many global enterprises that need consistency of connectivity in several of these regions. In other cases, the imposition of strict regulatory controls can result in delays in deploying technology, hampered network expansion, and an additional layer of operational challenge for service providers.
BY COMPONENT
The hardware segment dominated the enterprise VSAT system market with 66.7% market share in terms of revenue in 2023. This dominance can be explained in terms of the hardware of satellites, such as VSAT terminals (both outdoor and indoor units) are critical for satellite communication. There is a big need for reliable connectivity in places where traditional landline connections will not work, such as for businesses that depend on a robust hardware stack, spanning sectors like energy, healthcare, defense, and others. The hardware segment has a significant market share due to capital capital-intensive nature of it & the infrastructure required to develop that can be initiated only with the help of VSAT systems.
The services segment will register the fastest CAGR between 2024 & 2032. The driving force for growth behind this is the intricate nature of satellite communication systems and the demand for end-to-end solution bundles with installation, system integration, and long-term technical support. Because companies are becoming increasingly reliant on satellite communication solutions to support important operations, this will drive the demand for managed services, network optimization, and continuous system maintenance, propelling the growth of the market. At the same time, these evolving technology trends and the emergence of trends such as cloud-based solutions, IoT applications, and edge computing are driving demand for higher-level, more service-oriented VSAT systems.
BY ORGANIZATION SIZE
In 2023, the Enterprise VSAT System Market was primarily led by small and medium enterprises (SMEs) with a market share of 58%, and it is also expected to grow at the fastest CAGR in the forecast period of 2024 to 2032. The growth is supported by the growing dependence of SMEs on cost-effective, scalable, and reliable communication solutions, particularly in rural areas where they may not have access to traditional broadband solutions. Digital transformation of rural and underserved sectors, such as agriculture, retail, and logistics will increase demand for affordable VSAT systems. Moreover, VSAT can deliver uninterrupted connectivity that is critical for business continuity in remote places which is another incentive for SMEs. Additionally, the growing number of SMEs in the VSAT market is caused due to the increase in cloud computing and IoT applications. As these establishments transition to digital channels, the demand for robust satellite-level connectivity to transport data, oversee networks and empower remote activities naturally grows. No longer is it just large corporations that will be using VSAT; the low cost of shared bandwidth VSAT services along with growing internet penetration into the most remote corners of the globe will see SMEs as the primary drivers of much of this growth.
BY END USE
In 2023, Banking, Financial Services, and Insurance (BFSI) held the largest market share for the Enterprise VSAT System Market at 31%. The dominance is due to the world of secure, reliable, and continuous connectivity has created a critical need within the BFSI sector. Data transmissions are a vital part of financial transactions, real-time stock trading, and regulatory compliance, which is where VSAT systems can step in for financial institutions in need of remote data transmissions. In addition, the escalating use of digital banking services, mobile-based transactions, and cloud-based platforms by the BFSI sector has further driven the adoption of satellite communication to ensure operational continuity across dispersed regions.
IT & Telecom is likely to emerge as the fastest-growing end-use industry with a CAGR during the forecast period from 2024 to 2032. This is propelled by the increasingly widespread 5G infrastructure, IoT applications, and the cloud ecosystem that demands seamless, high-speed connectivity. With growing consumer demand for fast and reliable internet services – particularly in rural and underserved areas IT & Telecom companies are integrating more VSAT systems into their offerings for enhanced coverage options. With its capacity to provide fast and low-latency connection in w.r.t to high-speed satellite internet in locations where no terrestrial infrastructure exists, VSAT can be an attractive solution for extending internet coverage, especially in rural and offshore areas. Moreover, an increase in the adoption of edge computing along with smart devices is expected to open the new demand for satellite communication in IT & Telecom networks.
BY TYPE
In the year 2023, the Enterprise VSAT System Market was dominated by Shared Bandwidth VSAT Systems, accounting for a 61% share of the market. Cost-effectiveness and scalability have been significant factors in the dominance of this segment, which has benefited small and medium-sized enterprises (SMEs) and remote-area businesses with limited budgetary resources. By enabling several users to use a single frequency, shared bandwidth solutions reduce capital expenditures significantly, making it affordable for sectors such as agriculture, retail, and education. They are especially sought in rural or remote regions of the terrestrial internet infrastructure, where the ground internet infrastructure is lacking, providing a more cost-effective option for business users who must have reliable commercial-grade connectivity capabilities without the cost of private systems.
Dedicated Bandwidth VSAT Systems is expected to grow fastest during the forecast period of 2024 to 2032. The growth can be attributed to the burgeoning demand for high-throughput with assured connectivity in sectors such as defense, aerospace, and large corporations. Dedicated systems provide an isolated and resilient link which is critical for businesses that rely on constant, high-quality communication, for example in real-time data transfers, high-frequency trading, or emergency services. As organizations are facing increasing pressure over data security and network reliability, particularly within industries that handle sensitive information, we are finding more and more enterprises are investing in dedicated bandwidth solutions. In addition, new developments in satellite technology, in particular, low Earth orbit (LEO) satellite constellations, are improving the performance and cost profile of dedicated bandwidth systems, providing a catalyst for wider deployment.
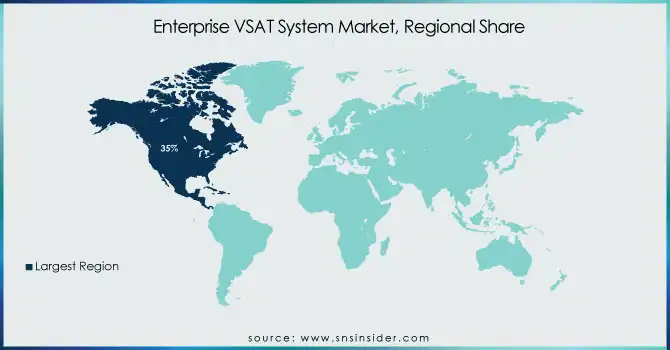
North America occupied the largest share of 35% of the Enterprise VSAT System Market in 2023 and is home to some significant companies adopting satellite communication in the region. A clear example of this is Viasat, a company that provides satellite broadband and communication services throughout the continent (including rural distant areas where terrestrial broadband infrastructure is lacking) from its base in the U.S. The region continues to pioneer the development of higher-capacity satellite systems, as exemplified in Viasat's ViaSat-3 constellation, which supports both commercial and government markets. VSATs are used extensively by the U.S. military to communicate securely for away missions. In North America, the mass adoption of VSAT technology across consumer and enterprise markets has underscored the critical need for satellite connectivity ability here.
Asia Pacific is expected to have the highest growth in CAGR from 2024 to 2032 which can be attributed to the high rate of infrastructure development and demand for reliable communication services across the region (growth-BOA). One of the more visible examples in this area is Telesat's Lightspeed Network, intended to extend high-speed, low-latency satellite connectivity in developing regions in Asia. For the adoption of satellite-based communication, countries like India, China, and Indonesia, play an integral role because of the large geography and increasing portion of the population which is rural. In India, the use of VSAT technology forms an essential backbone of the progress toward achieving digital inclusion as seen in the drive for cost-effective, high-speed internet in rural areas as a vital component of the overall Digital India Initiative. Asia's rapid growth of VSAT adoption has been driven by the increased use of IoT and the deployment of 5G networks, both of which call for reliable satellite communication infrastructure.
Need any customization research on Enterprise VSAT System Market - Enquiry Now
Some of the major players in the Enterprise VSAT System Market are:
Hughes (HughesNet, HT2000W)
Bharti Airtel (Airtel Enterprise VSAT, Airtel Link)
Gilat Satellite Networks (SkyEdge II-c, Scorpio)
ViaSat (ViaSat-2, ViaSat-3)
VT iDirect (iDirect Evolution, iQ Desktop)
Comtech Telecommunications (Comtech X5, Comtech SATCOM)
SpeedCast (SpeedCast Enterprise VSAT, SpeedCast Global Satellite Solutions)
Advantech (ADL8300, ADL8320)
Newtec (MEC 5100, Dialog Hub)
Tatanet (VSAT Service, Broadband Satellite Communication)
PolarSat (PolarSat 1, PolarSat 3)
Global Eagle (GoDirect, EagleCast)
Omniaccess (Maritime VSAT, Business VSAT)
Skycaster (Skycast VSAT, Skycast Pro)
Gigasat (Gigasat Go, Gigasat Max)
Singtel (Singtel Enterprise Connectivity, Singtel VSAT)
Paratus Group (Starlink Services, Paratus High-Speed Services)
4N Telecommunication (4N VSAT, 4N Data Solutions)
NOVAsat (Maritime VSAT, Offshore VSAT)
ICCSAT (Oil & Gas VSAT, Remote Site VSAT)
L3Harris Technologies
SES S.A.
Intelsat
Thales Alenia Space
Telesat
ViaSat Inc.
Rohde & Schwarz
Mitsubishi Electric
Airbus Defence and Space
Harris Corporation
In June 2023, Hughes' JUPITER 3 satellite, is now delivering high-speed internet across the Americas, including rural regions, with speeds up to 100 Mbps. The system's AI-powered ground network enhances connectivity by reducing latency and optimizing throughput.
In October 2024, Gilat Satellite Networks Ltd. secured a USD 4 million contract to provide rural connectivity and support banking services in Latin America over the next three years.
In May 2024, Viasat, Inc. partnered with Azercosmos to deliver its reliable L-band satellite services to Azerbaijan and surrounding regions. The collaboration aims to enhance connectivity across the area.
Report Attributes | Details |
---|---|
Market Size in 2023 |
USD 6.02 Billion |
Market Size by 2032 |
USD 11.32 Billion |
CAGR |
CAGR of 7.29% From 2024 to 2032 |
Base Year |
2023 |
Forecast Period |
2024-2032 |
Historical Data |
2020-2022 |
Report Scope & Coverage |
Market Size, Segments Analysis, Competitive Landscape, Regional Analysis, DROC & SWOT Analysis, Forecast Outlook |
Key Segments |
• By Component (Hardware, Service) |
Regional Analysis/Coverage |
North America (US, Canada, Mexico), Europe (Eastern Europe [Poland, Romania, Hungary, Turkey, Rest of Eastern Europe] Western Europe] Germany, France, UK, Italy, Spain, Netherlands, Switzerland, Austria, Rest of Western Europe]), Asia Pacific (China, India, Japan, South Korea, Vietnam, Singapore, Australia, Rest of Asia Pacific), Middle East & Africa (Middle East [UAE, Egypt, Saudi Arabia, Qatar, Rest of Middle East], Africa [Nigeria, South Africa, Rest of Africa], Latin America (Brazil, Argentina, Colombia, Rest of Latin America) |
Company Profiles |
Hughes, Bharti Airtel, Gilat Satellite Networks, ViaSat, VT iDirect, Comtech Telecommunications, SpeedCast, Advantech, Newtec, Tatanet, PolarSat, Global Eagle, Omniaccess, Skycaster, Gigasat, Singtel, Paratus Group, 4N Telecommunication, NOVAsat, ICCSAT. |
Key Drivers |
• 5G and Satellite Integration Drives VSAT Market Growth with IoT Expansion and Enhanced Connectivity |
RESTRAINTS |
• Challenges in the Enterprise VSAT System Market Due to Bandwidth Limitations Signal Interference and Regulatory Hurdles |
Ans: North America dominated the Enterprise VSAT System Market in 2023.
Ans: The Small and Medium Enterprises segment dominated the Enterprise VSAT System Market in 2023.
Ans: The major growth factor of the Enterprise VSAT System Market is the increasing demand for reliable and high-speed connectivity in remote and underserved areas, driven by sectors like IT & Telecom, BFSI, and government services.
Ans: Enterprise VSAT System Market size was USD 6.02 billion in 2023 and is expected to Reach USD 11.32 billion by 2032.
Ans: The Enterprise VSAT System Market is expected to grow at a CAGR of 7.29% during 2024-2032.
1. Introduction
1.1 Market Definition
1.2 Scope (Inclusion and Exclusions)
1.3 Research Assumptions
2. Executive Summary
2.1 Market Overview
2.2 Regional Synopsis
2.3 Competitive Summary
3. Research Methodology
3.1 Top-Down Approach
3.2 Bottom-up Approach
3.3. Data Validation
3.4 Primary Interviews
4. Market Dynamics Impact Analysis
4.1 Market Driving Factors Analysis
4.1.1 Drivers
4.1.2 Restraints
4.1.3 Opportunities
4.1.4 Challenges
4.2 PESTLE Analysis
4.3 Porter’s Five Forces Model
5. Statistical Insights and Trends Reporting
5.1 Enterprise VSAT System Adoption Rates (2023)
5.2 Enterprise VSAT System Latency and Bandwidth Usage (2023)
5.3 Enterprise VSAT System Technology and Innovation Metrics
5.4 Enterprise VSAT System Geographic Penetration
6. Competitive Landscape
6.1 List of Major Companies, By Region
6.2 Market Share Analysis, By Region
6.3 Product Benchmarking
6.3.1 Product specifications and features
6.3.2 Pricing
6.4 Strategic Initiatives
6.4.1 Marketing and promotional activities
6.4.2 Distribution and Supply Chain Strategies
6.4.3 Expansion plans and new product launches
6.4.4 Strategic partnerships and collaborations
6.5 Technological Advancements
6.6 Market Positioning and Branding
7. Enterprise VSAT System Market Segmentation, By Component
7.1 Chapter Overview
7.2 Hardware
7.2.1 Hardware Market Trends Analysis (2020-2032)
7.2.2 Hardware Market Size Estimates and Forecasts to 2032 (USD Billion)
7.3 Service
7.3.1 Service Market Trends Analysis (2020-2032)
7.3.2 Service Market Size Estimates and Forecasts to 2032 (USD Billion)
8. Enterprise VSAT System Market Segmentation, By Organization Size
8.1 Chapter Overview
8.2 Small and Medium Enterprises
8.2.1 Small and Medium Enterprises Market Trends Analysis (2020-2032)
8.2.2 Small and Medium Enterprises Market Size Estimates and Forecasts to 2032 (USD Billion)
8.3 Large Enterprise
8.3.1 Large Enterprise Market Trends Analysis (2020-2032)
8.3.2 Large Enterprise Market Size Estimates and Forecasts to 2032 (USD Billion)
9. Enterprise VSAT System Market Segmentation, By End Use
9.1 Chapter Overview
9.2 Education
9.2.1 Education Market Trends Analysis (2020-2032)
9.2.2 Education Market Size Estimates and Forecasts to 2032 (USD Billion)
9.3 Banking, Financial Services, And Insurance (BFSI)
9.3.1 Banking, Financial Services, And Insurance (BFSI) Market Trends Analysis (2020-2032)
9.3.2 Banking, Financial Services, And Insurance (BFSI) Market Size Estimates and Forecasts to 2032 (USD Billion)
9.4 Healthcare
9.4.1 Healthcare Market Trends Analysis (2020-2032)
9.4.2 Healthcare Market Size Estimates and Forecasts to 2032 (USD Billion)
9.5 IT & Telecom
9.5.1 IT & Telecom Market Trends Analysis (2020-2032)
9.5.2 IT & Telecom Market Size Estimates and Forecasts to 2032 (USD Billion)
9.6 Retail
9.6.1 Retail Market Trends Analysis (2020-2032)
9.6.2 Retail Market Size Estimates and Forecasts to 2032 (USD Billion)
9.7 Entertainment & Media
9.7.1 Entertainment & Media Market Trends Analysis (2020-2032)
9.7.2 Entertainment & Media Market Size Estimates and Forecasts to 2032 (USD Billion)
9.8 Others
9.8.1 Others Market Trends Analysis (2020-2032)
9.8.2 Others Market Size Estimates and Forecasts to 2032 (USD Billion)
10. Enterprise VSAT System Market Segmentation, By Type
10.1 Chapter Overview
10.2 Dedicated Bandwidth VSAT Systems
10.2.1 Dedicated Bandwidth VSAT Systems Market Trends Analysis (2020-2032)
10.2.2 Dedicated Bandwidth VSAT Systems Market Size Estimates and Forecasts to 2032 (USD Billion)
10.3 Shared Bandwidth VSAT Systems
10.3.1 Shared Bandwidth VSAT Systems Market Trends Analysis (2020-2032)
10.3.2 Shared Bandwidth VSAT Systems Market Size Estimates and Forecasts to 2032 (USD Billion)
11. Regional Analysis
11.1 Chapter Overview
11.2 North America
11.2.1 Trends Analysis
11.2.2 North America Enterprise VSAT System Market Estimates and Forecasts, by Country (2020-2032) (USD Billion)
11.2.3 North America Enterprise VSAT System Market Estimates and Forecasts, By Component (2020-2032) (USD Billion)
11.2.4 North America Enterprise VSAT System Market Estimates and Forecasts, By Organization Size (2020-2032) (USD Billion)
11.2.5 North America Enterprise VSAT System Market Estimates and Forecasts, By End Use (2020-2032) (USD Billion)
11.2.6 North America Enterprise VSAT System Market Estimates and Forecasts, By Type (2020-2032) (USD Billion)
11.2.7 USA
11.2.7.1 USA Enterprise VSAT System Market Estimates and Forecasts, By Component (2020-2032) (USD Billion)
11.2.7.2 USA Enterprise VSAT System Market Estimates and Forecasts, By Organization Size (2020-2032) (USD Billion)
11.2.7.3 USA Enterprise VSAT System Market Estimates and Forecasts, By End Use (2020-2032) (USD Billion)
11.2.7.4 USA Enterprise VSAT System Market Estimates and Forecasts, By Type (2020-2032) (USD Billion)
11.2.8 Canada
11.2.8.1 Canada Enterprise VSAT System Market Estimates and Forecasts, By Component (2020-2032) (USD Billion)
11.2.8.2 Canada Enterprise VSAT System Market Estimates and Forecasts, By Organization Size (2020-2032) (USD Billion)
11.2.8.3 Canada Enterprise VSAT System Market Estimates and Forecasts, By End Use (2020-2032) (USD Billion)
11.2.8.4 Canada Enterprise VSAT System Market Estimates and Forecasts, By Type (2020-2032) (USD Billion)
11.2.9 Mexico
11.2.9.1 Mexico Enterprise VSAT System Market Estimates and Forecasts, By Component (2020-2032) (USD Billion)
11.2.9.2 Mexico Enterprise VSAT System Market Estimates and Forecasts, By Organization Size (2020-2032) (USD Billion)
11.2.9.3 Mexico Enterprise VSAT System Market Estimates and Forecasts, By End Use (2020-2032) (USD Billion)
11.2.9.4 Mexico Enterprise VSAT System Market Estimates and Forecasts, By Type (2020-2032) (USD Billion)
11.3 Europe
11.3.1 Eastern Europe
11.3.1.1 Trends Analysis
11.3.1.2 Eastern Europe Enterprise VSAT System Market Estimates and Forecasts, by Country (2020-2032) (USD Billion)
11.3.1.3 Eastern Europe Enterprise VSAT System Market Estimates and Forecasts, By Component (2020-2032) (USD Billion)
11.3.1.4 Eastern Europe Enterprise VSAT System Market Estimates and Forecasts, By Organization Size (2020-2032) (USD Billion)
11.3.1.5 Eastern Europe Enterprise VSAT System Market Estimates and Forecasts, By End Use (2020-2032) (USD Billion)
11.3.1.6 Eastern Europe Enterprise VSAT System Market Estimates and Forecasts, By Type (2020-2032) (USD Billion)
11.3.1.7 Poland
11.3.1.7.1 Poland Enterprise VSAT System Market Estimates and Forecasts, By Component (2020-2032) (USD Billion)
11.3.1.7.2 Poland Enterprise VSAT System Market Estimates and Forecasts, By Organization Size (2020-2032) (USD Billion)
11.3.1.7.3 Poland Enterprise VSAT System Market Estimates and Forecasts, By End Use (2020-2032) (USD Billion)
11.3.1.7.4 Poland Enterprise VSAT System Market Estimates and Forecasts, By Type (2020-2032) (USD Billion)
11.3.1.8 Romania
11.3.1.8.1 Romania Enterprise VSAT System Market Estimates and Forecasts, By Component (2020-2032) (USD Billion)
11.3.1.8.2 Romania Enterprise VSAT System Market Estimates and Forecasts, By Organization Size (2020-2032) (USD Billion)
11.3.1.8.3 Romania Enterprise VSAT System Market Estimates and Forecasts, By End Use (2020-2032) (USD Billion)
11.3.1.8.4 Romania Enterprise VSAT System Market Estimates and Forecasts, By Type (2020-2032) (USD Billion)
11.3.1.9 Hungary
11.3.1.9.1 Hungary Enterprise VSAT System Market Estimates and Forecasts, By Component (2020-2032) (USD Billion)
11.3.1.9.2 Hungary Enterprise VSAT System Market Estimates and Forecasts, By Organization Size (2020-2032) (USD Billion)
11.3.1.9.3 Hungary Enterprise VSAT System Market Estimates and Forecasts, By End Use (2020-2032) (USD Billion)
11.3.1.9.4 Hungary Enterprise VSAT System Market Estimates and Forecasts, By Type (2020-2032) (USD Billion)
11.3.1.10 turkey
11.3.1.10.1 Turkey Enterprise VSAT System Market Estimates and Forecasts, By Component (2020-2032) (USD Billion)
11.3.1.10.2 Turkey Enterprise VSAT System Market Estimates and Forecasts, By Organization Size (2020-2032) (USD Billion)
11.3.1.10.3 Turkey Enterprise VSAT System Market Estimates and Forecasts, By End Use (2020-2032) (USD Billion)
11.3.1.10.4 Turkey Enterprise VSAT System Market Estimates and Forecasts, By Type (2020-2032) (USD Billion)
11.3.1.11 Rest of Eastern Europe
11.3.1.11.1 Rest of Eastern Europe Enterprise VSAT System Market Estimates and Forecasts, By Component (2020-2032) (USD Billion)
11.3.1.11.2 Rest of Eastern Europe Enterprise VSAT System Market Estimates and Forecasts, By Organization Size (2020-2032) (USD Billion)
11.3.1.11.3 Rest of Eastern Europe Enterprise VSAT System Market Estimates and Forecasts, By End Use (2020-2032) (USD Billion)
11.3.1.11.4 Rest of Eastern Europe Enterprise VSAT System Market Estimates and Forecasts, By Type (2020-2032) (USD Billion)
11.3.2 Western Europe
11.3.2.1 Trends Analysis
11.3.2.2 Western Europe Enterprise VSAT System Market Estimates and Forecasts, by Country (2020-2032) (USD Billion)
11.3.2.3 Western Europe Enterprise VSAT System Market Estimates and Forecasts, By Component (2020-2032) (USD Billion)
11.3.2.4 Western Europe Enterprise VSAT System Market Estimates and Forecasts, By Organization Size (2020-2032) (USD Billion)
11.3.2.5 Western Europe Enterprise VSAT System Market Estimates and Forecasts, By End Use (2020-2032) (USD Billion)
11.3.2.6 Western Europe Enterprise VSAT System Market Estimates and Forecasts, By Type (2020-2032) (USD Billion)
11.3.2.7 Germany
11.3.2.7.1 Germany Enterprise VSAT System Market Estimates and Forecasts, By Component (2020-2032) (USD Billion)
11.3.2.7.2 Germany Enterprise VSAT System Market Estimates and Forecasts, By Organization Size (2020-2032) (USD Billion)
11.3.2.7.3 Germany Enterprise VSAT System Market Estimates and Forecasts, By End Use (2020-2032) (USD Billion)
11.3.2.7.4 Germany Enterprise VSAT System Market Estimates and Forecasts, By Type (2020-2032) (USD Billion)
11.3.2.8 France
11.3.2.8.1 France Enterprise VSAT System Market Estimates and Forecasts, By Component (2020-2032) (USD Billion)
11.3.2.8.2 France Enterprise VSAT System Market Estimates and Forecasts, By Organization Size (2020-2032) (USD Billion)
11.3.2.8.3 France Enterprise VSAT System Market Estimates and Forecasts, By End Use (2020-2032) (USD Billion)
11.3.2.8.4 France Enterprise VSAT System Market Estimates and Forecasts, By Type (2020-2032) (USD Billion)
11.3.2.9 UK
11.3.2.9.1 UK Enterprise VSAT System Market Estimates and Forecasts, By Component (2020-2032) (USD Billion)
11.3.2.9.2 UK Enterprise VSAT System Market Estimates and Forecasts, By Organization Size (2020-2032) (USD Billion)
11.3.2.9.3 UK Enterprise VSAT System Market Estimates and Forecasts, By End Use (2020-2032) (USD Billion)
11.3.2.9.4 UK Enterprise VSAT System Market Estimates and Forecasts, By Type (2020-2032) (USD Billion)
11.3.2.10 Italy
11.3.2.10.1 Italy Enterprise VSAT System Market Estimates and Forecasts, By Component (2020-2032) (USD Billion)
11.3.2.10.2 Italy Enterprise VSAT System Market Estimates and Forecasts, By Organization Size (2020-2032) (USD Billion)
11.3.2.10.3 Italy Enterprise VSAT System Market Estimates and Forecasts, By End Use (2020-2032) (USD Billion)
11.3.2.10.4 Italy Enterprise VSAT System Market Estimates and Forecasts, By Type (2020-2032) (USD Billion)
11.3.2.11 Spain
11.3.2.11.1 Spain Enterprise VSAT System Market Estimates and Forecasts, By Component (2020-2032) (USD Billion)
11.3.2.11.2 Spain Enterprise VSAT System Market Estimates and Forecasts, By Organization Size (2020-2032) (USD Billion)
11.3.2.11.3 Spain Enterprise VSAT System Market Estimates and Forecasts, By End Use (2020-2032) (USD Billion)
11.3.2.11.4 Spain Enterprise VSAT System Market Estimates and Forecasts, By Type (2020-2032) (USD Billion)
11.3.2.12 Netherlands
11.3.2.12.1 Netherlands Enterprise VSAT System Market Estimates and Forecasts, By Component (2020-2032) (USD Billion)
11.3.2.12.2 Netherlands Enterprise VSAT System Market Estimates and Forecasts, By Organization Size (2020-2032) (USD Billion)
11.3.2.12.3 Netherlands Enterprise VSAT System Market Estimates and Forecasts, By End Use (2020-2032) (USD Billion)
11.3.2.12.4 Netherlands Enterprise VSAT System Market Estimates and Forecasts, By Type (2020-2032) (USD Billion)
11.3.2.13 Switzerland
11.3.2.13.1 Switzerland Enterprise VSAT System Market Estimates and Forecasts, By Component (2020-2032) (USD Billion)
11.3.2.13.2 Switzerland Enterprise VSAT System Market Estimates and Forecasts, By Organization Size (2020-2032) (USD Billion)
11.3.2.13.3 Switzerland Enterprise VSAT System Market Estimates and Forecasts, By End Use (2020-2032) (USD Billion)
11.3.2.13.4 Switzerland Enterprise VSAT System Market Estimates and Forecasts, By Type (2020-2032) (USD Billion)
11.3.2.14 Austria
11.3.2.14.1 Austria Enterprise VSAT System Market Estimates and Forecasts, By Component (2020-2032) (USD Billion)
11.3.2.14.2 Austria Enterprise VSAT System Market Estimates and Forecasts, By Organization Size (2020-2032) (USD Billion)
11.3.2.14.3 Austria Enterprise VSAT System Market Estimates and Forecasts, By End Use (2020-2032) (USD Billion)
11.3.2.14.4 Austria Enterprise VSAT System Market Estimates and Forecasts, By Type (2020-2032) (USD Billion)
11.3.2.15 Rest of Western Europe
11.3.2.15.1 Rest of Western Europe Enterprise VSAT System Market Estimates and Forecasts, By Component (2020-2032) (USD Billion)
11.3.2.15.2 Rest of Western Europe Enterprise VSAT System Market Estimates and Forecasts, By Organization Size (2020-2032) (USD Billion)
11.3.2.15.3 Rest of Western Europe Enterprise VSAT System Market Estimates and Forecasts, By End Use (2020-2032) (USD Billion)
11.3.2.15.4 Rest of Western Europe Enterprise VSAT System Market Estimates and Forecasts, By Type (2020-2032) (USD Billion)
11.4 Asia Pacific
11.4.1 Trends Analysis
11.4.2 Asia Pacific Enterprise VSAT System Market Estimates and Forecasts, by Country (2020-2032) (USD Billion)
11.4.3 Asia Pacific Enterprise VSAT System Market Estimates and Forecasts, By Component (2020-2032) (USD Billion)
11.4.4 Asia Pacific Enterprise VSAT System Market Estimates and Forecasts, By Organization Size (2020-2032) (USD Billion)
11.4.5 Asia Pacific Enterprise VSAT System Market Estimates and Forecasts, By End Use (2020-2032) (USD Billion)
11.4.6 Asia Pacific Enterprise VSAT System Market Estimates and Forecasts, By Type (2020-2032) (USD Billion)
11.4.7 China
11.4.7.1 China Enterprise VSAT System Market Estimates and Forecasts, By Component (2020-2032) (USD Billion)
11.4.7.2 China Enterprise VSAT System Market Estimates and Forecasts, By Organization Size (2020-2032) (USD Billion)
11.4.7.3 China Enterprise VSAT System Market Estimates and Forecasts, By End Use (2020-2032) (USD Billion)
11.4.7.4 China Enterprise VSAT System Market Estimates and Forecasts, By Type (2020-2032) (USD Billion)
11.4.8 India
11.4.8.1 India Enterprise VSAT System Market Estimates and Forecasts, By Component (2020-2032) (USD Billion)
11.4.8.2 India Enterprise VSAT System Market Estimates and Forecasts, By Organization Size (2020-2032) (USD Billion)
11.4.8.3 India Enterprise VSAT System Market Estimates and Forecasts, By End Use (2020-2032) (USD Billion)
11.4.8.4 India Enterprise VSAT System Market Estimates and Forecasts, By Type (2020-2032) (USD Billion)
11.4.9 Japan
11.4.9.1 Japan Enterprise VSAT System Market Estimates and Forecasts, By Component (2020-2032) (USD Billion)
11.4.9.2 Japan Enterprise VSAT System Market Estimates and Forecasts, By Organization Size (2020-2032) (USD Billion)
11.4.9.3 Japan Enterprise VSAT System Market Estimates and Forecasts, By End Use (2020-2032) (USD Billion)
11.4.9.4 Japan Enterprise VSAT System Market Estimates and Forecasts, By Type (2020-2032) (USD Billion)
11.4.10 South Korea
11.4.10.1 South Korea Enterprise VSAT System Market Estimates and Forecasts, By Component (2020-2032) (USD Billion)
11.4.10.2 South Korea Enterprise VSAT System Market Estimates and Forecasts, By Organization Size (2020-2032) (USD Billion)
11.4.10.3 South Korea Enterprise VSAT System Market Estimates and Forecasts, By End Use (2020-2032) (USD Billion)
11.4.10.4 South Korea Enterprise VSAT System Market Estimates and Forecasts, By Type (2020-2032) (USD Billion)
11.4.11 Vietnam
11.4.11.1 Vietnam Enterprise VSAT System Market Estimates and Forecasts, By Component (2020-2032) (USD Billion)
11.4.11.2 Vietnam Enterprise VSAT System Market Estimates and Forecasts, By Organization Size (2020-2032) (USD Billion)
11.4.11.3 Vietnam Enterprise VSAT System Market Estimates and Forecasts, By End Use (2020-2032) (USD Billion)
11.4.11.4 Vietnam Enterprise VSAT System Market Estimates and Forecasts, By Type (2020-2032) (USD Billion)
11.4.12 Singapore
11.4.12.1 Singapore Enterprise VSAT System Market Estimates and Forecasts, By Component (2020-2032) (USD Billion)
11.4.12.2 Singapore Enterprise VSAT System Market Estimates and Forecasts, By Organization Size (2020-2032) (USD Billion)
11.4.12.3 Singapore Enterprise VSAT System Market Estimates and Forecasts, By End Use (2020-2032) (USD Billion)
11.4.12.4 Singapore Enterprise VSAT System Market Estimates and Forecasts, By Type (2020-2032) (USD Billion)
11.4.13 Australia
11.4.13.1 Australia Enterprise VSAT System Market Estimates and Forecasts, By Component (2020-2032) (USD Billion)
11.4.13.2 Australia Enterprise VSAT System Market Estimates and Forecasts, By Organization Size (2020-2032) (USD Billion)
11.4.13.3 Australia Enterprise VSAT System Market Estimates and Forecasts, By End Use (2020-2032) (USD Billion)
11.4.13.4 Australia Enterprise VSAT System Market Estimates and Forecasts, By Type (2020-2032) (USD Billion)
11.4.14 Rest of Asia Pacific
11.4.14.1 Rest of Asia Pacific Enterprise VSAT System Market Estimates and Forecasts, By Component (2020-2032) (USD Billion)
11.4.14.2 Rest of Asia Pacific Enterprise VSAT System Market Estimates and Forecasts, By Organization Size (2020-2032) (USD Billion)
11.4.14.3 Rest of Asia Pacific Enterprise VSAT System Market Estimates and Forecasts, By End Use (2020-2032) (USD Billion)
11.4.14.4 Rest of Asia Pacific Enterprise VSAT System Market Estimates and Forecasts, By Type (2020-2032) (USD Billion)
11.5 Middle East and Africa
11.5.1 Middle East
11.5.1.1 Trends Analysis
11.5.1.2 Middle East Enterprise VSAT System Market Estimates and Forecasts, by Country (2020-2032) (USD Billion)
11.5.1.3 Middle East Enterprise VSAT System Market Estimates and Forecasts, By Component (2020-2032) (USD Billion)
11.5.1.4 Middle East Enterprise VSAT System Market Estimates and Forecasts, By Organization Size (2020-2032) (USD Billion)
11.5.1.5 Middle East Enterprise VSAT System Market Estimates and Forecasts, By End Use (2020-2032) (USD Billion)
11.5.1.6 Middle East Enterprise VSAT System Market Estimates and Forecasts, By Type (2020-2032) (USD Billion)
11.5.1.7 UAE
11.5.1.7.1 UAE Enterprise VSAT System Market Estimates and Forecasts, By Component (2020-2032) (USD Billion)
11.5.1.7.2 UAE Enterprise VSAT System Market Estimates and Forecasts, By Organization Size (2020-2032) (USD Billion)
11.5.1.7.3 UAE Enterprise VSAT System Market Estimates and Forecasts, By End Use (2020-2032) (USD Billion)
11.5.1.7.4 UAE Enterprise VSAT System Market Estimates and Forecasts, By Type (2020-2032) (USD Billion)
11.5.1.8 Egypt
11.5.1.8.1 Egypt Enterprise VSAT System Market Estimates and Forecasts, By Component (2020-2032) (USD Billion)
11.5.1.8.2 Egypt Enterprise VSAT System Market Estimates and Forecasts, By Organization Size (2020-2032) (USD Billion)
11.5.1.8.3 Egypt Enterprise VSAT System Market Estimates and Forecasts, By End Use (2020-2032) (USD Billion)
11.5.1.8.4 Egypt Enterprise VSAT System Market Estimates and Forecasts, By Type (2020-2032) (USD Billion)
11.5.1.9 Saudi Arabia
11.5.1.9.1 Saudi Arabia Enterprise VSAT System Market Estimates and Forecasts, By Component (2020-2032) (USD Billion)
11.5.1.9.2 Saudi Arabia Enterprise VSAT System Market Estimates and Forecasts, By Organization Size (2020-2032) (USD Billion)
11.5.1.9.3 Saudi Arabia Enterprise VSAT System Market Estimates and Forecasts, By End Use (2020-2032) (USD Billion)
11.5.1.9.4 Saudi Arabia Enterprise VSAT System Market Estimates and Forecasts, By Type (2020-2032) (USD Billion)
11.5.1.10 Qatar
11.5.1.10.1 Qatar Enterprise VSAT System Market Estimates and Forecasts, By Component (2020-2032) (USD Billion)
11.5.1.10.2 Qatar Enterprise VSAT System Market Estimates and Forecasts, By Organization Size (2020-2032) (USD Billion)
11.5.1.10.3 Qatar Enterprise VSAT System Market Estimates and Forecasts, By End Use (2020-2032) (USD Billion)
11.5.1.10.4 Qatar Enterprise VSAT System Market Estimates and Forecasts, By Type (2020-2032) (USD Billion)
11.5.1.11 Rest of Middle East
11.5.1.11.1 Rest of Middle East Enterprise VSAT System Market Estimates and Forecasts, By Component (2020-2032) (USD Billion)
11.5.1.11.2 Rest of Middle East Enterprise VSAT System Market Estimates and Forecasts, By Organization Size (2020-2032) (USD Billion)
11.5.1.11.3 Rest of Middle East Enterprise VSAT System Market Estimates and Forecasts, By End Use (2020-2032) (USD Billion)
11.5.1.11.4 Rest of Middle East Enterprise VSAT System Market Estimates and Forecasts, By Type (2020-2032) (USD Billion)
11.5.2 Africa
11.5.2.1 Trends Analysis
11.5.2.2 Africa Enterprise VSAT System Market Estimates and Forecasts, by Country (2020-2032) (USD Billion)
11.5.2.3 Africa Enterprise VSAT System Market Estimates and Forecasts, By Component (2020-2032) (USD Billion)
11.5.2.4 Africa Enterprise VSAT System Market Estimates and Forecasts, By Organization Size (2020-2032) (USD Billion)
11.5.2.5 Africa Enterprise VSAT System Market Estimates and Forecasts, By End Use (2020-2032) (USD Billion)
11.5.2.6 Africa Enterprise VSAT System Market Estimates and Forecasts, By Type (2020-2032) (USD Billion)
11.5.2.7 South Africa
11.5.2.7.1 South Africa Enterprise VSAT System Market Estimates and Forecasts, By Component (2020-2032) (USD Billion)
11.5.2.7.2 South Africa Enterprise VSAT System Market Estimates and Forecasts, By Organization Size (2020-2032) (USD Billion)
11.5.2.7.3 South Africa Enterprise VSAT System Market Estimates and Forecasts, By End Use (2020-2032) (USD Billion)
11.5.2.7.4 South Africa Enterprise VSAT System Market Estimates and Forecasts, By Type (2020-2032) (USD Billion)
11.5.2.8 Nigeria
11.5.2.8.1 Nigeria Enterprise VSAT System Market Estimates and Forecasts, By Component (2020-2032) (USD Billion)
11.5.2.8.2 Nigeria Enterprise VSAT System Market Estimates and Forecasts, By Organization Size (2020-2032) (USD Billion)
11.5.2.8.3 Nigeria Enterprise VSAT System Market Estimates and Forecasts, By End Use (2020-2032) (USD Billion)
11.5.2.8.4 Nigeria Enterprise VSAT System Market Estimates and Forecasts, By Type (2020-2032) (USD Billion)
11.5.2.9 Rest of Africa
11.5.2.9.1 Rest of Africa Enterprise VSAT System Market Estimates and Forecasts, By Component (2020-2032) (USD Billion)
11.5.2.9.2 Rest of Africa Enterprise VSAT System Market Estimates and Forecasts, By Organization Size (2020-2032) (USD Billion)
11.5.2.9.3 Rest of Africa Enterprise VSAT System Market Estimates and Forecasts, By End Use (2020-2032) (USD Billion)
11.5.2.9.4 Rest of Africa Enterprise VSAT System Market Estimates and Forecasts, By Type (2020-2032) (USD Billion)
11.6 Latin America
11.6.1 Trends Analysis
11.6.2 Latin America Enterprise VSAT System Market Estimates and Forecasts, by Country (2020-2032) (USD Billion)
11.6.3 Latin America Enterprise VSAT System Market Estimates and Forecasts, By Component (2020-2032) (USD Billion)
11.6.4 Latin America Enterprise VSAT System Market Estimates and Forecasts, By Organization Size (2020-2032) (USD Billion)
11.6.5 Latin America Enterprise VSAT System Market Estimates and Forecasts, By End Use (2020-2032) (USD Billion)
11.6.6 Latin America Enterprise VSAT System Market Estimates and Forecasts, By Type (2020-2032) (USD Billion)
11.6.7 Brazil
11.6.7.1 Brazil Enterprise VSAT System Market Estimates and Forecasts, By Component (2020-2032) (USD Billion)
11.6.7.2 Brazil Enterprise VSAT System Market Estimates and Forecasts, By Organization Size (2020-2032) (USD Billion)
11.6.7.3 Brazil Enterprise VSAT System Market Estimates and Forecasts, By End Use (2020-2032) (USD Billion)
11.6.7.4 Brazil Enterprise VSAT System Market Estimates and Forecasts, By Type (2020-2032) (USD Billion)
11.6.8 Argentina
11.6.8.1 Argentina Enterprise VSAT System Market Estimates and Forecasts, By Component (2020-2032) (USD Billion)
11.6.8.2 Argentina Enterprise VSAT System Market Estimates and Forecasts, By Organization Size (2020-2032) (USD Billion)
11.6.8.3 Argentina Enterprise VSAT System Market Estimates and Forecasts, By End Use (2020-2032) (USD Billion)
11.6.8.4 Argentina Enterprise VSAT System Market Estimates and Forecasts, By Type (2020-2032) (USD Billion)
11.6.9 Colombia
11.6.9.1 Colombia Enterprise VSAT System Market Estimates and Forecasts, By Component (2020-2032) (USD Billion)
11.6.9.2 Colombia Enterprise VSAT System Market Estimates and Forecasts, By Organization Size (2020-2032) (USD Billion)
11.6.9.3 Colombia Enterprise VSAT System Market Estimates and Forecasts, By End Use (2020-2032) (USD Billion)
11.6.9.4 Colombia Enterprise VSAT System Market Estimates and Forecasts, By Type (2020-2032) (USD Billion)
11.6.10 Rest of Latin America
11.6.10.1 Rest of Latin America Enterprise VSAT System Market Estimates and Forecasts, By Component (2020-2032) (USD Billion)
11.6.10.2 Rest of Latin America Enterprise VSAT System Market Estimates and Forecasts, By Organization Size (2020-2032) (USD Billion)
11.6.10.3 Rest of Latin America Enterprise VSAT System Market Estimates and Forecasts, By End Use (2020-2032) (USD Billion)
11.6.10.4 Rest of Latin America Enterprise VSAT System Market Estimates and Forecasts, By Type (2020-2032) (USD Billion)
12. Company Profiles
12.1 Hughes
12.1.1 Company Overview
12.1.2 Financial
12.1.3 Products/ Services Offered
12.1.4 SWOT Analysis
12.2 Bharti Airtel
12.2.1 Company Overview
12.2.2 Financial
12.2.3 Products/ Services Offered
12.2.4 SWOT Analysis
12.3 Gilat Satellite Networks
12.3.1 Company Overview
12.3.2 Financial
12.3.3 Products/ Services Offered
12.3.4 SWOT Analysis
12.4 ViaSat
12.4.1 Company Overview
12.4.2 Financial
12.4.3 Products/ Services Offered
12.4.4 SWOT Analysis
12.5 VT iDirect
12.5.1 Company Overview
12.5.2 Financial
12.5.3 Products/ Services Offered
12.5.4 SWOT Analysis
12.6 Comtech Telecommunications
12.6.1 Company Overview
12.6.2 Financial
12.6.3 Products/ Services Offered
12.6.4 SWOT Analysis
12.7 SpeedCast
12.7.1 Company Overview
12.7.2 Financial
12.7.3 Products/ Services Offered
12.7.4 SWOT Analysis
12.8 Advantech
12.8.1 Company Overview
12.8.2 Financial
12.8.3 Products/ Services Offered
12.8.4 SWOT Analysis
12.9 Newtec
12.9.1 Company Overview
12.9.2 Financial
12.9.3 Products/ Services Offered
12.9.4 SWOT Analysis
12.10 Tatanet
12.10.1 Company Overview
12.10.2 Financial
12.10.3 Products/ Services Offered
12.10.4 SWOT Analysis
13. Use Cases and Best Practices
14. Conclusion
An accurate research report requires proper strategizing as well as implementation. There are multiple factors involved in the completion of good and accurate research report and selecting the best methodology to compete the research is the toughest part. Since the research reports we provide play a crucial role in any company’s decision-making process, therefore we at SNS Insider always believe that we should choose the best method which gives us results closer to reality. This allows us to reach at a stage wherein we can provide our clients best and accurate investment to output ratio.
Each report that we prepare takes a timeframe of 350-400 business hours for production. Starting from the selection of titles through a couple of in-depth brain storming session to the final QC process before uploading our titles on our website we dedicate around 350 working hours. The titles are selected based on their current market cap and the foreseen CAGR and growth.
The 5 steps process:
Step 1: Secondary Research:
Secondary Research or Desk Research is as the name suggests is a research process wherein, we collect data through the readily available information. In this process we use various paid and unpaid databases which our team has access to and gather data through the same. This includes examining of listed companies’ annual reports, Journals, SEC filling etc. Apart from this our team has access to various associations across the globe across different industries. Lastly, we have exchange relationships with various university as well as individual libraries.
Step 2: Primary Research
When we talk about primary research, it is a type of study in which the researchers collect relevant data samples directly, rather than relying on previously collected data. This type of research is focused on gaining content specific facts that can be sued to solve specific problems. Since the collected data is fresh and first hand therefore it makes the study more accurate and genuine.
We at SNS Insider have divided Primary Research into 2 parts.
Part 1 wherein we interview the KOLs of major players as well as the upcoming ones across various geographic regions. This allows us to have their view over the market scenario and acts as an important tool to come closer to the accurate market numbers. As many as 45 paid and unpaid primary interviews are taken from both the demand and supply side of the industry to make sure we land at an accurate judgement and analysis of the market.
This step involves the triangulation of data wherein our team analyses the interview transcripts, online survey responses and observation of on filed participants. The below mentioned chart should give a better understanding of the part 1 of the primary interview.
Part 2: In this part of primary research the data collected via secondary research and the part 1 of the primary research is validated with the interviews from individual consultants and subject matter experts.
Consultants are those set of people who have at least 12 years of experience and expertise within the industry whereas Subject Matter Experts are those with at least 15 years of experience behind their back within the same space. The data with the help of two main processes i.e., FGDs (Focused Group Discussions) and IDs (Individual Discussions). This gives us a 3rd party nonbiased primary view of the market scenario making it a more dependable one while collation of the data pointers.
Step 3: Data Bank Validation
Once all the information is collected via primary and secondary sources, we run that information for data validation. At our intelligence centre our research heads track a lot of information related to the market which includes the quarterly reports, the daily stock prices, and other relevant information. Our data bank server gets updated every fortnight and that is how the information which we collected using our primary and secondary information is revalidated in real time.
Step 4: QA/QC Process
After all the data collection and validation our team does a final level of quality check and quality assurance to get rid of any unwanted or undesired mistakes. This might include but not limited to getting rid of the any typos, duplication of numbers or missing of any important information. The people involved in this process include technical content writers, research heads and graphics people. Once this process is completed the title gets uploader on our platform for our clients to read it.
Step 5: Final QC/QA Process:
This is the last process and comes when the client has ordered the study. In this process a final QA/QC is done before the study is emailed to the client. Since we believe in giving our clients a good experience of our research studies, therefore, to make sure that we do not lack at our end in any way humanly possible we do a final round of quality check and then dispatch the study to the client.
By Component
By Organization Size
By End Use
By Type
Request for Segment Customization as per your Business Requirement: Segment Customization Request
North America
Europe
Asia Pacific
Middle East & Africa
Latin America
Request for Country Level Research Report: Country Level Customization Request
With the given market data, SNS Insider offers customization as per the company’s specific needs. The following customization options are available for the report:
The Commerce Cloud Market was valued at USD 21.0 Billion in 2023 and is expected to reach USD 138.3 Billion by 2032, growing at a CAGR of 23.35% from 2024-2032.
The Data Loss Prevention (DLP) Solutions market size was valued at US$ 2.29 Bn in 2023 and is expected to reach USD 13.66 Bn by 2032 and grow at a CAGR of 21.95 % over the forecast period 2024-2032.
The Data Brokers Market Size was USD 257.2 Billion in 2023. It is expected to grow to USD 441.4 Billion by 2032 and grow at a CAGR of 7.4% by 2024-2032.
The Robotics-as-a-Service (RaaS) Market was valued at USD 1.61 billion in 2023 and is expected to reach USD 6.80 Billion by 2032, growing at a CAGR of 17.40% over the forecast period 2024-2032.
Knowledge Process Outsourcing Market valued at USD 57.2 billion in 2023, is expected to grow to USD 238.7 billion by 2032, at a CAGR of 17.22% over 2024-2032.
The Bare Metal Cloud Market was valued at USD 8.47 billion in 2023 and is expected to reach USD 46.14 billion by 2032, growing at a CAGR of 20.77% over the forecast period 2024-2032.
Hi! Click one of our member below to chat on Phone