IaaS & PaaS Market Report Scope & Overview:
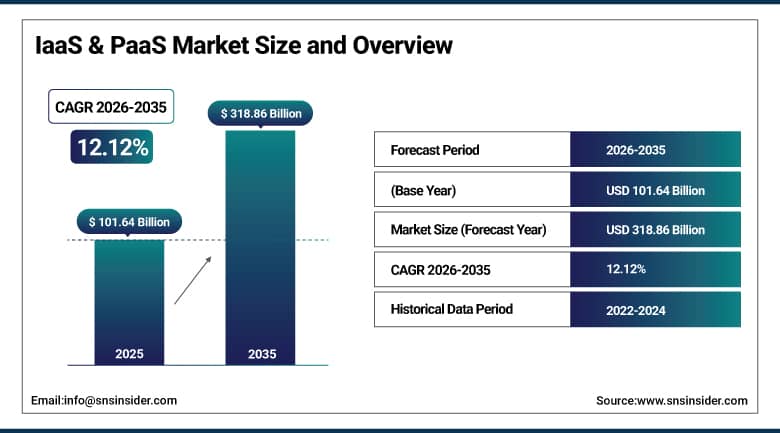
The IaaS & PaaS Market was valued at USD 101.64 billion in 2025 and is expected to reach USD 318.86 billion by 2035, growing at a CAGR of 12.12% from 2026–2035.
IaaS and PaaS services provide the infrastructure for computational purposes, software development, storage, network connections, and application deployments through the internet. These have been gaining immense popularity across various sectors such as financial institutions, healthcare sector, retail industry, manufacturing sector, telecommunications, government agencies, media sector, and IT companies owing to their flexible nature, scalability, and cost-effectiveness. The key products offered by the IaaS include virtual machines, storage options, network connectivity, and data centers, while the key products offered by the PaaS include application development platform, database, middleware, artificial intelligence, and containerization. The key drivers that are fueling the growth of the Global IaaS & PaaS Market include digital transformation initiatives in enterprises, hybrid or multi-cloud strategies, demand for artificial intelligence infrastructure, and rapid technological advancements in IoT, big data analytics, edge computing, and cloud-native applications.
The Infrastructure as a Service (IaaS) service segment held the highest market share in the global IaaS & PaaS Market in 2024, accounting for around 57.4% of total revenue generation owing to the growing adoption of scalable cloud infrastructure among companies, increasing adoption of virtualized data centers, and rising need for high-performance computing infrastructure. Organizations across different industries are adopting IaaS solutions to facilitate artificial intelligence computing, cloud storage services, disaster recovery infrastructure, security infrastructure, and enterprise applications. Capital investment in hyperscale data centers, generative AI computing infrastructure, and cloud infrastructure modernization.
IaaS & PaaS Market Size and Forecast
-
Market Size in 2025: USD 101.64 Billion
-
Market Size by 2035: USD 318.86 Billion
-
CAGR: 12.12% from 2026 to 2035
-
Base Year: 2025
-
Forecast Period: 2026–2035
-
Historical Data: 2022–2024
To Get More Information On IaaS & PaaS Market - Request Free Sample Report
IaaS & PaaS Market Trends
-
The fast-paced developments of generative AI, hyperscale cloud computing, and artificial intelligence in data center workloads have led to higher demands for highly scalable Infrastructure-as-a-Service (IaaS) and cloud-native Platforms-as-a-Service (PaaS).
-
The trend of using hybrid clouds and multi-cloud computing is leading to the development of more flexible infrastructure management software and software development platforms.
-
Containerization, Kubernetes orchestration technology, and the microservices architecture have been leading the developments in platforms for PaaS development.
-
Edge computing technologies, IoT platforms, and the emergence of real-time analytics infrastructures have been leading to the demand for low-latency cloud computing platforms.
-
Cloud computing platforms are using automation technologies in the areas of monitoring, optimization of workload, and intelligent security features.
-
Developments in sovereign clouds, semiconductors-driven artificial intelligence in computing capabilities, and future-generation data centers by 2025 and 2026 will drive demand for cloud platforms globally.
-
Green data centers and sustainable cloud computing infrastructure are getting popular with organizations.
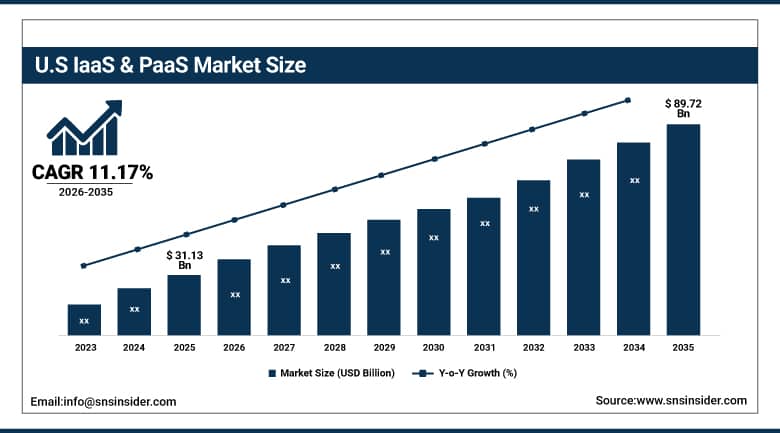
U.S. IaaS & PaaS Market Size Outlook:
The U.S. IaaS & PaaS Market was valued at USD 31.13 billion in 2025 and is expected to reach USD 89.72 billion by 2035, at a CAGR of 11.17% from 2026 to 2035.
The key elements contributing towards growth in the IaaS and PaaS Cloud Market in the USA include an increase in migration to the cloud on the part of businesses, expenditure on AI infrastructure, development of large-scale data centers, and demand for scalable computation from banks, the healthcare sector, retailers, military units, and telecommunications systems. The increased use of hybrid clouds, cloud-native applications, container technology, and analytics platforms that use AI technologies is greatly contributing to market growth. By 2025 and 2026, expenditure by the government on digital infrastructure improvement, enhanced cybersecurity measures, and AI semiconductor technology will bolster the use of cloud infrastructure in the USA.
According to predictions, it is expected that the revenue to be gained by American providers of cloud computing services would be immense after investing in generative AI servers, edge computing technology, and advanced cloud computing infrastructure. There is a need to develop models, automate enterprises, ensure cyber security, and conduct real-time analysis. This requirement is causing the scaling up of the ability of enterprises to provide hyperscale cloud computing infrastructure. Major companies based in America, such as Amazon Web Services (AWS), Microsoft Azure, Google Cloud, IBM, and Oracle, have been making huge investments in cloud computing services based on AI and sovereign clouds.
IaaS & PaaS Market Segment Insights
-
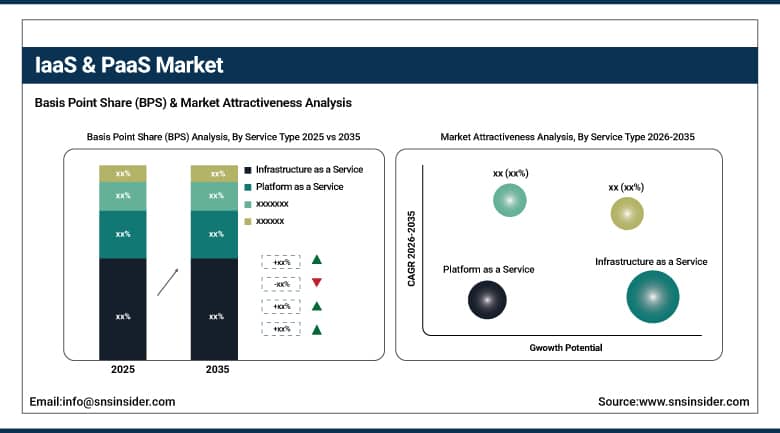
Based on Service Type, IaaS leads with 62.38% revenue share, driven by enterprises seeking flexible, on-demand compute and storage, while PaaS is growing fastest growing.
-
Based on Deployment Model, Public cloud dominates with 55.62% revenue share, while hybrid cloud is growing faster as businesses balance control with flexibility
-
Based on Enterprise Size, Large enterprises account for 68.29% IaaS & PaaS market share in 2025.
-
Based on Industry Vertical, IT & telecom vertical leads with 24.48%, leveraging cloud for software delivery, network services, and infrastructure modernization, while healthcare is fastest growing
By Service Type:
Infrastructure-as-a-Service (IaaS) (Largest Share):
The Infrastructure as a Service (IaaS) segment captured nearly 62.38% market share in the IaaS & PaaS space owing to the growing demand for scalable computing infrastructure, virtual storage, and cloud networking. Enterprises are adopting IaaS solutions to address the demands of scalable computing in addition to other demands like enterprise application support, AI-based workloads, disaster recovery, cyber security, and big data analysis solutions. The steady rise in the adoption rate of hyperscale data centers, cloud-native systems, and AI-driven enterprise systems has been crucial in making IaaS services highly dominant across the world. The growing investments made towards generative AI, edge computing, and cloud modernization in North America, Europe, and the Asia-Pacific region during 2025 and 2026 will help propel the growth of this segment.
Platform-as-a-Service (PaaS) (Fastest Growing):
The Platform-as-a-Service (PaaS) is expected to experience the fastest growth rate throughout the forecast period because of the high demand for cloud native application development, AI integration framework, and low code no code platform. PaaS solutions provide businesses with the ability to simplify software development, manage application lifecycle, and scale-up their digital transformation journey. Microservices architecture, DevOps automation, Kubernetes platform, and artificial intelligence for application development have gained huge popularity, thus creating significant demand for the PaaS ecosystem.
By Deployment Model:
Public Cloud (Largest Share):
Public Cloud Segment had the highest market share of the IaaS & PaaS Market in 2025 amounting to nearly 55.62%. This is mainly due to the following characteristics of scalability, cost-effectiveness of the infrastructure, quick availability, and accessibility. Public cloud technology is being used by several organizations from various industries including the banking sector, retail industry, healthcare, IT & telecommunication, and manufacturing industry to facilitate their digital transformation process, enable remote working, use artificial intelligence (AI) technology, and enterprise information management. Investments made in public cloud infrastructure by leading cloud service providers from 2025-2026 can boost the public cloud segment further.
Hybrid Cloud (Fastest Growing):
The Hybrid Cloud segment is expected to grow at the highest rate during the forecast period due to the rising preference among enterprises to ensure operational flexibility along with improved security and compliance standards. Hybrid cloud computing allows firms to combine the best of both worlds by combining the scalability and performance of public clouds and the control and security benefits of private clouds for mission-critical applications. The growing use of hybrid IT systems, multi-cloud management platforms, and AI-based workload optimization solutions is boosting the adoption of hybrid cloud computing models among large corporations worldwide.
By Enterprise Size:
Large Enterprises (Largest Share):
The segment of Large Enterprises secured around 68.29% market share in the IaaS & PaaS Market during 2025 because of their high investment in digital transformation, enterprise cloud, AI infrastructure, and advanced cybersecurity technology. There has been an emerging tendency amongst the large enterprises wherein they have started adopting cloud infrastructure and platform services that enable them to handle workloads, enterprise resource planning, AI analytics, and global operations. The increasing demand for scalability, disaster recovery, and cloud security solutions is driving the growth of the market in large enterprises.
Small & Medium Enterprises (Fastest Growing):
The segment of Small & Medium Enterprises is likely to witness the fastest CAGR in the coming years driven by higher adoption of affordable cloud infrastructure services, growing number of digital transformation projects, and increasing demands for scalable IT solutions in SMEs worldwide. Increasing adoption of IaaS & PaaS solutions among SMEs helps them in lowering their infrastructure costs, achieving greater operational flexibility, and fast application deployment processes. Availability of subscription-based cloud solutions, AI-enabled business applications, remote working environment, and cybersecurity solutions has been significantly promoting adoption of cloud infrastructure among SMEs. In addition, growth of e-commerce platforms, digital payment systems, and customer management solutions in 2025 and 2026 would support the market growth.
By Industry Vertical:
IT & Telecom (Largest Share):
IT & Telecom accounted for around 24.48% of the IaaS & PaaS Market in 2025 attributed to a wide adoption of cloud infrastructure to provide software, virtualize networks, host applications, and manage digital services. Cloud platforms, automation solutions based on artificial intelligence technology, and edge infrastructure are being deployed by telecom operators and IT firms to cater to increasing traffic and communication requirements. Increasing implementation of 5G networks, hyperscale cloud infrastructure, and enterprise applications based on artificial intelligence technology is set to boost the market segment going ahead.
Healthcare (Fastest Growing):
The Healthcare segment is expected to be the fastest-growing segment during the forecast period driven by increasing adoption of electronic health records, telemedicine applications, artificial intelligence-based diagnostics solutions, and cloud-enabled healthcare platforms. Cloud platforms are being increasingly adopted by healthcare providers for better patient information management, medical image storage and management, analytical processing, and enhanced healthcare delivery. Increasing investment in healthcare infrastructure, artificial intelligence-based healthcare solutions, and cloud solutions from 2025 to 2026 will further bolster cloud adoption in the healthcare industry.
IaaS & PaaS Market Regional Analysis:
|
Region |
Major Country |
Share within Region (%) |
|---|---|---|
|
North America |
United States |
81% |
|
Europe |
Germany |
28% |
|
Asia Pacific |
Australia |
46% |
|
Middle East & Africa |
South Africa |
34% |
|
Latin America |
Brazil |
53% |
North America IaaS & PaaS Market Insights:
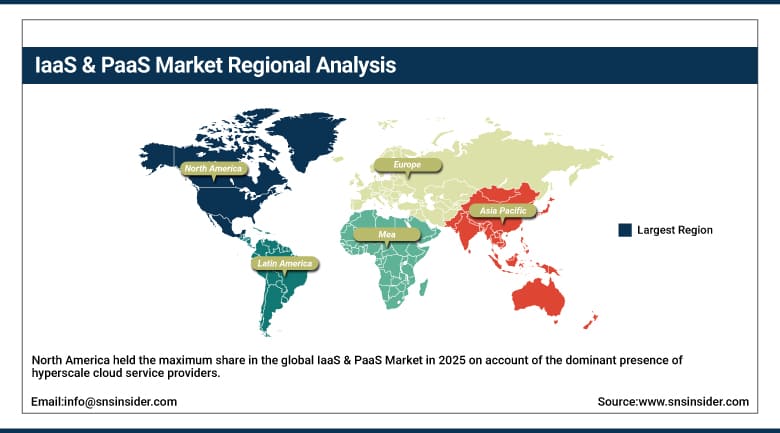
North America held the maximum share in the global IaaS & PaaS Market in 2025 on account of the dominant presence of hyperscale cloud service providers, AI infrastructure deployment, and widespread adoption of enterprise cloud services in the U.S. and Canada. In the North American region, the United States was the key market for IaaS & PaaS due to substantial investments by leading players like Amazon Web Services (AWS), Microsoft Azure, Google Cloud, IBM, and Oracle. High expansion in AI data centers, cloud native applications, security infrastructure, and digitalization strategies within enterprises is fueling growth in the market. Growing adoption of generative AI platforms, high-performance computing, and hybrid clouds will further solidify the leadership position in North America over the forecast period. Investments by governments in the digital transformation of the infrastructure and AI computing via semiconductors will help drive growth in cloud market in North America.
Get Customized Report as Per Your Business Requirement - Enquiry Now
Europe IaaS & PaaS Market Insights:
Europe holds a prominent place in the worldwide IaaS & PaaS market due to the growing adoption of cloud computing within enterprises, the robust implementation of digitization programs within industries, and the rising development of cloud infrastructures in Germany, France, the United Kingdom, Italy, and the Netherlands. The growing demand for AI-powered business software solutions, Industry 4.0 technologies, and cloud-based enterprise resource management systems is driving market expansion within the region. Germany remains the leading country in the European IaaS & PaaS market due to the thriving industrial automation landscape, growing data centers, and rising investments in AI computing technologies.
Asia Pacific IaaS & PaaS Market Insights:
It is projected that the Asia Pacific region will experience the fastest growth rate in the global IaaS & PaaS market attributed to high digital transformation rates, growing internet penetration, and increasing investments in cloud technology infrastructure in China, India, Japan, South Korea, and Southeast Asian nations. China will dominate the regional market owing to extensive investments in hyperscale data centers, artificial intelligence computing platforms, and enterprise-level cloud technology solutions. India is becoming one of the fastest-growing markets with strong backing from enterprises opting for cloud adoption, rapid growth in the startup ecosystem, and digitalization efforts driven by the government. The increase in the deployment of 5G network technology, Internet of Things ecosystems, artificial intelligence-based applications, and edge computing platforms is boosting demand for scalable cloud technology solutions across the region.
Middle East & Africa IaaS & PaaS Market Insights:
In the case of the Middle East & Africa IaaS & PaaS Market, gradual growth can be observed because of the increase in the level of investment being made in various smart cities, digital transformations, and cloud computing expansion in countries such as UAE, Saudi Arabia, and South Africa. Increasing use of cloud computing technology in relation to artificial intelligence, cyber security, digital banking, healthcare management, and industrial automation systems can be seen among the enterprises in the region. UAE and Saudi Arabia still constitute important markets on account of investment in hyperscale data centers and AI-infrastructure projects.
Latin America IaaS & PaaS Market Insights:
Latin America is poised to become one of the developing markets for IaaS & PaaS services because of the growing acceptance of cloud services by enterprises, the rapid development of the infrastructure in digital banking, and investments in telecommunication and e-commerce platforms in countries such as Brazil, Mexico, Argentina, and Chile. Brazil continues to be the leading country in the region because of high demand for cloud computing services, digital transformation initiatives by enterprises, and investments in data center services. The trend of using hybrid clouds and AI-powered enterprise services has gained momentum in Mexico due to nearshoring activities.
IaaS & PaaS Market Growth Drivers:
-
Rising enterprise cloud adoption, AI infrastructure expansion, and digital transformation initiatives are major factors driving growth of the global IaaS & PaaS Market
The growing need for scalable computing capabilities, cloud-native applications, data analysis, cybersecurity products, and AI-based enterprise platforms is driving the adoption of cloud infrastructure and platforms. IaaS and PaaS are widely adopted in the financial sector, healthcare industry, retail business, manufacturing operations, telecommunications domain, and governmental agencies owing to the potential to offer flexible, economical, and high-performing computing architectures. The substantial rise in the deployment of hyperscale data centers, generative AI frameworks, edge computing technologies, and 5G-based cloud ecosystems in North America, Europe, and Asia Pacific over the forecast period of 2025 and 2026 will augment the market growth.
IaaS & PaaS Market Restraints:
-
High infrastructure costs, cybersecurity concerns, and data sovereignty regulations are limiting market expansion globally
The deployment and management of such cloud infrastructure call for huge investments into data centers, networks, AI acceleration technology, and security infrastructure. Moreover, worries about data protection, compliance issues, cyber-attacks, and vendor lock-in are also growing, posing additional obstacles for businesses implementing such cloud infrastructure on a large scale. There is also the variability in legislation regarding data localization worldwide.
IaaS & PaaS Market Opportunities:
-
Generative AI platforms, hybrid cloud environments, and edge computing technologies are creating substantial future growth opportunities within the IaaS & PaaS Market
Faster adoption of AI-based application, machine learning, real-time analytics, and IoT-based solutions is driving the need for scalable cloud infrastructure and development platforms. Increased spending on sovereign cloud, cloud infrastructure for AI model training, cloud automation, and industry-specific cloud solutions is enabling more innovations across the industry. Moreover, rising adoption of multi-cloud management platforms, Kubernetes platform, and serverless computing is creating new growth avenues for the cloud services providers.
Recent Developments:
-
2026: Microsoft expanded its AI-focused cloud infrastructure investments across North America and Europe to support rising enterprise demand for generative AI computing, hyperscale data center services, and advanced cloud-based analytics platforms.
-
2025: Amazon Web Services (AWS) announced expansion of its global cloud infrastructure and AI services portfolio, including new data center regions and enhanced AI model deployment capabilities to address growing enterprise cloud adoption across Asia Pacific and Europe.
IaaS & PaaS Key Players:
-
Amazon Web Services (AWS)
-
Microsoft Corporation
-
Google Cloud
-
IBM Corporation
-
Oracle Corporation
-
Alibaba Cloud
-
Salesforce, Inc.
-
SAP SE
-
VMware, Inc.
-
Cisco Systems, Inc.
-
Tencent Cloud
-
Huawei Cloud
-
Rackspace Technology
-
DigitalOcean Holdings, Inc.
-
OVHcloud
-
Fujitsu Limited
-
NEC Corporation
-
Red Hat, Inc.
-
ServiceNow, Inc.
-
Equinix, Inc.
IaaS & PaaS Market Report Scope:
| Report Attributes | Details |
|---|---|
| Market Size in 2025 | USD 101.64 Billion |
| Market Size by 2035 | USD 318.86 Billion |
| CAGR | CAGR of 12.12% From 2026 to 2035 |
| Base Year | 2025 |
| Forecast Period | 2026-2035 |
| Historical Data | 2022-2024 |
| Report Scope & Coverage | Market Size, Segments Analysis, Competitive Landscape, Regional Analysis, DROC & SWOT Analysis, Forecast Outlook |
| Key Segments | • By Service Type (Infrastructure as a Service, Platform as a Service) • By Deployment Model (Public Cloud, Private Cloud, Hybrid Cloud) • By Enterprise Size (Small and Medium Enterprises, Large Enterprises) • By Industry Vertical (BFSI, Healthcare, Retail, IT and Telecommunications, Manufacturing, Government, Others) |
| Regional Analysis/Coverage | North America (US, Canada), Europe (Germany, UK, France, Italy, Spain, Russia, Poland, Rest of Europe), Asia Pacific (China, India, Japan, South Korea, Australia, ASEAN Countries, Rest of Asia Pacific), Middle East & Africa (UAE, Saudi Arabia, Qatar, South Africa, Rest of Middle East & Africa), Latin America (Brazil, Argentina, Mexico, Colombia, Rest of Latin America). |
| Company Profiles | Amazon Web Services (AWS), Microsoft Corporation, Google Cloud, IBM Corporation, Oracle Corporation, Alibaba Cloud, Salesforce, Inc., SAP SE, VMware, Inc., Cisco Systems, Inc., Tencent Cloud, Huawei Cloud, Rackspace Technology, DigitalOcean Holdings, Inc., OVHcloud, Fujitsu Limited, NEC Corporation, Red Hat, Inc., ServiceNow, Inc., Equinix, Inc. |
Frequently Asked Questions
Ans: The IaaS & PaaS Market is expected to grow at a CAGR of 12.12% from 2026 to 2035.
Ans: The IaaS & PaaS Market was valued at USD 101.64 billion in 2025.
Ans: IaaS dominates with over 62% market share.
Ans: Hybrid cloud is growing fastest, as businesses balance control with flexibility.
Ans: North America anchors the IaaS and PaaS market due to high enterprise investments in cloud, broad uptake of infrastructure services, and proximity to established providers such as AWS, Azure, and Google Cloud.
Get in Touch
