Erythropoietin Stimulating Agents (ESA) Market Report Scope & Overview:
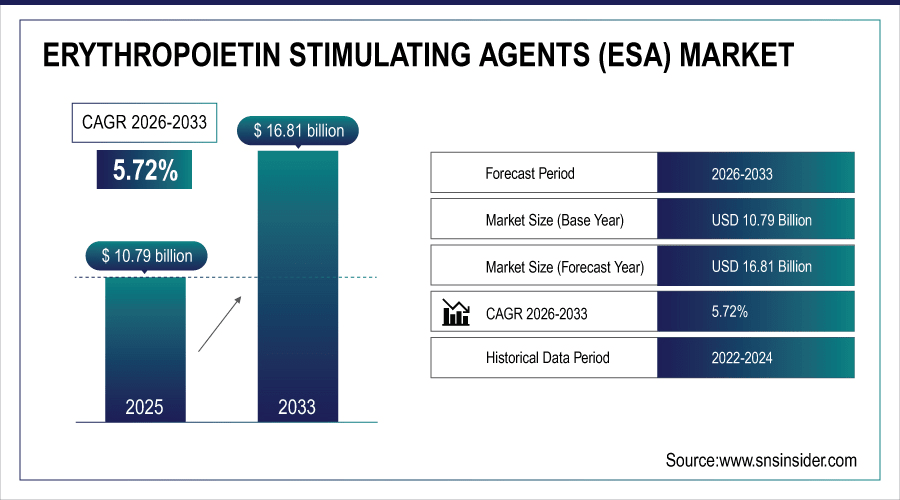
The global erythropoietin stimulating agents (ESA) market is estimated to be valued at USD 10.79 billion in 2025 and is projected to reach USD 16.81 billion by 2033, growing at a CAGR of 5.72% during the forecast period 2026–2033.
Erythropoietin Stimulating Agents (ESAs) continue to be important for the treatment of anemia in chronic kidney disease and oncology for more than two decades. More than 12 million ESA treatments were conducted globally in 2025 with nearly 65% being CKD patients. Epoetin alfa and biosimilars make up 58% of the market value. Increasing incidence of renal diseases, chemotherapy-induced anemia and increasing use of biosimilars continue to propel growth on regular basis; hospitals & specialty clinics are key end- users globally.
Biosimilar ESAs accounted for 22% of total prescriptions in 2025, reflecting the shift toward cost-effective alternatives.
To Get More Information On Erythropoietin Stimulating Agents (ESA) Market - Request Free Sample Report
Market Size and Forecast:
-
Market Size in 2025: USD 10.79 Billion
-
Market Size by 2033: USD 16.81 Billion
-
CAGR: 5.72% from 2026 to 2033
-
Base Year: 2025
-
Forecast Period: 2026–2033
-
Historical Data: 2022–2024
Erythropoietin Stimulating Agent (ESAs) Market Trends:
-
There will be over 10 million ESA prescriptions by 2025 worldwide with chronic kidney disease accounting for more than 60% of total requirement.
-
4 million ESA treatments are performed each year in the U.S., and oncology- associated anemia accounts for some 30% of the need.
-
Europe led by Germany and the U.K. delivers around 2.8 million ESA treatments annually, underpinned by robust backing of biosimilars.
-
Subcutaneous injections make up 57% of ESA utilization and indicate a preference for outpatient and home care.
-
Large hospitals and specialized nephrology clinics dispense more than 70% of total ESA sales volume globally, underscoring their significant influence on patient treatment.
U.S. Erythropoietin Stimulating Agent (ESAs) Insights:
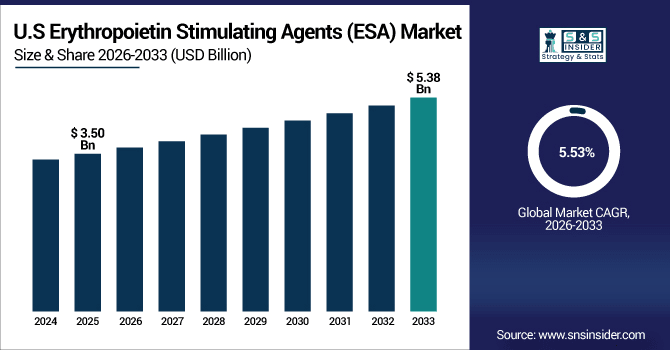
The U.S. Erythropoietin Stimulating Agents (ESA) Market is estimated to be valued at USD 3.50 billion in 2025, projected to reach USD 5.38 billion by 2033 at a CAGR of 5.53%. In 2025, more than 3.6 million prescriptions were delivered as they increased from chronic kidney disease (CKD), chemotherapy-induced anemia, biosimilars uptake and growth in home-care and outpatient settings.
Erythropoietin Stimulating Agent (ESAs) Market Growth Drivers:
-
Increasing Chronic Kidney Disease Prevalence and Chemotherapy-Induced Anemia Fuel Rising Demand for Erythropoietin Stimulating Agents.
Rising prevalence of chronic kidney disease and chemotherapy induced anemia are the notable growth contributors to Erythropoietin Stimulating Agents (ESA) market. Worldwide, over 10 million ESA scripts were reporting in 2025, and more than 60% indicated use by CKD patients. ESAs of biosimilar manufacture are gaining popularity (22% of all prescriptions), which increases cost-effectiveness and access. It is hospitals and specialty clinics that continue to be the leading dispensers and growth drivers of ESA market worldwide.
Chemotherapy-induced anemia represented nearly 28% of global ESA demand, reflecting oncology’s growing contribution to market expansion.
Erythropoietin Stimulating Agent (ESAs) Market Restraints:
-
Safety Concerns, Cardiovascular Risks, and Strict Regulatory Guidelines Limit Broader Adoption of Erythropoietin Stimulating Agents.
Issues related to safety and strict monitoring by regulatory agencies remain challenges for the expanded use of ESAs in patients at high risk. By 2025, studies found that some 18% of ESA-treated patients suffered heart problems prompting stricter U.S. and EU prescribing rules. Regulatory monitoring is more stringent which increases treatment costs and causes it not to become routine within smaller clinics. Use is discouraged in cancer, and dosing restrictions are imposed. Such safety and regulation requirements interfere with rapid penetration of the growing market for ESA throughout the world.
Erythropoietin Stimulating Agent (ESAs) Market Opportunities:
-
Increasing Home-Based ESA Administration and Self-Injection Programs Enhance Patient Access and Drive Market Growth Potential.
The increased use of home conveyed administration of ESA and self-injection programs is increasing access and making life easier for our patients. Over 3.5 million ESA doses were administered in non-hospital settings worldwide in 2025, or around 30% of global use. This is expected to rise to over 6 million doses annually by 2033, driven by training and device development. Increased involvement of specialty clinics and home care demonstrates a favorable future for ESA availability and sustained market expansion.
Self-injection programs are forecast to grow at over 7% annually, improving patient adherence and expanding ESA accessibility worldwide.
Erythropoietin Stimulating Agent (ESAs) Market Segmentation Analysis:
-
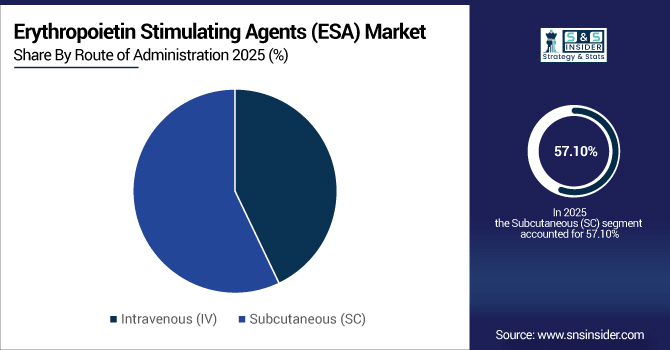
By Route of Administration, Subcutaneous (SC) accounted for the largest market share of 57.10% in 2025, and is also projected to grow at the fastest CAGR of 6.15%.
-
By Product Type, Epoetin Alfa held the largest market share of 38.45% in 2025, while Biosimilars are expected to grow at the highest CAGR of 9.25%.
-
By Indication, Chronic Kidney Disease contributed the highest market share of 64.00% in 2025, while Chemotherapy-Induced Anemia is forecasted to expand at the fastest CAGR of 7.10%.
-
By End User, Hospitals held the largest share of 70.25% in 2025, while Ambulatory Care Centers are anticipated to grow at the fastest CAGR of 8.10%.
By Route of Administration, Subcutaneous (SC) Remains Preferred:
Subcutaneous injections were the leading ESA route of administration, with more than 6.1 million doses administered worldwide in 2025, which was preferred for home-care, outpatient and self-administration settings. Another 4.6 million doses were administered intravenously, mostly in hospital dialysis and oncology units. Momentum is building supporting SC delivery with the trend to eclipse 9.5 million doses by 2033, fuelled by patient time-savings, reduced clinic visits and proliferation of home-based care across the globe.
By Product Type, Epoetin Alfa Leads While Biosimilars Expand Rapidly:
Epoetin Alfa was the leading product in terms of ESAs prescriptions above 4.1 million treatments worldwide in 2025 for CKD. Biosimilars are on track to grow faster, 2.4 million scripts in 2025, likely to surpass 4.6 million in 2033 as regulations and savings extend their reach. The two reporting DA and C.E.R.A products, Darbepoetin Alfa and Methoxy PEG-Epoetin Beta represented 2.3 million and 0.6 million prescription fills (respectively), underscoring the varied product portfolio sustaining global ESA therapy.
By Indication, CKD Drives Demand While Oncology Anemia Rises:
Chronic Kidney Disease continued to be the largest indicator of ESAs use with 7.7 million treated patients in 2025 worldwide. Chemotherapy-induced anemia resulted in 3.4 million treatments, and is growing rapidly as a consequence of increasing cancer diagnoses and treatment-related anemia control. With annual ESA oncology treatment projected to surpass 4 million by 2033, the growing application of ESAs beyond renal care and the requirement for anemia management in numerous therapeutic arenas are well documented.
By End User, Hospitals Dominate While Ambulatory Centers Expand:
Hospitals delivered more than 7.5 million ESA doses in 2025, with access to monitoring and infrastructure for CKD and oncology patients. Specialty clinics provided around 1.1 million doses of targeted care, which is one on one patient to nurse care. Ambulatory Care Centers are currently growing and expected to reach over 2.4 million doses in 2033 due to the shift toward outpatient, decentralized administration of ESAs facilitated by home care programs and self-injection promotion (1.3 million doses by 2025).
Erythropoietin Stimulating Agent (ESAs) Market Regional Analysis:
North America Erythropoietin Stimulating Agent (ESAs) Market Insights:
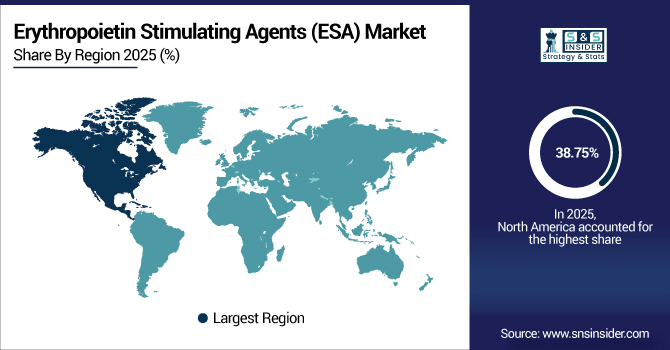
North America leads the Erythropoietin Stimulating Agents (ESA) market with a 38.75% share in 2025, supported by advanced healthcare infrastructure and high prevalence of chronic kidney disease and cancer-related anemia. More than 4.2 million ESA doses were administered in the region's hospitals and specialty clinics in 2025. Growing uptake of biosimilars, growth in outpatient and home-care programs, and ongoing investments in renal and oncology care are supporting continued ESA sales through 2033.
Get Customized Report as Per Your Business Requirement - Enquiry Now
U.S. Erythropoietin Stimulating Agent (ESAs) Market Insights:
In 2025, more than 3,600 U.S. hospitals, specialty clinics and outpatient centers provided ESA treatments, mainly for chronic kidney disease and chemotherapy-induced anemia. Growing biosimilar utilization; growth in home-care and self-injection arrangements; and growing healthcare expenditure are the major drivers of U.S. Erythropoietin Stimulating Agents (ESA) market, making treatments increasingly accessible across a wider patient population.
Asia-Pacific Erythropoietin Stimulating Agent (ESAs) Market Insights:
The Asia-Pacific Erythropoietin Stimulating Agents (ESA) market is projected to grow at a CAGR of 6.69% during 2026–2033, emerging as the fastest-growing region globally. In 2025, more than 2.1 million ESA prescriptions were given at hospitals, specializing in clinics and outpatient outlets. Growth of the market is attributed to the rising prevalence of CKD and chemotherapy induced anemia, increasing adoption of biosimilars, raising awareness among people regarding anemia and increasing government funding for cancer research.in emerging countries in Asai Pacific region.
Japan Erythropoietin Stimulating Agent (ESAs) Market Insights:
Japan had the highest Erythropoietin Stimulating Agents (ESA) market share in Asia Pacific, with more than 800,000 prescriptions in 2025. High prevalence of chronic kidney disease, rise in number of oncology-treated patients’ adoption across the globe, and developed healthcare infrastructure is boosting the market growth. Increasing home care and outpatient ESA initiatives will also help drive market expansion.
Europe Erythropoietin Stimulating Agent (ESAs) Market Insights:
ESA were employed in over 3.2 million prescriptions in German, France and the UK hospitals and specialist clinics combined in 2025. Market Drivers: High prevalence of chronic kidney disease and chemotherapy-induced anemia Increasing adoption of biosimilars Home-care and self-injection programs are growing Government healthcare policies, capital investment towards constructing renal and oncology care infrastructure along with highly developed treatment methodologies are driving the growth of Erythropoietin Stimulating Agents (ESA) market in Europe.
Germany Erythropoietin Stimulating Agent (ESAs) Market Insights:
Germany is the leading Erythropoietin Stimulating Agents (ESA) market in Europe and will grow to over 1.1 million prescriptions used in hospitals specialised units and outpatient facilities by 2025. Increased market development in Germany due to a high chronic kidney disease population, biosimilars uptake, home-care programmes, mature renal and oncology infrastructure and strong government healthcare encouragement makes the country Europe’s ESA leader.
Latin America Erythropoietin Stimulating Agent (ESAs) Market Insights:
The Latin America Erythropoietin Stimulating Agents (ESA) market is on pace to grow robustly due to increasing number of ESA Prescriptions in Brazil by 2025. Similary, trends in Mexico and Argentina due to increased prevalence of chronic kidney disease & Chemotherapy-Induced Anemia. growing healthcare infrastructure, rising biosimilar utilization and rise in ESA outpatient & homecare programs are key local expansion drivers.
Middle East and Africa Erythropoietin Stimulating Agent (ESAs) Market Insights:
The esoteric market of Middle East & Africa Erythropoietin Stimulating Agents (ESA) is increasing due to there being more than 220,000 doses prescribed in 2025. Adoption soars in Saudi Arabia and South Africa. Market growth is due to prevalence of CKD and chemotherapy-induced anemia, expanding healthcare infrastructure, availability of biosimilar and home care and outpatient ESAs programs.
Erythropoietin Stimulating Agent (ESAs) Market Competitive Landscape:
Amgen Inc. is a world leader in the Erythropoietin Stimulating Agents (ESA) market and its product Aranesp® (darbepoetin alfa) is indicated for anemia associated with chronic kidney disease and chemotherapy treatment. In 2025, over 2.5 million ESA prescriptions were given globally by the company. Backed by a robust R&D pipeline, hardworking staff and scientific visionaries, Amgen leads the industry in developing Erythropoiesis-stimulating agents (ESA) to deliver growth and increase access for patients across the globe.
-
In August 2025, Amgen highlighted increased patient reach through innovative ESA medicines and biosimilars, supporting long-term growth.
A Swiss-based multinational, F. Hoffmann-La Roche Ltd. is a major ESA producer. Its Mircera (methoxy polyethylene glycol-epoetin beta) is dosed less frequently, so patients can benefit from increased convenience. Roche delivered more than 1.8 million ESA prescriptions worldwide in 2025. The company's dedication to innovation, patient-focused solutions and pipeline of product lines are what supports the company’s competitive landscape, driving ongoing global leadership in the ESA market as it continues its international expansion.
-
In September 2025, Roche agreed to acquire biotech firm 89bio for $3.5 billion to expand its liver and cardiometabolic treatment pipeline.
Johnson & Johnson Services, Inc. has a major presence in the ESA market with Procrit (epoetin alfa) and EPOGEN (epoetin alfa). The company filled over 1.5 million ESA prescriptions globally in 2025. Summary Despite competition from biosimilars, J&J’s entrenched presence and robust portfolio with steady patient backing allow it to continue its dominance and keep on expanding in the global ESA space.
-
In 2025, Janssen updated Procrit prescribing information for CKD anemia patients not on dialysis to optimize treatment guidance.
Erythropoietin Stimulating Agent (ESAs) Market Key Players:
Some of the Erythropoietin Stimulating Agent (ESAs) Market Companies are:
-
Pfizer Inc.
-
Biocon Limited
-
Teva Pharmaceutical Industries Ltd.
-
Celltrion Healthcare Co., Ltd.
-
Sandoz International GmbH (Novartis)
-
Intas Pharmaceuticals Ltd.
-
Kyowa Kirin Co., Ltd.
-
LG Chem Ltd.
-
Sun Pharmaceutical Industries Ltd.
-
Dr. Reddy’s Laboratories Ltd.
-
3SBio Inc.
-
LG Life Sciences Ltd.
-
Hikma Pharmaceuticals PLC
-
Hospira Inc.
-
BioSidus S.A.
-
Ranbaxy Laboratories Ltd.
-
Celon Laboratories Pvt. Ltd.
| Report Attributes | Details |
|---|---|
| Market Size in 2025 | USD 10.79 Billion |
| Market Size by 2033 | USD 16.81 Billion |
| CAGR | CAGR of 5.72% From 2026 to 2033 |
| Base Year | 2025 |
| Forecast Period | 2026-2033 |
| Historical Data | 2022-2024 |
| Report Scope & Coverage | Market Size, Segments Analysis, Competitive Landscape, Regional Analysis, DROC & SWOT Analysis, Forecast Outlook |
| Key Segments | • By Product Type (Epoetin Alfa, Epoetin Beta, Darbepoetin Alfa, Methoxy Polyethylene Glycol-Epoetin Beta, Biosimilars, Others) • By Route of Administration (Intravenous, Subcutaneous) • By Indication (Chronic Kidney Disease, Chemotherapy-Induced Anemia, Other Indications) • By End User (Hospitals, Specialty Clinics, Ambulatory Care Centers, Research & Academic Institutes, Others) |
| Regional Analysis/Coverage | North America (US, Canada), Europe (Germany, UK, France, Italy, Spain, Russia, Poland, Rest of Europe), Asia Pacific (China, India, Japan, South Korea, Australia, ASEAN Countries, Rest of Asia Pacific), Middle East & Africa (UAE, Saudi Arabia, Qatar, South Africa, Rest of Middle East & Africa), Latin America (Brazil, Argentina, Mexico, Colombia, Rest of Latin America). |
| Company Profiles | Amgen Inc., F. Hoffmann-La Roche Ltd., Johnson & Johnson Services, Inc., Pfizer Inc., Biocon Limited, Teva Pharmaceutical Industries Ltd., Celltrion Healthcare Co., Ltd., Sandoz International GmbH (Novartis), Intas Pharmaceuticals Ltd., Kyowa Kirin Co., Ltd., LG Chem Ltd., Sun Pharmaceutical Industries Ltd., Dr. Reddy’s Laboratories Ltd., 3SBio Inc., LG Life Sciences Ltd., Hikma Pharmaceuticals PLC, Hospira Inc., BioSidus S.A., Ranbaxy Laboratories Ltd., Celon Laboratories Pvt. Ltd. |
Frequently Asked Questions
North America, holding 38.75% market share, supported by advanced healthcare infrastructure, high CKD and oncology prevalence, and growing outpatient and home-care ESA programs.
Asia-Pacific, with a CAGR of 6.69%, driven by increasing CKD and oncology-related anemia prevalence, biosimilar adoption, and healthcare infrastructure expansion.
Rising prevalence of chronic kidney disease and chemotherapy-induced anemia, expanding biosimilar adoption, and growth of home-care and outpatient ESA programs.
The market was valued at USD 10.79 billion in 2025E and is expected to reach USD 16.81 billion by 2033.
The global ESA market is projected to grow at a CAGR of 5.72% from 2026 to 2033.
Get in Touch
