Expandable Graphite Market Report Scope & Overview:
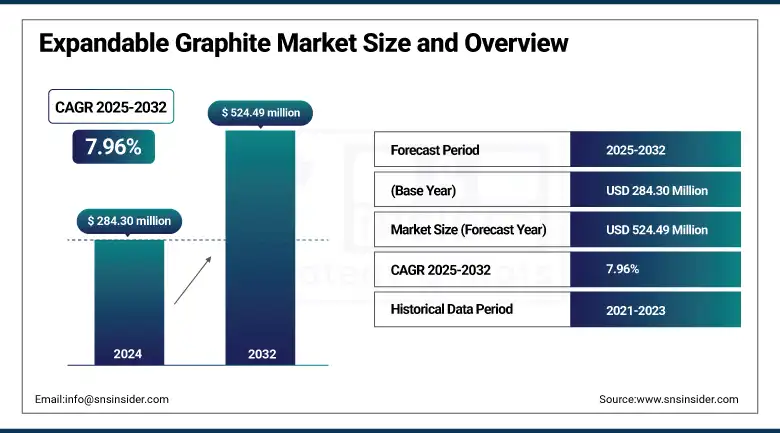
The Expandable Graphite Market size was valued at USD 284.30 million in 2024 and is expected to reach USD 524.49 million by 2032, growing at a CAGR of 7.96% over the forecast period of 2025-2032.
The growth of the expandable graphite industry is attributed to the stringent fire-safety norms, which further increase the demand for flame-retardant graphite and fire-resistant graphite materials for use in electric vehicles, driving the growth of expandable graphite use for batteries and high-temperature graphite applications. Technological innovations in graphite intercalation compounds are gaining ground for expanded graphite flakes, influencing the expandable graphite market trends and expandable graphite market size. Major expandable graphite producers, such as NOVONIX, meanwhile, grew their synthetic anode capacity, underpinning market stability.
U.S. natural graphite imports accounted for 84,000 tons in 2023, 89.3% of which was flake and high-purity graphite, resulting in key sizes of the expandable graphite market. In 2022, the Vidalia project received a 220-million-dollar federal grant, targeting a capacity of 45,000 t/yr and thus increasing its share in the expandable graphite market. The company also kept supply relatively steady through new export restrictions in China, further supporting its analysis of the expandable graphite market.
Expandable Graphite Market Size and Forecast:
-
Market Size in 2024: USD 284.30 Million
-
Market Size by 2032: USD 524.49 Million
-
CAGR: 7.96% from 2025 to 2032
-
Base Year: 2024
-
Forecast Period: 2025–2032
-
Historical Data: 2022–2024
To Get more information On Expandable Graphite Market - Request Free Sample Report
Expandable Graphite Market Trends:
-
Rising demand for flame-retardant and fire-resistant graphite materials driven by stringent fire-safety regulations
-
Expanding EV battery supply chains increasing adoption of expandable graphite for batteries and high-temperature applications
-
Growing diversification of graphite supply chains amid tightening Chinese export controls
-
Increasing investments in domestic synthetic graphite production capacity
-
Technological advancements in graphite intercalation compounds and expanded graphite flakes
-
Strong growth in conductive additives for electric vehicles and advanced energy storage systems
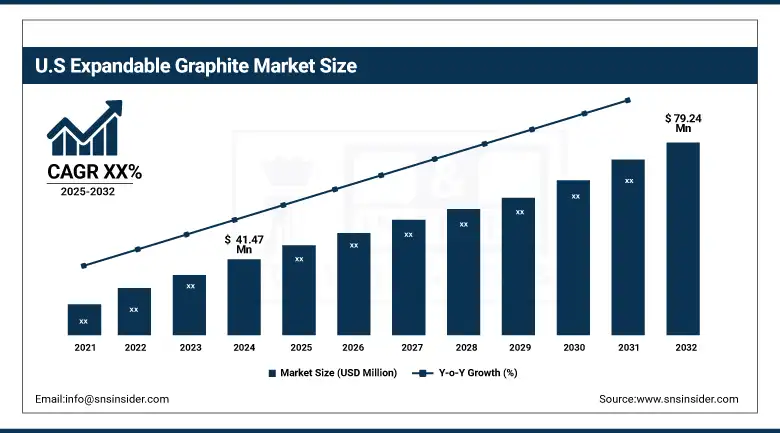
The U.S dominates the North America expandable graphite market with a market size valued at USD 41.47 million and is projected to reach a value of USD 79.24 million by 2032 with a market share of around 71%, supported by strategic federal funding and domestic capacity expansion. New synthetic graphite facilities are popping up, raising the supply of expandable graphite for batteries and fire-retardant graphite material. Other projects have increased the proven reserves to provide a secure supply of expanded graphite flakes for electric vehicle and energy storage markets. This national commitment to the independence of battery materials and advanced manufacturing also enables the U.S. to capture the largest share of the market and lead the way for expandable graphite market demand and sustainable growth in essential economic sectors.
Expandable Graphite Market Drivers:
-
Expansion of EV battery supply chains accelerates expandable graphite for batteries adoption
Growth in global production of electric vehicles is driving demand for high-temperature holdup graphite and expandable graphite for batteries, due to the rise of lithium-ion anodes and thermal cooling systems. In 2023, U.S. imports of natural graphite, predominantly flake and high-purity grades essential for battery uses, amounted to 84,000 tons, the US Geological Survey says. This trend and also, and also because of domestic projects such as the Vidalia plant, is helping to drive growth in the expandable graphite market, to increase their share of the expandable graphite market in advanced energy storage systems.
-
Tightening Chinese export controls spur supply diversification among expandable graphite companies
New export licensing in December 2023 from China for graphite intercalation compounds saw the leading companies of expandable graphite diversify their source of supply to geographic regions such as Africa and North America. This is helpful to stable supply of flame-retardant graphite and fireproof graphite material. Key companies such as SGL Carbon were the leading manufacturers to ensure continuation despite the limitations, shaping the trends of the expandable graphite market and maintaining the size of the expandable graphite market against geopolitical challenges thus boosting the steady expansion of the market.
Expandable Graphite Market Restraints:
-
Scale-up timelines for new expandable graphite projects delay the supply response, hindering market growth
New projects, even the ones that do get federal support, frequently take a long time to permit and build out to a commercial scale. Even with major reserve expansions, such as at Graphite Creek, the output could be years off. The above-mentioned delays delay immediate growth in fire-resistant graphite material supply, influencing expandable graphite market growth, and means that the demand of the current expandable graphite market share is below a demand level that should have existed. The disparity between the planned capacity and actual production is a common short-term limiting factor for the world market.
Expandable Graphite Market Segmentation Analysis:
By Type
Natural dominated the expandable graphite market in 2024 with a market share of 65.40% as they are used extensively in flame retardant graphite and expanded graphite flake in the construction industry. Natural Flake Graphite was imported by the US in 2023 as high-purity, flake graphite, cumulatively used in insulation and industrial sealing, drew strong demand, the US Geological Survey reported. Increasing investment in home flake processing has also given natural graphite a firmer lead in the market share of expandable graphite.
Synthetic is the fastest-growing segment in the expandable graphite market through 2032 with a CAGR of 8.12%, owing to the increasing demand for expandable graphite for batteries and high-temperature graphite for electric vehicles. NOVONIX increased the synthetic anode capacity to sustain the North American supply(NOVONIX). This long-term strategy is in line with a national push to decrease dependence upon imported graphite and having synthetic graphite’s position, and stimulating expandable graphite market growth and robustness for high-end applications.
By Application
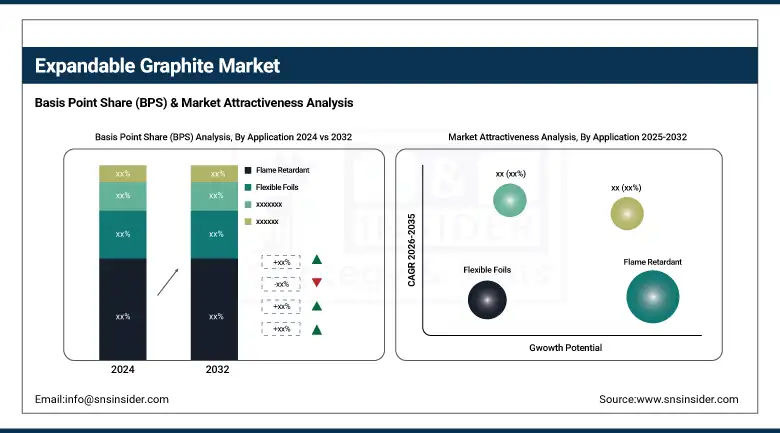
Flame retardant dominated the expandable graphite market in 2024, with a market share of 55.30% as regulatory pressure increased the utilization of the fire-resistant graphite material in panels and insulation. The European Chemicals Agency imposed stricter regulations on halogenated flame retardants, driving industries to consider graphite intercalation compound solutions. This transition had an immediate positive impact on increasing the requirement for expandable graphite flakes, strengthening the leadership of the segment in the expandable graphite market size from the applications in the construction and electronic industries.
Conductive additives are the fastest growing segment through 2032 with the highest CAGR of 8.56%, owing to their application in the EV thermal systems and development in advanced energy storage. In Louisiana, the Vidalia project had $220 million in federal grants to scale up synthetic graphite production, important for conductive applications. This growth sustains the increasing acceptance of conductive additives that bolster their increasing share in the expandable graphite market, size, and these compounds are proliferating in the market as industries continue to invest in the next generation of battery technologies.
By End-use Industry
Building & construction dominated the expandable graphite market in 2024 with a market share of 42.10% on account of growing applications of flame retardant graphite and expanded graphite flakes in fireproof insulation. The NFPA updated requirements on codes to comply with fire safety, and that was the direct application in commercial and residential projects. This further consolidated the position of building & construction in the hot graphite trends and evolved the demand for sustainable fire retardant materials.
Electronics & energy storage is the fastest growing segment through 2032 with a CAGR of 8.54%, supported by growing demand for expandable graphite for use in batteries and high-temperature graphite in electric vehicles and grid storage. Graphite One tripled its proven and probable reserves at its Graphite Creek project that supplies battery makers. This growth enhances electronics & energy storage’s role in expanding the expandable graphite market and in facilitating the shift to renewable energy solutions.
By Sales Channel
Direct sales dominated the expandable graphite market in 2024, with a market share of 75.60% as large industrial customers contracted directly with expandable graphite companies to ensure supply. The SGL Carbon also succeeded in concluding direct long-term agreements in the face of new export licensing obligations in China, which also had an equalizing effect on sales channels. The market share of expandable graphite witnessed strong growth from the prevalence of direct sales that enabled the reliable supply of flame retardant graphite and expanded graphite flakes to major manufacturing end-user industries.
Online retail is the fastest-growing sales channel through 2032, with the highest CAGR of 8.86%, as a result of growth in the number of digital forums that provide end-users with access to niche graphite intercalation compounds and higher temperature graphite products. Flexible procurement is good for small and medium-sized manufacturers, aiding the current expandable graphite market trends. This digital move mirrors the wider adoption across the industry for e-commerce, allowing diversification of market approach and facilitating growth in the expandable graphite market beyond reliance on the traditional B2B supply approach.
Expandable Graphite Market Regional Outlook
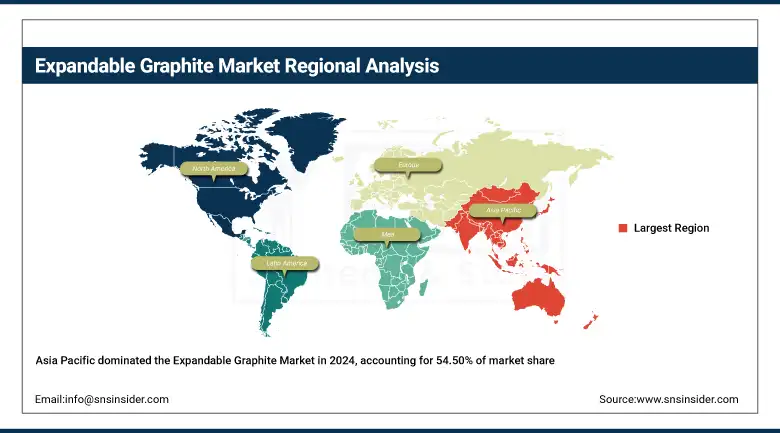
Asia Pacific dominates the expandable graphite market in 2024, capturing 54.50% market share due to a high pace of industrialization and growing electronics production in China, Japan, and South Korea. Growing graphite flakes consumption in flame retardants and conductive additives is driven by China, the leading graphite-producing and exporting nation. Japan is progressing high-temperature graphite technologies in the automotive and aerospace industries, thereby driving the market. Moreover, government incentives for battery material innovation in these nations add to the rise of the Asia Pacific expandable graphite market growth and market share dominance.
Get Customized Report as per Your Business Requirement - Enquiry Now
North America is the fastest-growing region in the expandable graphite market from 2025 to 2032, with the highest CAGR of 8.48%, as demand for expandable graphite to make batteries and high-temperature graphite in electric vehicles and clean energy, such as automotive and solar power plants, is growing at the highest CAGR of 8.48%. Such projects are supported by higher government subsidies in the region and local mining projects to reduce dependence on imported graphite. Canada is in the process of gradually growing natural flake graphite production to enlarge its domestic supply. Consumer preferences for direct business relationships with North American producers also continue to aid consistent demand for flame retardant graphite and solidify regional expandable graphite demand growth.
Key Players:
The major expandable graphite market competitors include SGL Carbon, NeoGraf Solutions, GrafTech International Ltd., Nacional de Grafite, Asbury Carbons, GRAPHIT KROPFMÜHL GMBH (AMG Mining AG), GEORG H. LUH GMBH, Yichang Xincheng Graphite Co., Ltd., Shijiazhuang ADT Carbonic Material Factory, Qingdao Jinhui Graphite Co., Ltd., Qingdao Black Dragon Graphite Group, Qingdao Braide Graphite Co., Ltd., Nippon Kokuen Group, JAMES DURRANS GROUP (Durrans Group), HP Materials Solutions, Inc (HPMS), PranaGraf Materials & Technologies Private Limited, Qingdao YanXin Graphite Products Co., LTD., Northern Graphite, Xuzhou Jinxing Graphite Material Co., Ltd., and NeoGraf.
Recent Developments:
-
In February 2025, Sovereign Metals confirmed kasíya graphite’s suitability for expandable and expanded graphite applications, supporting its use in flame retardant graphite and batteries, and strengthening plans to supply high-purity graphite.
-
In February 2025, Evion Group raised $1.33 million to boost Panthera JV’s expandable graphite production, aiming to meet rising demand for high-temperature graphite and fire-resistant graphite material in key industries.
| Report Attributes | Details |
|---|---|
| Market Size in 2024 | USD 284.30 million |
| Market Size by 2032 | USD 524.49 million |
| CAGR | CAGR of 7.96% From 2025 to 2032 |
| Base Year | 2024 |
| Forecast Period | 2025-2032 |
| Historical Data | 2021-2023 |
| Report Scope & Coverage | Market Size, Segments Analysis, Competitive Landscape, Regional Analysis, DROC & SWOT Analysis, Forecast Outlook |
| Key Segments | •By Type (Natural, Synthetic) •By Form (Powder, Flakes) •By Application (Flame Retardant, Flexible Foils, Conductive Additives, Others) •By End-use Industry (Electronics & Energy Storage, Automotive, Building & Construction, Industrial Manufacturing, Aerospace & Defence, Others) •By Sales Channel (Direct Sales, Distributors & Traders, Online Retail) |
| Regional Analysis/Coverage | North America (US, Canada, Mexico), Europe (Germany, France, UK, Italy, Spain, Poland, Turkey, Rest of Europe), Asia Pacific (China, India, Japan, South Korea, Singapore, Australia, Rest of Asia Pacific), Middle East & Africa (UAE, Saudi Arabia, Qatar, South Africa, Rest of Middle East & Africa), Latin America (Brazil, Argentina, Rest of Latin America) |
| Company Profiles | SGL Carbon, NeoGraf Solutions, GrafTech International Ltd., Nacional de Grafite, Asbury Carbons, GRAPHIT KROPFMÜHL GMBH (AMG Mining AG), GEORG H. LUH GMBH, Yichang Xincheng Graphite Co., Ltd., Shijiazhuang ADT Carbonic Material Factory, Qingdao Jinhui Graphite Co., Ltd., Qingdao Black Dragon Graphite Group, Qingdao Braide Graphite Co., Ltd., Nippon Kokuen Group, JAMES DURRANS GROUP (Durrans Group), HP Materials Solutions, Inc (HPMS), PranaGraf Materials & Technologies Private Limited, Qingdao YanXin Graphite Products Co., LTD., Northern Graphite, Xuzhou Jinxing Graphite Material Co., Ltd., and NeoGraf |
Frequently Asked Questions
Asia Pacific dominates with 54.50% share, while North America is the fastest growing region, supported by local mining, EV demand, and federal funding.
The market mainly includes natural expandable graphite for insulation and synthetic graphite for batteries and high-temperature applications like EV thermal management.
Building & construction dominates due to fireproof insulation demand, while electronics and energy storage grow fastest from battery and high-temperature graphite applications.
Growth is driven by EV battery supply chain expansion, strict fire-safety regulations boosting flame-retardant graphite, and diversification from Chinese export controls.
The expandable graphite market size was valued at USD 284.30 million in 2024 and is projected to reach USD 524.49 million by 2032.
Get in Touch
