Synthetic Fuels Market Report Scope & Overview:
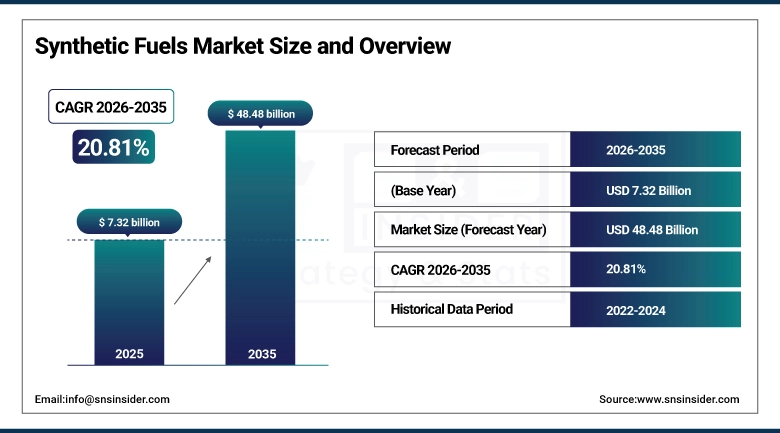
The Synthetic Fuels Market was valued at USD 7.32 billion in 2025 and is expected to reach USD 48.48 billion by 2035, growing at a CAGR of 20.81% from 2026-2035.
The increase in growth in the synthetic fuels market is driven by innovations in greener hydrogen generation methods, carbon capture and utilization processes, as well as the regulatory environment supportive of such advancements. An example of companies involved in the production of such fuels in an eco-friendly manner is Synhelion and its solar fuel manufacturing facility in Germany, along with Comstock Fuels producing Bioleum fuels. There is an increasing number of companies in the renewable synthetic fuel market, as seen from the SAF Grand Challenge initiated by the U.S. Department of Energy for sustainable aviation fuels production with an output of 93 million gallons. The electrolyzer cost per MW has been reduced by 55% from 2020 to 2023, making PtL technologies more feasible and resulting in high investments for green fuel production capacity.
According to industry data, the Biomass-to-Liquid (BTL) segment is projected to dominate and grow at a CAGR of 22.23% due to escalating demand for renewable synthetic fuels — driven by increased EU funding under the Renewable Energy Directive, growing agricultural and forestry waste feedstock availability, and accelerating investment in BTL production capacity by companies including BTG Biomass Technology Group.
Synthetic Fuels Market Size and Forecast
-
Market Size in 2025: USD 7.32 Billion
-
Market Size by 2035: USD 48.48 Billion
-
CAGR: 20.81% from 2026 to 2035
-
Base Year: 2025
-
Forecast Period: 2026-2035
-
Historical Data: 2022-2024
To Get more information on Synthetic Fuels Market - Request Free Sample Report
Synthetic Fuels Market Trends
-
Rapid scaling of Power-to-Liquid (PtL) technology using renewable electricity for green hydrogen production combined with CO2 capture to synthesize carbon-neutral aviation fuel and marine fuel at increasing commercial scale.
-
Growing deployment of Fischer-Tropsch synthesis facilities using biomass, municipal solid waste, and industrial CO2 feedstocks to produce drop-in diesel, kerosene, and gasoline compatible with existing engines and fuel infrastructure.
-
Increasing adoption of Sustainable Aviation Fuel (SAF) from synthetic kerosene production pathways driven by ICAO's CORSIA program, EU ReFuelEU Aviation mandates, and airline commitments to carbon neutrality.
-
The increasing use of CCU technology integration into synthetic fuel manufacturing plants, which allow industrial carbon dioxide emissions to be used as raw material for low-carbon synthetic methanol and e-fuel production.
-
The increasing adoption of synthetic fuels for military and defense applications due to energy security concerns, with armies in the United States, European Union, and NATO countries exploring synthetic fuel projects to mitigate their reliance on foreign fossil fuel supplies.
-
The growing cooperation between key automakers such as Toyota, Mazda, Subaru, and Suzuki, and energy firms to introduce synthetic fuel vehicle models and improve consumer awareness.
-
The supportive government policies, such as production tax incentives, mandatory blending policies, and green hydrogen subsidies, that create a positive economic environment for synthetic fuels in North America and Europe.
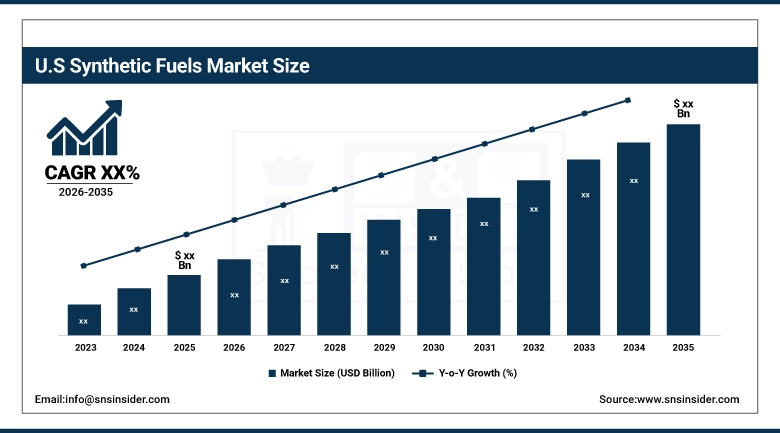
U.S. Synthetic Fuels Market is expected to be the fastest-growing regional market, driven by the DOE's SAF Grand Challenge, IRA production tax credits for clean fuels, and growing defense synthetic fuel programs targeting energy independence.
The U.S. is taking a leading position in developing synthetic fuels through the Department of Energy’s SAF Grand Challenge for a billion gallons per year of SAF production by 2030, clean fuel production tax credits under the Inflation Reduction Act, and increased funding by DARPA and DoD for synthetic fuels research and development for military energy security.
In January 2025, Lockheed Martin endorsed the use of synthetic fuels for F-35 aircraft after test flights successfully demonstrated the feasibility of such fuels for military operations. In November 2024, the International Airlines Group (IAG) inked a ten-year contract with Infinium for supplying synthetic fuels produced using renewable energy and CO2 and aiming to cut lifecycle emissions by 90% by 2050 – an example of long-term contracts generating steady cash flows for synthetic fuel producers and allowing for substantial capital investment.
Synthetic Fuels Market Segment Insights
-
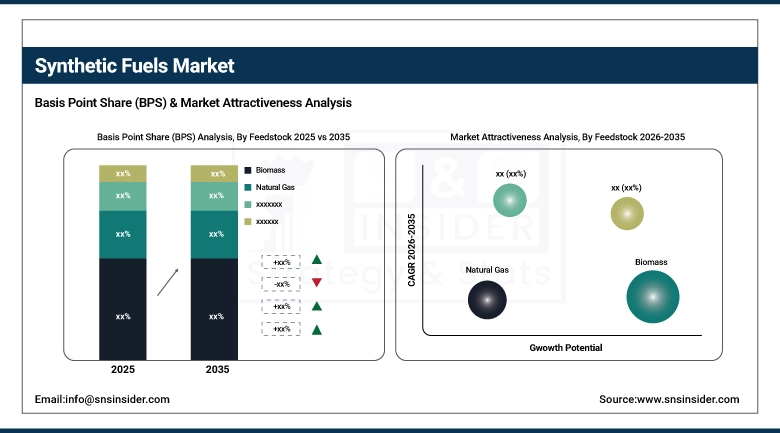
By Feedstock, Biomass accounted for the largest and fastest-growing segment (~22.23% CAGR) in 2025; Natural Gas and Power (electrolysis) also significant growth feedstocks.
-
By Fuel Type, Diesel accounted for the largest market share (~59.8%) in 2025; Kerosene/SAF expected to be the fastest-growing segment (CAGR of 22.72%).
-
By End-Use, Transportation accounted for the largest market share in 2025; Aviation expected to be the fastest-growing application within transportation.
Synthetic Fuels Market Segment Analysis
By Feedstock, Biomass dominates and grows fastest
The biomass feedstock segment dominated the synthetic fuels market in 2025 and is also growing at the fastest CAGR of 22.23%, driven by the escalating demand for renewable synthetic fuels produced from agricultural waste, forest residues, and energy crops. Biomass-to-Liquid (BTL) pathways are showing increasing momentum, particularly in Europe, driven by EU Renewable Energy Directive mandates, substantial R&D funding for advanced biofuels, and growing operational experience from pioneering BTL producers. The renewable feedstock credentials of biomass-derived synthetic fuels provide critical advantages for lifecycle carbon accounting and regulatory compliance.
The growth potential in Power (based on electrolytic technology for producing the feedstock) is the most promising owing to rapid reductions in the cost of electrolyzers and growing amounts of low-cost renewable energy. It allows creating synthetic fuels with zero emissions through Power-to-Liquid process that utilizes green hydrogen and captured CO2 to produce synthetic fuels.
By Fuel Type, Diesel dominates, Kerosene/SAF expected to grow fastest
Diesel held the largest market share, with around 59.8% of total shares in 2025 owing to the high penetration rate of synthetic diesel in heavy-duty transport applications. Synthetic diesel from Fischer-Tropsch process can directly be used in diesel engines without any modification due to its similar properties, making it easy to adopt on a large scale initially.
Kerosene/SAF became the fastest-growing category of synthetic fuels, which recorded a CAGR of 22.72%, propelled by recovering air traffic growth, CORSIA of ICAO’s carbon offsetting obligations, EU & UK blending mandates on SAFs, and airline commitments to net-zero emissions targets. Neste and LanzaTech are among companies ramping up their production of SAF, while the particular combination of energy density, safety certifications, and infrastructural compatibility make synthetic kerosene the most suitable choice for sustainable aviation fuels.
By End-Use, Transportation dominates, Aviation growing fastest
Transportation dominated the synthetic fuels end-use market in 2025, driven by the critical need to decarbonize hard-to-electrify sectors including long-haul trucking, shipping, aviation, and rail. Synthetic gasoline and diesel are particularly valued for their infrastructure compatibility, enabling zero-emission operation in existing vehicle fleets without powertrain modifications.
Aviation represents the fastest-growing transportation application for synthetic fuels, driven by the near-impossibility of battery-electric aviation for long-haul routes, combined with the international regulatory pressure for carbon reduction through ICAO CORSIA and national SAF mandates. Defense agencies in multiple NATO countries are also fast-tracking synthetic aviation fuel adoption for energy security and operational resilience.
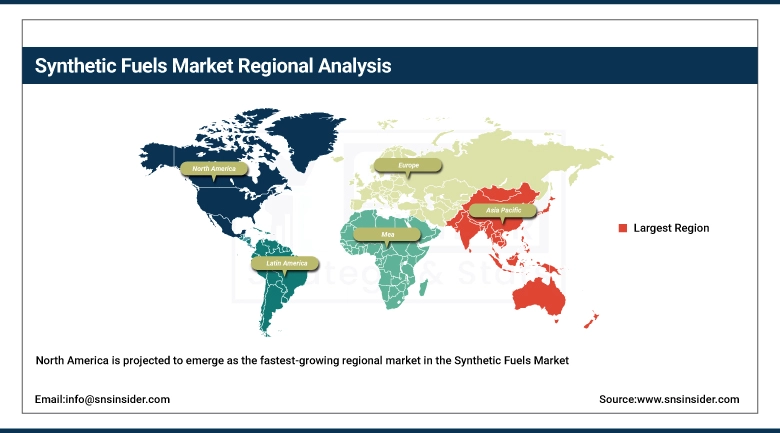
Synthetic Fuels Market Regional Analysis
|
Region |
Major Country |
Share within Region (%) |
|---|---|---|
|
North America |
United States |
35% |
|
Europe |
Germany |
32% |
|
Asia Pacific |
China |
38% |
|
Middle East & Africa |
UAE |
28% |
|
Latin America |
Brazil |
40% |
North America Synthetic Fuels Market Insights
North America is projected to emerge as the fastest-growing regional market in the Synthetic Fuels Market during the forecast period. Strong market growth is supported by the U.S. Department of Energy’s Sustainable Aviation Fuel (SAF) Grand Challenge, Inflation Reduction Act production tax credits for clean fuels, and increasing investments in low-carbon fuel infrastructure. The United States is also witnessing rising adoption of synthetic fuels across defense, aviation, shipping, and industrial sectors. The abundance of biomass, the development of carbon capture and usage technology, and increased capacities for producing renewable hydrogen are also helping enhance the market prospects of this region. Moreover, venture capital investment in synthetic fuel startups, along with favorable government policies promoting decarbonization efforts, is rapidly driving the adoption of synthetic fuels in North America.
Get Customized Report as per Your Business Requirement - Enquiry Now
Asia Pacific Synthetic Fuels Market Insights
There is a considerable rise in Synthetic Fuels Market growth within the Asia Pacific region, fueled by an increase in energy demands, increased carbon footprint reduction from industries, and investment in cleaner fuel technologies in China, Japan, South Korea, and India. The governments of these countries are developing their hydrogen economy and carbon neutrality policies, along with investing in sustainable aviation fuels in order to reduce their dependency on traditional fossil fuels. The focus of the Chinese government is on investments in coal-to-liquid and renewable synthetic fuel technologies, whereas the focus of the Japanese and Korean governments is on the development of hydrogen-based e-fuels and green ammonia fuels.
Europe Synthetic Fuels Market Insights
Countries including Germany, the Netherlands, France, and Norway are endorsing e-fuels, sustainable aviation fuels, and Power to Liquid to make decarbonization easy in the transport and industrial sectors. The Fit for 55 program by the EU and the Renewable Energy Directive have spurred the adoption of synthetic fuels in aviation, shipping, and automobiles. Furthermore, there is a good level of cooperation among energy firms, automakers, and research organizations that are driving innovations and advancements in synthetic fuel generation technology.
Middle East & Africa and Latin America Synthetic Fuels Market Insights
The synthetic fuels market in the Middle East & Africa region is slowly but steadily growing owing to growing investments in clean energy, green hydrogen generation, and carbon emission reduction. Nations like Saudi Arabia, UAE, and South Africa are making efforts towards renewable energy generation and synthetic fuel demonstration plants for their future energy plans. The availability of rich solar resources and increasing interest in producing sustainable aviation fuels are expected to boost the growth of the regional market.
Synthetic fuels have become another area that has generated a lot of attention in Latin America with the likes of Brazil, Chile, and Argentina taking the lead. The renewable energy capacity, thriving biofuels industry, and emphasis placed by the government on transportation fuels are making significant contributions towards the development of the market.
Synthetic Fuels Market Growth Drivers:
Global Decarbonization Mandates and Net-Zero Commitments Accelerating Synthetic Fuels Market Growth
There is a rapid growth trend in the market of Synthetic Fuels owing to the increased adoption of decarbonization strategies worldwide, as well as an increased requirement for carbon neutral fuels, especially for those sectors which are difficult to electrify, such as aviation, maritime, logistics, and industrial segments. There are significant investments from both the governments and industries in developing sustainable aviation fuels, e-fuels, and hydrogen-based fuels to reduce their dependency on fossil fuel-based products and comply with stringent emission standards. The rapid growth of renewable energy capacity and cheaper electrolyzers have made synthetic fuel manufacturing viable. Furthermore, technological progress in carbon capture, power-to-liquid, and renewable hydrogen generation technologies is hastening the commercialization of fuels. Such trends will aid in establishing synthetic fuels as a sustainable decarbonization solution until 2035.
Synthetic Fuels Market Restraints
High Production Costs and Limited Infrastructure Slowing Commercial-Scale Synthetic Fuel Adoption
There exist considerable restraints associated with the Synthetic Fuels Market because of the high cost involved in producing synthetic fuels relative to that of conventional fossil fuels. High capital expenditure on producing synthetic fuels through methods such as green hydrogen production, carbon capture, and power-to-liquids technologies makes it expensive to produce them. The scarcity of synthetic fuel production plants coupled with the lack of efficient transport and storage systems also affects market growth. Furthermore, the process of producing synthetic fuel is highly energy-intensive, thus making its production costly in areas characterized by expensive renewable energy sources. Issues such as regulatory uncertainty, inconsistent pricing of carbon, and poor fuel distribution networks affect its commercialization.
Synthetic Fuels Market Opportunities
Sustainable Aviation Fuel Expansion and Green Hydrogen Investments Creating Significant Market Opportunities
Opportunities for the Synthetic Fuels Market have been witnessed owing to growing investments in sustainable aviation fuels, green hydrogen projects, and decarbonization of industries. The need for carbon-neutral fuels from airlines, shipping firms, and heavy transport firms is on an uptick, in order to meet stringent targets set forth by regulatory authorities regarding emissions. Growing capacity of renewable energy, along with innovations in electrolyzer technology, have enhanced the cost effectiveness of synthetic fuel production processes. Besides this, increasing collaboration between governments and private firms for promoting e-fuels is fostering project growth throughout the world. Furthermore, the application of carbon capture utilization technology in conjunction with renewable hydrogen production is contributing to cost-effective production of low-carbon fuels.
Recent Developments:
-
2026: Sasol was certified by ISCC Plus for sustainable aviation fuel manufacturing. This would allow company for future exports of SAF from its South African hybrid bio-refinery activities to the European Union.
-
2026: Shell intensified the development of synthetic aviation fuels through its Shell XTL Process, which concentrated majorly on producing e-SAF and power-to-liquid fuels through Fischer-Tropsch technology.
-
2026: Infinium continued its development efforts for e-fuel manufacturing ventures through massive clean energy investments aimed at providing sustainable aviation and maritime fuels worldwide.
Synthetic Fuels Market Key Players
Some of the Synthetic Fuels Market Companies are:
-
Sasol Limited
-
Shell plc
-
ExxonMobil Corporation
-
TotalEnergies SE
-
Neste Corporation
-
Chevron Renewable Energy Group
-
BP plc
-
LanzaTech
-
Infinium
-
Synhelion SA
-
Topsoe A/S
-
Air Products and Chemicals, Inc.
-
Linde Engineering
-
Comstock Fuels
-
Dakota Gasification Company
-
Petro SA
-
Synfuels China
-
Maire Tecnimont S.p.A.
-
BTG Biomass Technology Group
-
Carbon Engineering
| Report Attributes | Details |
|---|---|
| Market Size in 2025 | USD 7.32 Billion |
| Market Size by 2035 | USD 48.48 Billion |
| CAGR | CAGR of 20.81% From 2026 to 2035 |
| Base Year | 2025 |
| Forecast Period | 2026-2035 |
| Historical Data | 2022-2024 |
| Report Scope & Coverage | Market Size, Segments Analysis, Competitive Landscape, Regional Analysis, DROC & SWOT Analysis, Forecast Outlook |
| Key Segments | • By Feedstock (Biomass, Natural Gas, Coal, Others) • By Production Process (Fischer-Tropsch Synthesis, Methanol Synthesis, Electrolysis/Power-to-Liquid, Coal Liquefaction) • By Fuel Type (Diesel, Kerosene/SAF, Gasoline, Others) • By End-Use (Transportation, Power Generation, Chemical Feedstock, Others) |
| Regional Analysis/Coverage | North America (US, Canada), Europe (Germany, UK, France, Italy, Spain, Russia, Poland, Rest of Europe), Asia Pacific (China, India, Japan, South Korea, Australia, ASEAN Countries, Rest of Asia Pacific), Middle East & Africa (UAE, Saudi Arabia, Qatar, South Africa, Rest of Middle East & Africa), Latin America (Brazil, Argentina, Mexico, Colombia, Rest of Latin America). |
| Company Profiles | Sasol Limited, Shell plc, ExxonMobil Corporation, TotalEnergies SE, Neste Corporation, Chevron Renewable Energy Group, BP plc, LanzaTech, Infinium, Synhelion SA, Topsoe A/S, Air Products and Chemicals Inc., Linde Engineering, Comstock Fuels, Dakota Gasification Company, Petro SA, Synfuels China, Maire Tecnimont S.p.A., BTG Biomass Technology Group, Carbon Engineering |
Frequently Asked Questions
Europe dominated the Synthetic Fuels Market in 2025, driven by the EU's ReFuelEU Aviation and FuelEU Maritime regulations, strong net-zero policy frameworks, government support for advanced biofuels and e-fuels, and Germany's leading position in green hydrogen and Power-to-X technology development
The Diesel segment dominated the Synthetic Fuels Market in 2025 with approximately 59.8% revenue share, owing to synthetic diesel's drop-in compatibility with existing heavy-duty transport infrastructure and its widespread application in trucking, marine, and industrial sectors.
The Biomass feedstock segment dominated the Synthetic Fuels Market in 2025 and is also growing at the fastest CAGR of 22.23%, driven by escalating demand for renewable BTL fuels under EU Renewable Energy Directive mandates and strong government and industry investment in biomass-to-liquid production capacity.
Global decarbonization mandates, net-zero commitments, and the urgent need to decarbonize hard-to-electrify sectors including aviation, shipping, and heavy-duty transport — combined with rapidly declining electrolyzer costs, government SAF mandates, and growing long-term offtake agreements — are the primary drivers of sustained market growth through 2035.
The Synthetic Fuels Market was valued at USD 7.32 billion in 2025.
The Synthetic Fuels Market is expected to grow at a CAGR of 20.81% from 2026 to 2035.
Get in Touch
