Extract, Transform, and Load Market Report Scope & Overview:
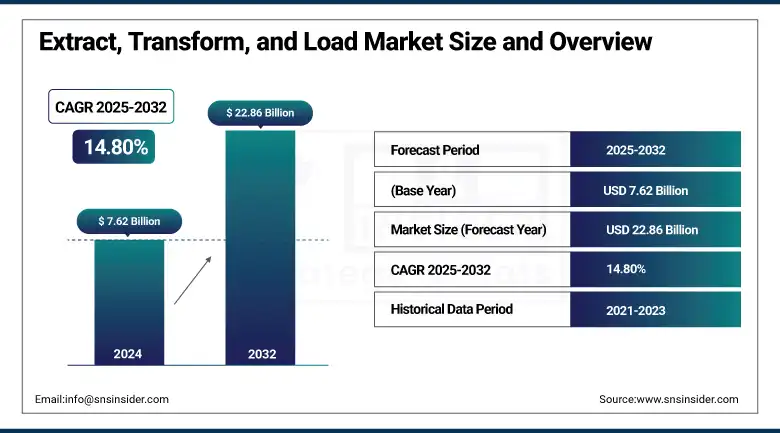
Extract, Transform, and Load Market size was valued at USD 7.62 billion in 2024 and is expected to reach USD 22.86 billion by 2032, growing at a CAGR of 14.80% from 2025-2032.
The Extract, Transform, and Load market is growing due to rising demand for data-driven decision making, availability of advanced cloud computing capabilities, and increasing need among organizations to combine large volumes of data from various sources. Furthermore, the increasing uptake of big data analytics, the trend towards digital transformation and the increasing complexity of data management are increasing the need for ETL solutions in industrial sectors.
Reflecting these trends, in 2024, Snowflake observed a 571% growth in Python usage, an AI friendly programming language, and a notable increase in work involving unstructured data, which is estimated to make up 80% to 90% of all data. This underscores the expanding role of ETL in enabling advanced AI and analytics applications.
To Get more information On Extract, Transform, and Load Market - Request Free Sample Report
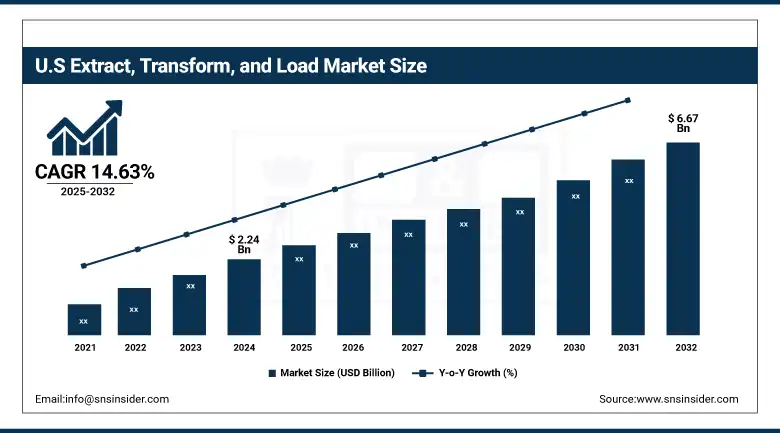
U.S. Extract, Transform, and Load Market size was valued at USD 2.24 billion in 2024 and is expected to reach USD 6.67 billion by 2032, growing at a CAGR of 14.63% from 2025-2032.
The U.S. ETL market growth is driven by accelerated cloud adoption, requirement for efficient data management, rise in real-time processing, and the growth in ai, machine learning and big data analytics to complement businesses with data-driven decision making-everest group
According to a report, over 94% of enterprises in the U.S. now use cloud services, indicating widespread infrastructure readiness for cloud-based ETL tools. Additionally, the U.S. leads globally with 5,388 data centers, reflecting its massive infrastructure for data storage and processing, which fuels the need for scalable and efficient ETL solutions.
Extract, Transform, and Load Market Dynamics
Drivers
-
Growing data volumes from digitalization and IoT are pushing enterprises to modernize their data integration frameworks rapidly.
The explosion of data generated from digital platforms, Internet of Things (IoT) devices and cloud applications require efficient ETL solutions for real-time analytics and insights. Organizations are upgrading their data infrastructure with cloud-native, automated ETL that can handle scalable processing. The growing demand for seamless data accessibility among different departments strongly points towards the relevance of agile, integrated ETL platforms. With the rising need to make quick business decisions, dynamic ETL pipelines that can manage high volume data in near real-time are a necessity.
In 2024, the global volume of data created, captured, copied, and consumed is 149 zettabytes. Approximately 402.74 million terabytes of data are generated daily. Notably, about 90% of the world's data has been created in the past two years, underscoring the rapid pace at which data is expanding.
Restraints
-
Data security and compliance challenges inhibit broader deployment of ETL solutions across regulated industries.
Strict data privacy regulations like GDPR, HIPAA, and CCPA impose strict controls on how data is handled, transformed, and stored. ETL processes, taking data from one system through several systems to another higher risk of exposure. Industries including healthcare, finance, and government must also contend with extra layers of complexity for data security in the ETL lifecycle. The encryption, access controls, and audit trail that compliance requires invariably takes time to implement and increase costs.
In fact, 78% of California companies and 62% of out-of-state businesses serving California residents reported full or partial CCPA compliance. Moreover, nearly 70% of service organizations must comply with six or more data privacy frameworks, highlighting the growing complexity and effort required to ensure ETL compliance.
Opportunities
-
Integration of AI and machine learning into ETL workflows presents a significant opportunity for automation and intelligent data transformation.
ETL tools driven by AI and machine learning facilitate intelligent and adaptive workflows identify anomalies, recommend mappings, and optimize transformation rules through usage patterns. It eliminates the need to do manual work and increase the productivity. By predicting the missing values and identifying inconsistencies in real-time, machine learning models also help to improve data quality.
In December 2024, AWS launched zero-ETL integrations for Amazon SageMaker Lakehouse and Amazon Redshift, automating data extraction and loading from apps like Salesforce, SAP, ServiceNow, and Zendesk, reducing the need for manual ETL pipelines and lowering operational efforts.
Challenges
-
Legacy systems and fragmented data sources make it difficult to build cohesive and efficient ETL pipelines.
Due to reliance on legacy systems that might not be compatible with on-demand ETL platforms, a lot of enterprises are facing integration bottlenecks. The systems are often proprietary, devoid of API access, and use siloed databases for storage, creating hurdles for data accessibility and standardization. The ETL workflows are made more complicated due to the availability of multiple data sources like on-premises servers or cloud-based SaaS.
In 2024, Informatica reported that building a data pipeline can take up to 12 weeks, which is considered an unsustainable delay for AI and analytics projects. Their survey of 300 IT and data professionals revealed that modern data integration tools can drastically cut this time down.
Extract, Transform, and Load Market Segment Analysis
By Component
The software segment captured around 71% of the Extract, Transform, and Load Market revenue in 2024 due to widespread demand for scalable, automated, and cloud-compatible data integration tools. As the rise in data volumes increases, enterprises have to rely on software platforms to grow, ensure quality, and support real-time analytics. Furthermore, the growth of hybrid and multi-cloud environments needs a better ETL software to easily process data from any number of sources and synchronize the data across varied systems and infrastructure.
The services segment is expected to grow at the fastest CAGR of 16.43% from 2025 to 2032, driven by growing demand for implementation, consulting, and managed services. With organizations working on more complicated cloud and hybrid data architectures, help from qualified and experienced professionals is essential to deploying an efficient ETL. These capabilities are vital to global firms, but small and mid-sized firms especially depend on service providers to minimize their operational burden while maximizing performance, governance, and compliance of the data pipeline to accommodate business intelligence as the requirement continues to evolve.
By Organization Size
Large enterprises dominated the Extract, Transform, and Load Market share with a 67% revenue share in 2024 due to their high data volumes, complex structures, and sizeable IT budget. Such enterprises need a robust ETL solution to handle data integration, governance, and analytics to drive internal decisions. Their also high as Enterprises continue digital transformation journey and want scalable, secure, and automated ETL Tools.
The SME segment is expected to grow at a 16.51% CAGR from 2025 to 2032 as affordable, cloud-based ETL solutions become more accessible. SMEs use these tools within limited resources to ease data integration and accelerate data-driven decisions. The increase in the demand for real-time analytics in retail, healthcare, finance, and other sectors also pushes SMEs to invest in ETL solutions to achieve operational efficiency and keep pace with the competition.
By End User
The BFSI sector led the Extract, Transform, and Load Market in 2024 with a 28% revenue share, driven by high-volume transactional data and strict regulatory compliance needs. ETL tools help banks and financial institutions to control risk, detect fraud, manage risk and also generate aggregated insights from heterogeneous systems. Digital infrastructure and data security have always been a strong investment of the sector, and the integration of fintech innovations keeps reinforcing the fact that the sector relies on strong, real-time data transformation capabilities.
The healthcare segment is expected to grow at a CAGR of 17.42% from 2025 to 2032, fueled by rapid digitization, EHR adoption, and data-driven care models. ETL tools help unify fragmented patient data from clinical, administrative, and IoT sources to support diagnostics and compliance. The rise of personalized medicine and AI-driven analytics is pushing healthcare providers to adopt advanced ETL systems that ensure accurate, real-time, and secure data integration.
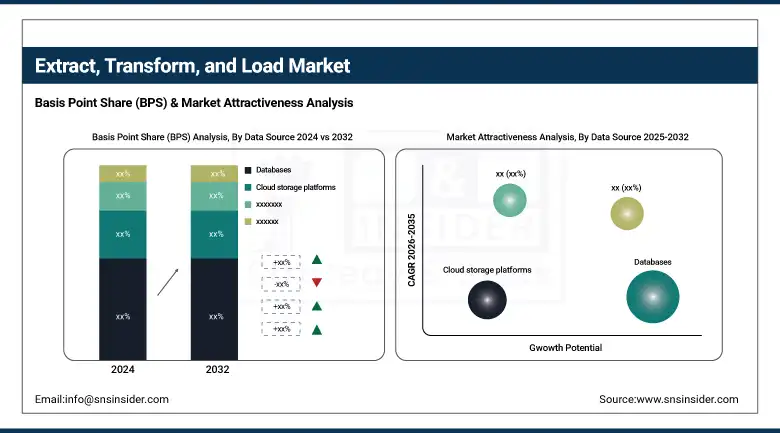
By Data Source
The databases segment accounted for 40% of the Extract, Transform, and Load Market revenue in 2024, as businesses continue to rely heavily on structured data repositories. ETL tools help in migrating, transforming, and integrating data extracted from different databases to form a single warehouse for analysis. As cloud databases are used more frequently and hybrid architectures more commonly employed, enterprises are looking for scalable ETL tools that will maintain and ensure the constant flow, integrity and accessibility of data between their on-premise and cloud-based systems.
Streaming data sources are projected to grow at the fastest CAGR of 17.31% from 2025 to 2032, driven by the rising need for real-time analytics from IoT, social media, and digital services. As businesses move towards event-driven architectures, there is a growing need for ETL pipelines that operate on live data streams in real-time, and then process and act on this data in events. The ability of native stream processing available through cloud-native platforms to provide real-time insights will accelerate this growth even further, helping organizations make faster decisions, drive real-time predictive analytics and improve customer responsiveness.
By Deployment Mode
The cloud segment dominated the Extract, Transform, and Load (ETL) Market in 2024 with a 65% revenue share and is projected to grow at the fastest CAGR of 15.22% from 2025 to 2032. This dominance and rapid growth are driven by mass migration towards cloud infrastructure that has no limits and can be tailored to your needs with cost effectiveness. Cloud-based ETL is preferred by organizations for its ease of deployment, integration with cloud-native tools and provision for real-time analytics support. With an increasing amount of data being stored across decentralised SaaS platforms, and with the growing number of edge devices, automated cloud ETL solutions enhance cloud ETL speeds and make this technology crucial to modern data strategy.
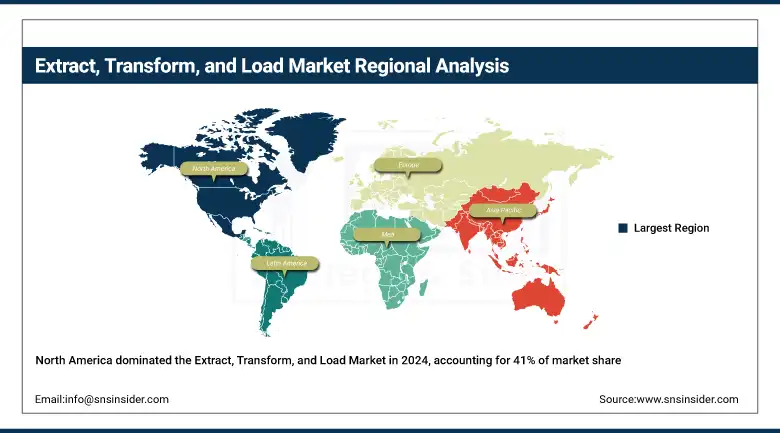
Regional Analysis
North America led the Extract, Transform, and Load Market in 2024 with a 41% revenue share, driven by early adoption of advanced analytics, cloud computing, and big data technologies. Mature IT infrastructure in the region and prominent presence of tech enterprises along with a focus on data governance and compliance are factors that have sparked ETL deployment with North America making the largest market share during the forecast period.
Get Customized Report as per Your Business Requirement - Enquiry Now
The U.S. dominates the Extract, Transform, and Load Market due to its advanced IT infrastructure, early cloud adoption, strong presence of tech giants, and high investment in data-driven technologies across industries.
Asia Pacific is projected to grow at the fastest CAGR of 16.64% from 2025 to 2032, driven by digital transformation, rising internet penetration, and growing adoption of cloud services. There is massive investment across the region to build data infrastructures for smart cities, e-commerce and Industry 4.0 by governments and enterprises. The rising number of tech startups and increasing need for real-time analytics, are fueling the growth of the ETL market in the Asia Pacific region.
China dominates the ETL market in Asia Pacific driven by the large digital economy, speedy enterprise it modernization, government pushed data initiative, and high demand for scalable, real-time data integration solution.
Europe maintains a strong presence in the ETL market, driven by its progressive industries, favorable digital transformation initiatives, and growing regional demand for data integration solutions. More stringent regulatory environment and a greater emphasis on data privacy in the region also continues to drive the demand for enterprise-grade ETL capabilities.
In 2024, 20.05% of EU enterprises employed ICT specialists, reflecting the region's growing emphasis on technology and skilled talent. The adoption of artificial intelligence (AI) technologies by 13.48% of EU enterprises further underscores the growing integration of advanced technologies in business operations.
The UK dominates the ETL market in Europe, supported by a mature digital landscape, more robust financial services sector, early movers in the cloud adoption journey, and above par demand for data integration across enterprises process.
The extract, transform, and load market growth in the Middle East & Africa and Latin America is due to rapid investment to build digital infrastructure, emerging trend to adopt cloud, and rising demand for ETL solution to integrate diverse data source in order to create actionable to drive business growth and technological advancement across economies in MEA & Latin America.
Key Players
Extract, Transform, and Load (ETL) Market Companies include key players such as Alteryx, AWS, Google, IBM, Informatica, Microsoft Corporation, Oracle, SAP, SAS, Talend, Fivetran Inc., Qlik Technologies Inc., Hitachi Vantara LLC, Snowflake Inc., and CloverDX Inc.
Recent Developments:
-
November 2024, AWS Glue 5.0 brings improved performance, enhanced security, and support for SageMaker Unified Studio and SageMaker Lakehouse. It upgrades engines to Apache Spark 3.5.2, Python 3.11, and Java 17, and adds support for open table formats like Apache Hudi, Iceberg, and Delta Lake.
-
In June 2024, Informatica introduced new offerings on the Snowflake AI Data Cloud, including Native SQL ELT support for Snowflake Cortex AI Functions, Enterprise Data Integrator (EDI), and Cloud Data Access Management (CDAM).
-
In November 2024, Hitachi Vantara expanded its Virtual Storage Platform One with new solutions, including an all-QLC flash storage array and object storage appliance, enhancing data management for AI and analytics workloads.
-
In March 2024, Hitachi Vantara announced a collaboration with NVIDIA to develop a new portfolio of industrial AI solutions, aiming to drive targeted AI outcomes by integrating industry-specific capabilities.
-
Google announced new capabilities in BigQuery, including real-time ML inference and reverse ETL with SQL, integration with Apache Flink for stream processing, and improved data governance features powered by Dataplex.
| Report Attributes | Details |
|---|---|
| Market Size in 2024 | USD 7.62 Billion |
| Market Size by 2032 | USD 22.86 Billion |
| CAGR | CAGR of 14.80% From 2025 to 2032 |
| Base Year | 2024 |
| Forecast Period | 2025-2032 |
| Historical Data | 2021-2023 |
| Report Scope & Coverage | Market Size, Segments Analysis, Competitive Landscape, Regional Analysis, DROC & SWOT Analysis, Forecast Outlook |
| Key Segments | • By Component (Software, Services) • By Deployment Mode (Cloud, On-premises) • By Organization Size (SME, Large Enterprises) • By Data Source (Databases, Cloud Storage Platforms, Enterprise Applications, Streaming Data Sources) • By End User (BFSI, Healthcare, Retail & E-commerce, IT & Telecom, Government & Public Sector, Manufacturing, Media & Entertainment, Others) |
| Regional Analysis/Coverage | North America (US, Canada, Mexico), Europe (Germany, France, UK, Italy, Spain, Poland, Turkey, Rest of Europe), Asia Pacific (China, India, Japan, South Korea, Singapore, Australia, Rest of Asia Pacific), Middle East & Africa (UAE, Saudi Arabia, Qatar, South Africa, Rest of Middle East & Africa), Latin America (Brazil, Argentina, Rest of Latin America) |
| Company Profiles | Alteryx, AWS, Google, IBM, Informatica, Microsoft Corporation, Oracle, SAP, SAS, Talend, Fivetran Inc., Qlik Technologies Inc., Hitachi Vantara LLC, Snowflake Inc., and CloverDX Inc. |
Frequently Asked Questions
Large enterprises dominated with a 67% market share in 2024, needing scalable ETL tools for data integration and compliance.
The software segment led in 2024, capturing 71% of revenue due to demand for scalable, automated, cloud-ready integration platforms.
Compliance with regulations like GDPR, HIPAA, and CCPA adds security complexities, with 70% of firms managing six or more frameworks.
The U.S. ETL market was valued at USD 2.24 billion in 2024 and is forecast to reach USD 6.67 billion by 2032.
Extract, Transform, and Load Market size was valued at USD 7.62 billion in 2024 and is expected to reach USD 22.86 billion by 2032, growing at a CAGR of 14.80% from 2025-2032.
Get in Touch
