image

Feed Palatability Enhancers and Modifiers Market Size, Share & Segment By Source (Natural, Synthetic), Product (Flavors, Sweeteners, Texturants), Livestock (Ruminant, Poultry, Swine, Aquaculture), Form (Dry, Liquid), End-user (Commercial Feed Manufacturers, Farmers and Livestock Producers, Pet Food Companies, Aquaculture Operators), and Region | Global Forecast 2025-2032

Date: July 2025 Report Code: SNS/C&M/7958 Page 350

Feed Palatability Enhancers and Modifiers Market Size & Overview:

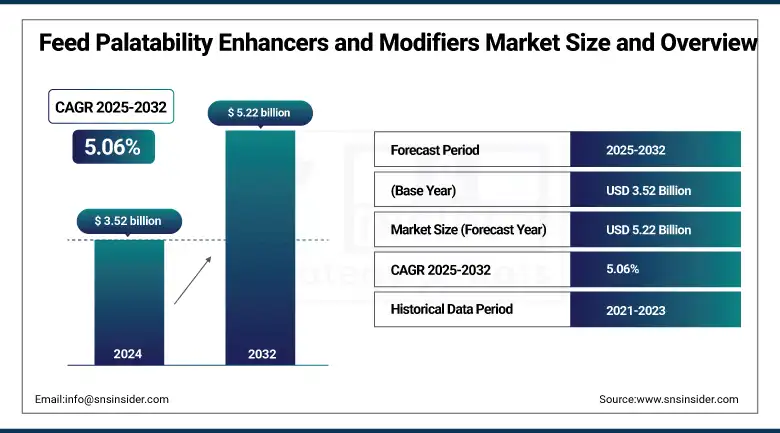
The Feed Palatability Enhancers and Modifiers Market size was valued at USD 3.52 billion in 2024 and is expected to reach USD 5.22 billion by 2032, growing at a CAGR of 5.06% over the forecast period of 2025-2032.

The feed palatability enhancers and modifiers market is evolving as livestock nutrition strategies prioritize natural feed additives and precise feed taste enhancers to improve intake and growth performance. The feed palatability enhancers and modifiers market growth is supported by expanding demand for nutritional feed solutions in the animal feed industry, especially ruminant feed additives and aquaculture feed enhancers. According to FAO’s 2024 report, aquaculture production reached 130.9 million tonnes in 2022. FEDIAF’s 2024 fact sheet shows 43 insect-based pet food brands, boosting flavoring agents in animal feed innovation. The USDA Feed Outlook 2024 highlights steady swine and poultry feed demand. Feed palatability enhancers and modifiers companies like Adisseo and Kemin expand natural feed additives and feed flavor compounds portfolios, shaping feed palatability enhancers and modifiers market trends and share. Continuous feed palatability enhancers and modifiers market analysis drives sustainable feed additives development.

Feed Palatability Enhancers and Modifiers Market Dynamics:

Drivers:

  • Surge in functional pet diets stimulates demand for innovative palatability enhancers in feed additives

The feed palatability enhancers and modifiers market growth is fueled by rising launches of functional pet foods containing advanced feed flavor compounds. In 2023, Nestlé Purina launched botanical-based flavoring agents in animal feed targeting pet digestion. This innovation supports the feed palatability enhancers and modifiers market size by offering premium nutritional feed solutions. Feed palatability enhancers and modifiers companies now diversify portfolios to capture evolving demand for natural feed additives and growth performance enhancers, boosting overall feed palatability enhancers and modifiers market share.

  • Expanding organic dairy farming boosts natural feed additives in the ruminant feed additives segment

Feed palatability enhancers and modifiers market trends show rising organic dairy farming drives demand for botanical palatability enhancers and feed taste enhancers. According to the USDA Organic Dairy Survey 2023, US organic milk production increased by 4.3% over the previous year. This trend aligns with consumer preference for clean-label livestock nutrition. Feed palatability enhancers and modifiers companies introduce new flavoring agents in animal feed tailored for ruminant feed additives, positively impacting feed palatability enhancers and modifiers market size and global feed palatability enhancers and modifiers market growth.

Restraints:

  • Limited farmer education slows adoption of nutritional feed solutions in smallholder sectors

Feed palatability enhancers and modifiers market analysis shows limited awareness among smallholder farmers reduces adoption of advanced feed taste enhancers and palatability enhancers. FAO’s Smallholder Livestock Report 2023 notes many producers rely on basic feed additives, underusing innovative feed flavor compounds. Feed palatability enhancers and modifiers companies address this gap through training, yet the feed palatability enhancers and modifiers market size growth remain uneven across regions. Closing knowledge gaps is crucial to expand feed palatability enhancers and modifiers market share sustainably.

Feed Palatability Enhancers and Modifiers Market Segmentation Analysis:

By Source

Synthetic dominated the feed palatability enhancers and modifiers market in 2024 with 60.30% due to consistent use in commercial swine and poultry diets. USDA Feed Outlook May 2024 highlighted robust feed production supporting synthetic palatability enhancers and feed flavor compounds. Their stable formulation, lower cost, and large-scale compatibility reinforce feed palatability enhancers and modifiers market share, making synthetic additives critical for livestock nutrition and uniform product quality across global animal feed industry applications.

Natural feed additives are the fastest growing with a 5.15% CAGR, driven by demand for clean-label solutions. EFSA’s 2023 update encouraged reformulation of feed additives with botanical palatability enhancers and natural feed taste enhancers. Feed palatability enhancers and modifiers companies responded by developing plant-based flavoring agents in animal feed to improve livestock nutrition sustainably. These shifts reflect feed palatability enhancers and modifiers market trends favoring natural feed additives, especially in premium segments like pet food and aquaculture feed enhancers.
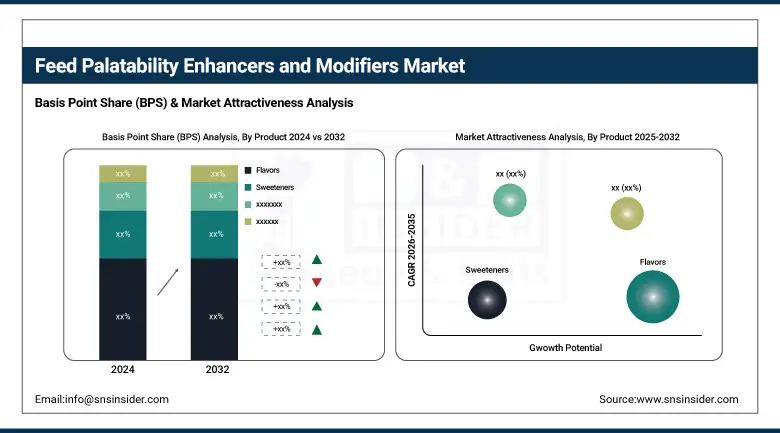
By Product

Flavors dominated the feed palatability enhancers and modifiers market in 2024 with 46.20% due to high demand in poultry and pet diets. Nestlé Purina’s 2023 sustainability report highlighted investment in botanical feed flavor compounds. Feed palatability enhancers and modifiers companies rely on flavoring agents in animal feed to improve intake and growth performance. This trend strengthens feed palatability enhancers and modifiers market share, ensuring quality across livestock nutrition and supporting consistent feed palatability enhancers and modifiers market analysis.

Sweeteners are the fastest growing with a 5.33% CAGR, driven by aquaculture expansion. FAO’s 2024 report showed aquaculture production at 130.9 million tonnes. Feed palatability enhancers and modifiers companies created natural sweeteners as feed additives to increase diet acceptance. The feed palatability enhancers and modifiers market trends reflect rising demand for nutritional feed solutions in aquaculture feed enhancers, strengthening feed palatability enhancers and modifiers market growth and animal feed industry sustainability initiatives globally.

By Livestock

Poultry dominated the feed palatability enhancers and modifiers market in 2024 with 38.90% due to high-volume feed demand. USDA Feed Outlook May 2024 reported steady poultry feed production supporting palatability enhancers and feed taste enhancers. Feed palatability enhancers and modifiers companies target poultry diets to ensure consistent intake and livestock nutrition quality. This stability increases feed palatability enhancers and modifiers market size and share, aligning with broader animal feed industry strategies prioritizing growth performance enhancers and reliable feed additives.

Swine feed additives are the fastest growing with a 5.51% CAGR, driven by rising global pork demand. USDA’s May 2024 report highlighted strong feed consumption in swine diets. Feed palatability enhancers and modifiers companies developed tailored feed flavor compounds and nutritional feed solutions to improve acceptance and efficiency. These dynamic supports feed palatability enhancers and modifiers market growth and trends in swine and poultry feed, meeting diverse livestock nutrition needs and reinforcing animal feed industry resilience.

By Form

Dry dominated the feed palatability enhancers and modifiers market in 2024 with 66.40% due to easier handling and storage. USDA Feed Outlook May 2024 noted stable demand for dry feed additives in commercial production. Feed palatability enhancers and modifiers companies use dry formulations to optimize processing and cost efficiency, supporting feed palatability enhancers and modifiers market share. Dry feed additives remain critical for livestock nutrition consistency and large-scale feed manufacturing, aligning with animal feed industry supply chain requirements.

Liquid feed additives are the fastest growing with a 5.13% CAGR, driven by niche feed applications. National aquaculture programs promoted liquid botanical feed taste enhancers for fish diets. Feed palatability enhancers and modifiers companies innovate liquid nutritional feed solutions improving palatability and growth. This supports feed palatability enhancers and modifiers market growth and trends across premium segments like aquaculture feed enhancers and pet nutrition, reinforcing sustainable feed additives adoption.

By End-user

Commercial feed manufacturers dominated the feed palatability enhancers and modifiers market in 2024 with 52.40% due to large production scale. USDA Feed Outlook May 2024 reported steady demand in swine and poultry diets. Feed palatability enhancers and modifiers companies partner with commercial producers to deliver feed flavor compounds and palatability enhancers, boosting feed palatability enhancers and modifiers market share and meeting livestock nutrition standards. This trend aligns with consistent animal feed industry strategies prioritizing reliable feed additives.

Pet food companies are the fastest growing with a 5.72% CAGR, driven by premium natural diets. Nestlé Purina’s 2023 report detailed adding botanical flavoring agents in animal feed for pets. Feed palatability enhancers and modifiers companies develop natural feed additives to match consumer demand, supporting feed palatability enhancers and modifiers market growth. This dynamic reflects feed palatability enhancers and modifiers market trends favoring clean-label nutritional feed solutions for pets, enhancing brand differentiation.

Feed Palatability Enhancers and Modifiers Market Regional Outlook

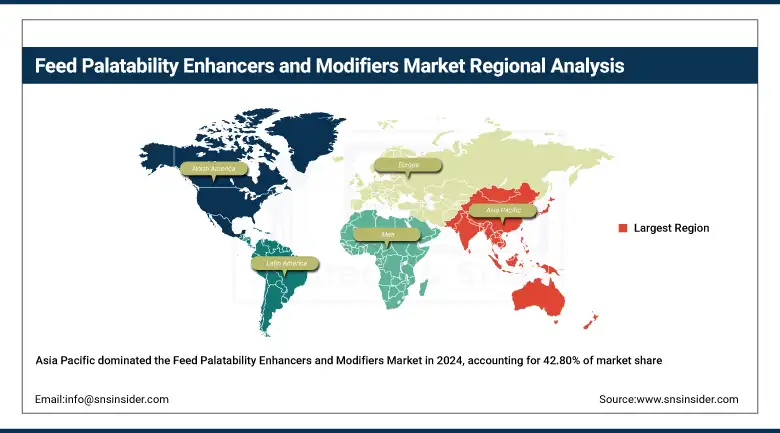
Asia Pacific dominated the feed palatability enhancers and modifiers market in 2024 with a significant market share of 42.80%, driven by strong swine and poultry feed demand. FAO’s 2024 report highlighted China’s and India’s rising feed additives consumption. Feed palatability enhancers and modifiers companies leverage botanical feed flavor compounds to improve livestock nutrition and animal feed industry efficiency. Country-wise, China leads in ruminant feed additives, supporting feed palatability enhancers and modifiers market growth and feed palatability enhancers and modifiers market trends.

Europe is the fastest-growing region from 2025 to 2032, with an estimated highest CAGR of 5.50%, supported by sustainable livestock nutrition policies. EFSA’s 2023 feed additives update spurred demand for botanical flavoring agents in animal feed and palatability enhancers. Germany and France lead, investing in aquaculture feed enhancers and natural feed additives. This aligns with feed palatability enhancers and modifiers market trends favoring sustainable nutritional feed solutions, strengthening feed palatability enhancers and modifiers market growth and market analysis across the animal feed industry.

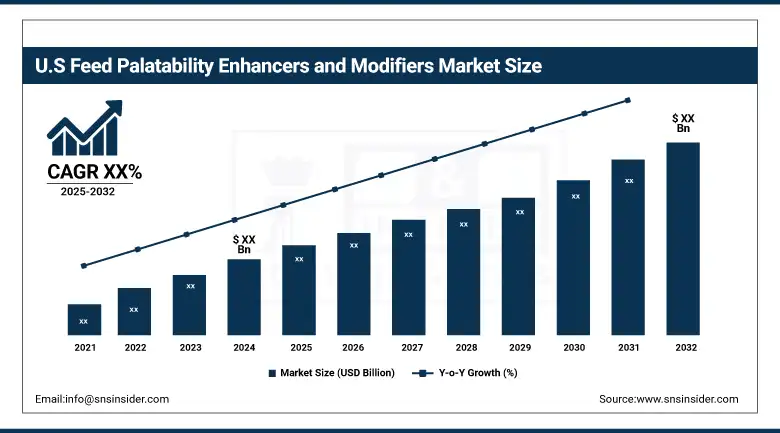
North America holds a 21.90% share in the feed palatability enhancers and modifiers market, driven by demand for feed flavor compounds and natural feed additives. USDA Feed Outlook (May 2024) highlights steady swine and poultry feed production supporting palatability enhancers. The United States leads this growth with strong feed production and rising demand for natural additives. Companies like Kemin Industries and Kent Nutrition Group expand botanical flavoring agents and feed taste enhancers, strengthening market size and reinforcing livestock nutrition trends in Canada, Mexico, and the US.

Key Players:

The major feed palatability enhancers and modifiers market competitors include Adisseo France SAS, Nutriad International NV, Kemin Industries, Inc., Pancosma SA, Phytobiotics Futterzusatzstoffe GmbH, Prinova Group LLC, Grupo Ferrer Internacional, S.A., Tanke International Group, Diana Foods, Ensign-Bickford Industries Inc., Kent Nutrition Group, Novus International, Inc., Alltech, Inc., Elanco Animal Health, Afgri Animal Feeds, Solvay S.A., Intertek, Omic USA Inc., Bruker BioSpin GmbH, and Dairy One Cooperative, Inc.

Recent Developments:

  • In July 2025, Nor‑Feed (Adisseo subsidiary) announced accelerated R&D in botanical palatability solutions for swine and poultry, leveraging Adisseo expertise to broaden natural feed additive portfolios

  • In December 2024, Kemin explored insect protein meals’ impact on pet food palatability, guiding development of new flavoring agents for dog and cat diets  

Feed Palatability Enhancers and Modifiers Market Report Scope:

Report Attributes Details
Market Size in 2024 USD 3.52 billion
Market Size by 2032 USD 5.22 billion
CAGR CAGR of 5.06% From 2025 to 2032
Base Year 2024
Forecast Period 2025-2032
Historical Data 2021-2023
Report Scope & Coverage Market Size, Segments Analysis, Competitive Landscape, Regional Analysis, DROC & SWOT Analysis, Forecast Outlook
Key Segments •By Source (Natural, Synthetic)
•By Product (Flavors, Sweeteners, Texturants, Others)
•By Livestock (Ruminant, Poultry, Swine, Aquaculture, Others)
•By Form (Dry, Liquid)
•By End-user (Commercial Feed Manufacturers, Farmers and Livestock Producers, Pet Food Companies, Aquaculture Operators, Others)
Regional Analysis/Coverage North America (US, Canada, Mexico), Europe (Germany, France, UK, Italy, Spain, Poland, Turkey, Rest of Europe), Asia Pacific (China, India, Japan, South Korea, Singapore, Australia, Rest of Asia Pacific), Middle East & Africa (UAE, Saudi Arabia, Qatar, South Africa, Rest of Middle East & Africa), Latin America (Brazil, Argentina, Rest of Latin America)
Company Profiles Adisseo France SAS, Nutriad International NV, Kemin Industries, Inc., Pancosma SA, Phytobiotics Futterzusatzstoffe GmbH, Prinova Group LLC, Grupo Ferrer Internacional, S.A., Tanke International Group, Diana Foods, Ensign-Bickford Industries Inc., Kent Nutrition Group, Novus International, Inc., Alltech, Inc., Elanco Animal Health, Afgri Animal Feeds, Solvay S.A., Intertek, Omic USA Inc., Bruker BioSpin GmbH, and Dairy One Cooperative, Inc.

Frequently Asked Questions

The market shows steady growth driven by rising demand for natural feed additives, advanced flavor compounds, and expanding applications in livestock and aquaculture feed.

Surging functional pet food launches, organic dairy expansion, and innovation in botanical palatability enhancers significantly boost feed palatability enhancers and modifiers market growth.

Asia Pacific dominates with 42.80% market share, supported by strong poultry and swine feed demand in China and India, according to FAO’s 2024 report.

Limited farmer education in smallholder sectors slows adoption of advanced feed taste enhancers, reducing growth potential despite strong global livestock nutrition trends.

EU’s EFSA updates and clean-label policies encourage natural feed additives, accelerating reformulation and boosting sustainable feed palatability enhancers and modifiers market trends.

Table Of Contents

1. Introduction

1.1 Market Definition & Scope

 1.2 Research Assumptions & Abbreviations

 1.3 Research Methodology

2. Executive Summary

2.1 Market Snapshot

 2.2 Market Absolute $ Opportunity Assessment & Y-o-Y Analysis, 2021–2032

 2.3 Market Size & Forecast, By Segmentation, 2021–2032

  2.3.1 Market Size By Source

         2.3.2 Market Size By Product

  2.3.2 Market Size By Livestock

         2.3.4 Market Size By Form

         2.3.5 Market Size By End-user

 2.4 Market Share & Bps Analysis By Region, 2024

 2.5 Industry Growth Scenarios – Conservative, Likely & Optimistic

 2.6 Industry CxO’s Perspective

3. Market Overview

3.1 Market Dynamics

  3.1.1 Drivers

  3.1.2 Restraints

  3.1.3 Opportunities

  3.1.4 Key Market Trends

 3.2 Industry PESTLE Analysis

 3.3 Key Industry Forces (Porter’s) Impacting Market Growth

 3.4 Industry Supply Chain Analysis

  3.4.1 Raw Material Suppliers

  3.4.2 Manufacturers

  3.4.3 Distributors/Suppliers

  3.4.4 Customers/End-Users

 3.5 Industry Life Cycle Assessment

 3.6 Parent Market Overview

 3.7 Market Risk Assessment

4. Statistical Insights & Trends Reporting

4.1 Pricing Analysis & Forecast

  4.1.1 Overview

  4.1.2 Pricing Analysis & Forecast By Product, 2021–2032

  4.1.3 Price Benchmarking By Key Players, 2024

 4.2 Regulatory Landscape

  4.2.1 Overview

  4.2.2 Regulatory Trends By Key Countries

  4.2.3 Regulatory Outlook By Product Livestock

 4.3 Trade Analysis

  4.3.1 Overview

  4.3.2 Import Analysis (Value & Volume), By Country, 2021–2024

  4.3.3 Export Analysis (Value & Volume), By Country, 2021–2024

  4.3.4 Major Importing Countries

  4.3.5 Major Exporting Countries

5. Aromatic Solvents Market Segmental Analysis & Forecast, By Source, 2021 – 2032, Value (USD Billion) & Volume

5.1 Introduction

 5.2 Natural

  5.2.1 Key Trends

  5.2.2 Market Size & Forecast, 2021 – 2032

 5.3 Synthetic

  5.3.1 Key Trends

  5.3.2 Market Size & Forecast, 2021 – 2032

6. Aromatic Solvents Market Segmental Analysis & Forecast, By Product, 2021 – 2032, Value (USD Billion) & Volume

    6.1 Introduction

 6.2 Flavors

  6.2.1 Key Trends

  6.2.2 Market Size & Forecast, 2021 – 2032

 6.3 Sweeteners

  6.3.1 Key Trends

  6.3.2 Market Size & Forecast, 2021 – 2032

 6.4 Texturants

  6.4.1 Key Trends

  6.4.2 Market Size & Forecast, 2021 – 2032

 6.5 Others

  6.5.1 Key Trends

  6.5.2 Market Size & Forecast, 2021 – 2032

7. Aromatic Solvents Market Segmental Analysis & Forecast, By Livestock, 2021 – 2032, Value (USD Billion) & Volume

    7.1 Introduction

 7.2 Ruminant        

  7.2.1 Key Trends

  7.2.2 Market Size & Forecast, 2021 – 2032

 7.3 Poultry

  7.3.1 Key Trends

  7.3.2 Market Size & Forecast, 2021 – 2032

 7.4 Swine

  7.4.1 Key Trends

  7.4.2 Market Size & Forecast, 2021 – 2032

 7.5 Aquaculture

  7.5.1 Key Trends

  7.5.2 Market Size & Forecast, 2021 – 2032

 7.6 Others

  7.6.1 Key Trends

  7.6.2 Market Size & Forecast, 2021 – 2032

8. Aromatic Solvents Market Segmental Analysis & Forecast, By Form, 2021 – 2032, Value (USD Billion) & Volume

    8.1 Introduction

 8.2 Dry

  8.2.1 Key Trends

  8.2.2 Market Size & Forecast, 2021 – 2032

 8.3 Liquid

  8.3.1 Key Trends

  8.3.2 Market Size & Forecast, 2021 – 2032

9. Aromatic Solvents Market Segmental Analysis & Forecast, By End-user, 2021 – 2032, Value (USD Billion) & Volume

    9.1 Introduction 

  9.2 Commercial Feed Manufacturers   

   9.2.1 Key Trends 

   9.2.2 Market Size & Forecast, 2021 – 2032 

  9.3 Farmers and Livestock Producers

   9.3.1 Key Trends 

   9.3.2 Market Size & Forecast, 2021 – 2032 

  9.4 Pet Food Companies

   9.4.1 Key Trends 

   9.4.2 Market Size & Forecast, 2021 – 2032 

  9.5 Aquaculture Operators

   9.5.1 Key Trends 

   9.5.2 Market Size & Forecast, 2021 – 2032 

  9.6 Others

   9.6.1 Key Trends 

   9.6.2 Market Size & Forecast, 2021 – 2032 

10. Aromatic Solvents Market Segmental Analysis & Forecast By Region, 2021 – 2032, Value (USD Billion) & Volume

 10.1 Introduction

 10.2 North America

  10.2.1 Key Trends

  10.2.2 Aromatic Solvents Market Size & Forecast, By Source, 2021 – 2032

  10.2.3 Aromatic Solvents Market Size & Forecast, By Product, 2021 – 2032

  10.2.4 Aromatic Solvents Market Size & Forecast, By Livestock, 2021 – 2032

  10.2.5 Aromatic Solvents Market Size & Forecast, By Form, 2021 – 2032

  10.2.6 Aromatic Solvents Market Size & Forecast, By End-user, 2021 – 2032

  10.2.7 Aromatic Solvents Market Size & Forecast, By Country, 2021 – 2032

   10.2.7.1 USA

    10.2.7.1.1 Aromatic Solvents Market Size & Forecast, By Source, 2021 – 2032

    10.2.7.1.2 Aromatic Solvents Market Size & Forecast, By Product, 2021 – 2032

    10.2.7.1.3 Aromatic Solvents Market Size & Forecast, By Livestock, 2021 – 2032

    10.2.7.1.4 Aromatic Solvents Market Size & Forecast, By Form, 2021 – 2032

    10.2.7.1.5 Aromatic Solvents Market Size & Forecast, By End-user, 2021 – 2032

   10.2.7.2 Canada

    10.2.7.2.1 Aromatic Solvents Market Size & Forecast, By Source, 2021 – 2032

    10.2.7.2.2 Aromatic Solvents Market Size & Forecast, By Product, 2021 – 2032

    10.2.7.2.3 Aromatic Solvents Market Size & Forecast, By Livestock, 2021 – 2032

    10.2.7.2.4 Aromatic Solvents Market Size & Forecast, By Form, 2021 – 2032

    10.2.7.2.5 Aromatic Solvents Market Size & Forecast, By End-user, 2021 – 2032

10.3 Europe

 10.3.1 Key Trends

 10.3.2 Aromatic Solvents Market Size & Forecast, By Source, 2021 – 2032

 10.3.3 Aromatic Solvents Market Size & Forecast, By Product, 2021 – 2032

 10.3.4 Aromatic Solvents Market Size & Forecast, By Livestock, 2021 – 2032

 10.3.5 Aromatic Solvents Market Size & Forecast, By Form, 2021 – 2032

 10.3.6 Aromatic Solvents Market Size & Forecast, By End-user, 2021 – 2032

 10.3.7 Aromatic Solvents Market Size & Forecast, By Country, 2021 – 2032

  10.3.7.1 Germany

   10.3.7.1.1 Aromatic Solvents Market Size & Forecast, By Source, 2021 – 2032

   10.3.7.1.2 Aromatic Solvents Market Size & Forecast, By Product, 2021 – 2032

   10.3.7.1.3 Aromatic Solvents Market Size & Forecast, By Livestock, 2021 – 2032

   10.3.7.1.4 Aromatic Solvents Market Size & Forecast, By Form, 2021 – 2032

   10.3.7.1.5 Aromatic Solvents Market Size & Forecast, By End-user, 2021 – 2032

  10.3.7.2 UK

   10.3.7.2.1 Aromatic Solvents Market Size & Forecast, By Source, 2021 – 2032

   10.3.7.2.2 Aromatic Solvents Market Size & Forecast, By Product, 2021 – 2032

   10.3.7.2.3 Aromatic Solvents Market Size & Forecast, By Livestock, 2021 – 2032

   10.3.7.2.4 Aromatic Solvents Market Size & Forecast, By Form, 2021 – 2032

   10.3.7.2.5 Aromatic Solvents Market Size & Forecast, By End-user, 2021 – 2032

  10.3.7.3 France

   10.3.7.3.1 Aromatic Solvents Market Size & Forecast, By Source, 2021 – 2032

   10.3.7.3.2 Aromatic Solvents Market Size & Forecast, By Product, 2021 – 2032

   10.3.7.3.3 Aromatic Solvents Market Size & Forecast, By Livestock, 2021 – 2032

   10.3.7.3.4 Aromatic Solvents Market Size & Forecast, By Form, 2021 – 2032

   10.3.7.3.5 Aromatic Solvents Market Size & Forecast, By End-user, 2021 – 2032

  10.3.7.4 Italy

   10.3.7.4.1 Aromatic Solvents Market Size & Forecast, By Source, 2021 – 2032

   10.3.7.4.2 Aromatic Solvents Market Size & Forecast, By Product, 2021 – 2032

   10.3.7.4.3 Aromatic Solvents Market Size & Forecast, By Livestock, 2021 – 2032

   10.3.7.4.4 Aromatic Solvents Market Size & Forecast, By Form, 2021 – 2032

   10.3.7.4.5 Aromatic Solvents Market Size & Forecast, By End-user, 2021 – 2032

  10.3.7.5 Spain

   10.3.7.5.1 Aromatic Solvents Market Size & Forecast, By Source, 2021 – 2032

   10.3.7.5.2 Aromatic Solvents Market Size & Forecast, By Product, 2021 – 2032

   10.3.7.5.3 Aromatic Solvents Market Size & Forecast, By Livestock, 2021 – 2032

   10.3.7.5.4 Aromatic Solvents Market Size & Forecast, By Form, 2021 – 2032

   10.3.7.5.5 Aromatic Solvents Market Size & Forecast, By End-user, 2021 – 2032

  10.3.7.6 Russia

   10.3.7.6.1 Aromatic Solvents Market Size & Forecast, By Source, 2021 – 2032

   10.3.7.6.2 Aromatic Solvents Market Size & Forecast, By Product, 2021 – 2032

   10.3.7.6.3 Aromatic Solvents Market Size & Forecast, By Livestock, 2021 – 2032

   10.3.7.6.4 Aromatic Solvents Market Size & Forecast, By Form, 2021 – 2032

   10.3.7.6.5 Aromatic Solvents Market Size & Forecast, By End-user, 2021 – 2032

  10.3.7.7 Poland

   10.3.7.7.1 Aromatic Solvents Market Size & Forecast, By Source, 2021 – 2032

   10.3.7.7.2 Aromatic Solvents Market Size & Forecast, By Product, 2021 – 2032

   10.3.7.7.3 Aromatic Solvents Market Size & Forecast, By Livestock, 2021 – 2032

   10.3.7.7.4 Aromatic Solvents Market Size & Forecast, By Form, 2021 – 2032

   10.3.7.7.5 Aromatic Solvents Market Size & Forecast, By End-user, 2021 – 2032

  10.3.7.8 Rest of Europe

   10.3.7.8.1 Aromatic Solvents Market Size & Forecast, By Source, 2021 – 2032

   10.3.7.8.2 Aromatic Solvents Market Size & Forecast, By Product, 2021 – 2032

   10.3.7.8.3 Aromatic Solvents Market Size & Forecast, By Livestock, 2021 – 2032

   10.3.7.8.4 Aromatic Solvents Market Size & Forecast, By Form, 2021 – 2032

   10.3.7.8.5 Aromatic Solvents Market Size & Forecast, By End-user, 2021 – 2032

10.4 Asia-Pacific

 10.4.1 Key Trends

 10.4.2 Aromatic Solvents Market Size & Forecast, By Source, 2021 – 2032

 10.4.3 Aromatic Solvents Market Size & Forecast, By Product, 2021 – 2032

 10.4.4 Aromatic Solvents Market Size & Forecast, By Livestock, 2021 – 2032

 10.4.5 Aromatic Solvents Market Size & Forecast, By Form, 2021 – 2032

 10.4.6 Aromatic Solvents Market Size & Forecast, By End-user, 2021 – 2032

 10.4.7 Aromatic Solvents Market Size & Forecast, By Country, 2021 – 2032

  10.4.7.1 China

   10.4.7.1.1 Aromatic Solvents Market Size & Forecast, By Source, 2021 – 2032

   10.4.7.1.2 Aromatic Solvents Market Size & Forecast, By Product, 2021 – 2032

   10.4.7.1.3 Aromatic Solvents Market Size & Forecast, By Livestock, 2021 – 2032

   10.4.7.1.4 Aromatic Solvents Market Size & Forecast, By Form, 2021 – 2032

   10.4.7.1.5 Aromatic Solvents Market Size & Forecast, By End-user, 2021 – 2032

  10.4.7.2 India

   10.4.7.2.1 Aromatic Solvents Market Size & Forecast, By Source, 2021 – 2032

   10.4.7.2.2 Aromatic Solvents Market Size & Forecast, By Product, 2021 – 2032

   10.4.7.2.3 Aromatic Solvents Market Size & Forecast, By Livestock, 2021 – 2032

   10.4.7.2.4 Aromatic Solvents Market Size & Forecast, By Form, 2021 – 2032

   10.4.7.2.5 Aromatic Solvents Market Size & Forecast, By End-user, 2021 – 2032

  10.4.7.3 Japan

   10.4.7.3.1 Aromatic Solvents Market Size & Forecast, By Source, 2021 – 2032

   10.4.7.3.2 Aromatic Solvents Market Size & Forecast, By Product, 2021 – 2032

   10.4.7.3.3 Aromatic Solvents Market Size & Forecast, By Livestock, 2021 – 2032

   10.4.7.3.4 Aromatic Solvents Market Size & Forecast, By Form, 2021 – 2032

   10.4.7.3.5 Aromatic Solvents Market Size & Forecast, By End-user, 2021 – 2032

  10.4.7.4 South Korea

   10.4.7.4.1 Aromatic Solvents Market Size & Forecast, By Source, 2021 – 2032

   10.4.7.4.2 Aromatic Solvents Market Size & Forecast, By Product, 2021 – 2032

   10.4.7.4.3 Aromatic Solvents Market Size & Forecast, By Livestock, 2021 – 2032

   10.4.7.4.4 Aromatic Solvents Market Size & Forecast, By Form, 2021 – 2032

   10.4.7.4.5 Aromatic Solvents Market Size & Forecast, By End-user, 2021 – 2032

  10.4.7.5 Australia

   10.4.7.5.1 Aromatic Solvents Market Size & Forecast, By Source, 2021 – 2032

   10.4.7.5.2 Aromatic Solvents Market Size & Forecast, By Product, 2021 – 2032

   10.4.7.5.3 Aromatic Solvents Market Size & Forecast, By Livestock, 2021 – 2032

   10.4.7.5.4 Aromatic Solvents Market Size & Forecast, By Form, 2021 – 2032

   10.4.7.5.5 Aromatic Solvents Market Size & Forecast, By End-user, 2021 – 2032

  10.4.7.6 ASEAN Countries

   10.4.7.6.1 Aromatic Solvents Market Size & Forecast, By Source, 2021 – 2032

   10.4.7.6.2 Aromatic Solvents Market Size & Forecast, By Product, 2021 – 2032

   10.4.7.6.3 Aromatic Solvents Market Size & Forecast, By Livestock, 2021 – 2032

   10.4.7.6.4 Aromatic Solvents Market Size & Forecast, By Form, 2021 – 2032

   10.4.7.6.5 Aromatic Solvents Market Size & Forecast, By End-user, 2021 – 2032

  10.4.7.7 Rest of Asia-Pacific

   10.4.7.7.1 Aromatic Solvents Market Size & Forecast, By Source, 2021 – 2032

   10.4.7.7.2 Aromatic Solvents Market Size & Forecast, By Product, 2021 – 2032

   10.4.7.7.3 Aromatic Solvents Market Size & Forecast, By Livestock, 2021 – 2032

   10.4.7.7.4 Aromatic Solvents Market Size & Forecast, By Form, 2021 – 2032

   10.4.7.7.5 Aromatic Solvents Market Size & Forecast, By End-user, 2021 – 2032

10.5 Latin America

 10.5.1 Key Trends

 10.5.2 Aromatic Solvents Market Size & Forecast, By Source, 2021 – 2032

 10.5.3 Aromatic Solvents Market Size & Forecast, By Product, 2021 – 2032

 10.5.4 Aromatic Solvents Market Size & Forecast, By Livestock, 2021 – 2032

 10.5.5 Aromatic Solvents Market Size & Forecast, By Form, 2021 – 2032

 10.5.6 Aromatic Solvents Market Size & Forecast, By End-user, 2021 – 2032

 10.5.7 Aromatic Solvents Market Size & Forecast, By Country, 2021 – 2032

  10.5.7.1 Brazil

   10.5.7.1.1 Aromatic Solvents Market Size & Forecast, By Source, 2021 – 2032

   10.5.7.1.2 Aromatic Solvents Market Size & Forecast, By Product, 2021 – 2032

   10.5.7.1.3 Aromatic Solvents Market Size & Forecast, By Livestock, 2021 – 2032

   10.5.7.1.4 Aromatic Solvents Market Size & Forecast, By Form, 2021 – 2032

   10.5.7.1.5 Aromatic Solvents Market Size & Forecast, By End-user, 2021 – 2032

  10.5.7.2 Argentina

   10.5.7.2.1 Aromatic Solvents Market Size & Forecast, By Source, 2021 – 2032

   10.5.7.2.2 Aromatic Solvents Market Size & Forecast, By Product, 2021 – 2032

   10.5.7.2.3 Aromatic Solvents Market Size & Forecast, By Livestock, 2021 – 2032

   10.5.7.2.4 Aromatic Solvents Market Size & Forecast, By Form, 2021 – 2032

   10.5.7.2.5 Aromatic Solvents Market Size & Forecast, By End-user, 2021 – 2032

  10.5.7.3 Mexico

   10.5.7.3.1 Aromatic Solvents Market Size & Forecast, By Source, 2021 – 2032

   10.5.7.3.2 Aromatic Solvents Market Size & Forecast, By Product, 2021 – 2032

   10.5.7.3.3 Aromatic Solvents Market Size & Forecast, By Livestock, 2021 – 2032

   10.5.7.3.4 Aromatic Solvents Market Size & Forecast, By Form, 2021 – 2032

   10.5.7.3.5 Aromatic Solvents Market Size & Forecast, By End-user, 2021 – 2032

  10.5.7.4 Colombia

   10.5.7.4.1 Aromatic Solvents Market Size & Forecast, By Source, 2021 – 2032

   10.5.7.4.2 Aromatic Solvents Market Size & Forecast, By Product, 2021 – 2032

   10.5.7.4.3 Aromatic Solvents Market Size & Forecast, By Livestock, 2021 – 2032

   10.5.7.4.4 Aromatic Solvents Market Size & Forecast, By Form, 2021 – 2032

   10.5.7.4.5 Aromatic Solvents Market Size & Forecast, By End-user, 2021 – 2032

  10.5.7.5 Rest of Latin America

   10.5.7.5.1 Aromatic Solvents Market Size & Forecast, By Source, 2021 – 2032

   10.5.7.5.2 Aromatic Solvents Market Size & Forecast, By Product, 2021 – 2032

   10.5.7.5.3 Aromatic Solvents Market Size & Forecast, By Livestock, 2021 – 2032

   10.5.7.5.4 Aromatic Solvents Market Size & Forecast, By Form, 2021 – 2032

   10.5.7.5.5 Aromatic Solvents Market Size & Forecast, By End-user, 2021 – 2032

10.6 Middle East & Africa

 10.6.1 Key Trends

 10.6.2 Aromatic Solvents Market Size & Forecast, By Source, 2021 – 2032

 10.6.3 Aromatic Solvents Market Size & Forecast, By Product, 2021 – 2032

 10.6.4 Aromatic Solvents Market Size & Forecast, By Livestock, 2021 – 2032

 10.6.5 Aromatic Solvents Market Size & Forecast, By Form, 2021 – 2032

 10.6.6 Aromatic Solvents Market Size & Forecast, By End-user, 2021 – 2032

 10.6.7 Aromatic Solvents Market Size & Forecast, By Country, 2021 – 2032

  10.6.7.1 UAE

   10.6.7.1.1 Aromatic Solvents Market Size & Forecast, By Source, 2021 – 2032

   10.6.7.1.2 Aromatic Solvents Market Size & Forecast, By Product, 2021 – 2032

   10.6.7.1.3 Aromatic Solvents Market Size & Forecast, By Livestock, 2021 – 2032

   10.6.7.1.4 Aromatic Solvents Market Size & Forecast, By Form, 2021 – 2032

   10.6.7.1.5 Aromatic Solvents Market Size & Forecast, By End-user, 2021 – 2032

  10.6.7.2 Saudi Arabia

   10.6.7.2.1 Aromatic Solvents Market Size & Forecast, By Source, 2021 – 2032

   10.6.7.2.2 Aromatic Solvents Market Size & Forecast, By Product, 2021 – 2032

   10.6.7.2.3 Aromatic Solvents Market Size & Forecast, By Livestock, 2021 – 2032

   10.6.7.2.4 Aromatic Solvents Market Size & Forecast, By Form, 2021 – 2032

   10.6.7.2.5 Aromatic Solvents Market Size & Forecast, By End-user, 2021 – 2032

  10.6.7.3 Qatar

   10.6.7.3.1 Aromatic Solvents Market Size & Forecast, By Source, 2021 – 2032

   10.6.7.3.2 Aromatic Solvents Market Size & Forecast, By Product, 2021 – 2032

   10.6.7.3.3 Aromatic Solvents Market Size & Forecast, By Livestock, 2021 – 2032

   10.6.7.3.4 Aromatic Solvents Market Size & Forecast, By Form, 2021 – 2032

   10.6.7.3.5 Aromatic Solvents Market Size & Forecast, By End-user, 2021 – 2032

  10.6.7.4 Egypt

   10.6.7.4.1 Aromatic Solvents Market Size & Forecast, By Source, 2021 – 2032

   10.6.7.4.2 Aromatic Solvents Market Size & Forecast, By Product, 2021 – 2032

   10.6.7.4.3 Aromatic Solvents Market Size & Forecast, By Livestock, 2021 – 2032

   10.6.7.4.4 Aromatic Solvents Market Size & Forecast, By Form, 2021 – 2032

   10.6.7.4.5 Aromatic Solvents Market Size & Forecast, By End-user, 2021 – 2032

  10.6.7.5 South Africa

   10.6.7.5.1 Aromatic Solvents Market Size & Forecast, By Source, 2021 – 2032

   10.6.7.5.2 Aromatic Solvents Market Size & Forecast, By Product, 2021 – 2032

   10.6.7.5.3 Aromatic Solvents Market Size & Forecast, By Livestock, 2021 – 2032

   10.6.7.5.4 Aromatic Solvents Market Size & Forecast, By Form, 2021 – 2032

   10.6.7.5.5 Aromatic Solvents Market Size & Forecast, By End-user, 2021 – 2032

  10.6.7.6 Rest of Middle East & Africa

   10.6.7.6.1 Aromatic Solvents Market Size & Forecast, By Source, 2021 – 2032

   10.6.7.6.2 Aromatic Solvents Market Size & Forecast, By Product, 2021 – 2032

   10.6.7.6.3 Aromatic Solvents Market Size & Forecast, By Livestock, 2021 – 2032

   10.6.7.6.4 Aromatic Solvents Market Size & Forecast, By Form, 2021 – 2032

   10.6.7.6.5 Aromatic Solvents Market Size & Forecast, By End-user, 2021 – 2032

11. Competitive Landscape

 11.1 Key Players' Positioning

 11.2 Competitive Developments

  11.2.1 Key Strategies Adopted (%), By Key Players, 2024

  11.2.2 Year-Wise Strategies & Development, 2021 – 2025

  11.2.3 Number Of Strategies Adopted By Key Players, 2024

 11.3 Market Share Analysis, 2024

 11.4 Product/Service & Application Benchmarking

  11.4.1 Product/Service Specifications & Features By Key Players

  11.4.2 Product/Service Heatmap By Key Players

  11.4.3 Application Heatmap By Key Players

 11.5 Industry Start-Up & Innovation Landscape

 11.6 Key Company Profiles

11.6 Key Company Profiles

 11.6.1 Adisseo France SAS

  11.6.1.1 Company Overview & Snapshot

  11.6.1.2 Product/Service Portfolio

  11.6.1.3 Key Company Financials

  11.6.1.4 SWOT Analysis

 11.6.2 Nutriad International NV

  11.6.2.1 Company Overview & Snapshot

  11.6.2.2 Product/Service Portfolio

  11.6.2.3 Key Company Financials

  11.6.2.4 SWOT Analysis

 11.6.3 Kemin Industries, Inc.

  11.6.3.1 Company Overview & Snapshot

  11.6.3.2 Product/Service Portfolio

  11.6.3.3 Key Company Financials

  11.6.3.4 SWOT Analysis

 11.6.4 Pancosma SA

  11.6.4.1 Company Overview & Snapshot

  11.6.4.2 Product/Service Portfolio

  11.6.4.3 Key Company Financials

  11.6.4.4 SWOT Analysis

 11.6.5 Phytobiotics Futterzusatzstoffe GmbH

  11.6.5.1 Company Overview & Snapshot

  11.6.5.2 Product/Service Portfolio

  11.6.5.3 Key Company Financials

  11.6.5.4 SWOT Analysis

 11.6.6 Prinova Group LLC

  11.6.6.1 Company Overview & Snapshot

  11.6.6.2 Product/Service Portfolio

  11.6.6.3 Key Company Financials

  11.6.6.4 SWOT Analysis

 11.6.7 Grupo Ferrer Internacional, S.A.

  11.6.7.1 Company Overview & Snapshot

  11.6.7.2 Product/Service Portfolio

  11.6.7.3 Key Company Financials

  11.6.7.4 SWOT Analysis

 11.6.8 Tanke International Group

  11.6.8.1 Company Overview & Snapshot

  11.6.8.2 Product/Service Portfolio

  11.6.8.3 Key Company Financials

  11.6.8.4 SWOT Analysis

 11.6.9 Diana Foods

  11.6.9.1 Company Overview & Snapshot

  11.6.9.2 Product/Service Portfolio

  11.6.9.3 Key Company Financials

  11.6.9.4 SWOT Analysis

 11.6.10 Ensign-Bickford Industries Inc.

  11.6.10.1 Company Overview & Snapshot

  11.6.10.2 Product/Service Portfolio

  11.6.10.3 Key Company Financials

  11.6.10.4 SWOT Analysis

 11.6.11 Kent Nutrition Group

  11.6.11.1 Company Overview & Snapshot

  11.6.11.2 Product/Service Portfolio

  11.6.11.3 Key Company Financials

  11.6.11.4 SWOT Analysis

 11.6.12 Novus International, Inc.

  11.6.12.1 Company Overview & Snapshot

  11.6.12.2 Product/Service Portfolio

  11.6.12.3 Key Company Financials

  11.6.12.4 SWOT Analysis

 11.6.13 Alltech, Inc.

  11.6.13.1 Company Overview & Snapshot

  11.6.13.2 Product/Service Portfolio

  11.6.13.3 Key Company Financials

  11.6.13.4 SWOT Analysis

 11.6.14 Elanco Animal Health

  11.6.14.1 Company Overview & Snapshot

  11.6.14.2 Product/Service Portfolio

  11.6.14.3 Key Company Financials

  11.6.14.4 SWOT Analysis

 11.6.15 Afgri Animal Feeds

  11.6.15.1 Company Overview & Snapshot

  11.6.15.2 Product/Service Portfolio

  11.6.15.3 Key Company Financials

  11.6.15.4 SWOT Analysis

 11.6.16 Solvay S.A.

  11.6.16.1 Company Overview & Snapshot

  11.6.16.2 Product/Service Portfolio

  11.6.16.3 Key Company Financials

  11.6.16.4 SWOT Analysis

 11.6.17 Intertek

  11.6.17.1 Company Overview & Snapshot

  11.6.17.2 Product/Service Portfolio

  11.6.17.3 Key Company Financials

  11.6.17.4 SWOT Analysis

 11.6.18 Omic USA Inc.

  11.6.18.1 Company Overview & Snapshot

  11.6.18.2 Product/Service Portfolio

  11.6.18.3 Key Company Financials

  11.6.18.4 SWOT Analysis

 11.6.19 Bruker BioSpin GmbH

  11.6.19.1 Company Overview & Snapshot

  11.6.19.2 Product/Service Portfolio

  11.6.19.3 Key Company Financials

  11.6.19.4 SWOT Analysis

 11.6.20 Dairy One Cooperative, Inc.

  11.6.20.1 Company Overview & Snapshot

  11.6.20.2 Product/Service Portfolio

  11.6.20.3 Key Company Financials

  11.6.20.4 SWOT Analysis

12. Analyst Recommendations

 12.1 SNS Insider Opportunity Map

 12.2 Industry Low-Hanging Fruit Assessment

 12.3 Market Entry & Growth Strategy

 12.4 Analyst Viewpoint & Suggestions On Market Growth

13. Assumptions

14. Disclaimer

15. Appendix

 15.1 List Of Tables

 15.2 List Of Figures

An accurate research report requires proper strategizing as well as implementation. There are multiple factors involved in the completion of good and accurate research report and selecting the best methodology to compete the research is the toughest part. Since the research reports we provide play a crucial role in any company’s decision-making process, therefore we at SNS Insider always believe that we should choose the best method which gives us results closer to reality. This allows us to reach at a stage wherein we can provide our clients best and accurate investment to output ratio.

Each report that we prepare takes a timeframe of 350-400 business hours for production. Starting from the selection of titles through a couple of in-depth brain storming session to the final QC process before uploading our titles on our website we dedicate around 350 working hours. The titles are selected based on their current market cap and the foreseen CAGR and growth.


The 5 steps process:

Step 1: Secondary Research:

Secondary Research or Desk Research is as the name suggests is a research process wherein, we collect data through the readily available information. In this process we use various paid and unpaid databases which our team has access to and gather data through the same. This includes examining of listed companies’ annual reports, Journals, SEC filling etc. Apart from this our team has access to various associations across the globe across different industries. Lastly, we have exchange relationships with various university as well as individual libraries.

Secondary Research

Step 2: Primary Research

When we talk about primary research, it is a type of study in which the researchers collect relevant data samples directly, rather than relying on previously collected data.  This type of research is focused on gaining content specific facts that can be sued to solve specific problems. Since the collected data is fresh and first hand therefore it makes the study more accurate and genuine.

We at SNS Insider have divided Primary Research into 2 parts.

Part 1 wherein we interview the KOLs of major players as well as the upcoming ones across various geographic regions. This allows us to have their view over the market scenario and acts as an important tool to come closer to the accurate market numbers. As many as 45 paid and unpaid primary interviews are taken from both the demand and supply side of the industry to make sure we land at an accurate judgement and analysis of the market.

This step involves the triangulation of data wherein our team analyses the interview transcripts, online survey responses and observation of on filed participants. The below mentioned chart should give a better understanding of the part 1 of the primary interview.

Primary Research

Part 2: In this part of primary research the data collected via secondary research and the part 1 of the primary research is validated with the interviews from individual consultants and subject matter experts.

Consultants are those set of people who have at least 12 years of experience and expertise within the industry whereas Subject Matter Experts are those with at least 15 years of experience behind their back within the same space. The data with the help of two main processes i.e., FGDs (Focused Group Discussions) and IDs (Individual Discussions). This gives us a 3rd party nonbiased primary view of the market scenario making it a more dependable one while collation of the data pointers.

Step 3: Data Bank Validation

Once all the information is collected via primary and secondary sources, we run that information for data validation. At our intelligence centre our research heads track a lot of information related to the market which includes the quarterly reports, the daily stock prices, and other relevant information. Our data bank server gets updated every fortnight and that is how the information which we collected using our primary and secondary information is revalidated in real time.

Data Bank Validation

Step 4: QA/QC Process

After all the data collection and validation our team does a final level of quality check and quality assurance to get rid of any unwanted or undesired mistakes. This might include but not limited to getting rid of the any typos, duplication of numbers or missing of any important information. The people involved in this process include technical content writers, research heads and graphics people. Once this process is completed the title gets uploader on our platform for our clients to read it.

Step 5: Final QC/QA Process:

This is the last process and comes when the client has ordered the study. In this process a final QA/QC is done before the study is emailed to the client. Since we believe in giving our clients a good experience of our research studies, therefore, to make sure that we do not lack at our end in any way humanly possible we do a final round of quality check and then dispatch the study to the client.

Key Segments: 

By Source

  • Natural

  • Synthetic

By Product

  • Flavors

  • Sweeteners

  • Texturants

  • Others

By Livestock

  • Ruminant

  • Poultry

  • Swine

  • Aquaculture

  • Others

By Form

  • Dry

  • Liquid

By End-user

  • Commercial Feed Manufacturers

  • Farmers and Livestock Producers

  • Pet Food Companies

  • Aquaculture Operators

  • Others

Request for Segment Customization as per your Business Requirement: Segment Customization Request

Regional Coverage: 

North America

  • US

  • Canada

  • Mexico

Europe

  • Germany

  • France

  • UK

  • Italy

  • Spain

  • Poland

  • Turkey

  • Rest of Europe

Asia Pacific

  • China

  • India

  • Japan

  • South Korea

  • Singapore

  • Australia

  • Rest of Asia Pacific

Middle East & Africa

  • UAE

  • Saudi Arabia

  • Qatar

  • South Africa

  • Rest of Middle East & Africa

Latin America

  • Brazil

  • Argentina

  • Rest of Latin America

Request for Country Level Research Report: Country Level Customization Request

Available Customization 

With the given market data, SNS Insider offers customization as per the company’s specific needs. The following customization options are available for the report: 

  • Detailed Volume Analysis 

  • Criss-Cross segment analysis (e.g. Product X Application) 

  • Competitive Product Benchmarking 

  • Geographic Analysis 

  • Additional countries in any of the regions 

  • Customized Data Representation 

  • Detailed analysis and profiling of additional market players

Explore Key Insights.


  • Analyzes market trends, forecasts, and regional dynamics
  • Covers core offerings, innovations, and industry use cases
  • Profiles major players, value chains, and strategic developments
  • Highlights innovation trends, regulatory impacts, and growth opportunities
Request an Analyst Call