Fiber Optic Components Market Report Scope and Overview:
The Fiber Optic Components Market Size was valued at USD 31.51 billion in 2025 and is expected to reach USD 76.46 billion by 2035, growing at a CAGR of 9.27 % from 2026-2035.
The fiber optic components market is likely to benefit from the growing distribution of data centers, increasing internet penetration and data overload, increasing demand for bandwidth and reliability, and advances in fiber optic components systems. With the advent of technologies like 5G, cloud computing, and the Internet of Things (IoT), there is a rising demand for faster and more reliable data transmission. The implementation of the 5G technology is the next important milestone in the building of the global telecommunications system. In early 2024, 5G technology will be subscribed to more than 1.21 billion people around the globe, and by the year 2025, it is expected to reach around 2.48 billion. This means that at present over 40% of the global population can access 5G networks. Fiber optic networks offer superior performance compared to traditional copper-based networks, delivering higher data rates, lower latency, and greater immunity to electromagnetic interference.
Fiber Optic Components Market Size and Growth Projection:
-
Market Size in 2025: USD 31.51 Billion
-
Market Size by 2035: USD 76.46 Billion
-
CAGR: 9.27% from 2026 to 2035
-
Base Year: 2025
-
Forecast Period: 2026–2035
-
Historical Data: 2022–2024

Get more information on Fiber Optic Components Market - Request Sample Report
Fiber Optic Components Market Highlights:
-
Adhesive technologies are essential in fiber optic assembly, enabling reliable bonding of fibers, connectors, lenses, and components, improving manufacturing efficiency and performance of optical networks.
-
China significantly increased exports of fiber optic cable, with a record 527,000 km shipped to Russia in August 2025, highlighting cross‑border supply dynamics and large‑scale cable deployment
-
The 14th China (Shenzhen) International Fiber Optic Cable & Optical Communication Exhibition (Apr 9‑11, 2026) will showcase next‑generation optical technologies (5G‑A, AI, 6G), expand industry chain collaboration, and present new products and networking trends.
-
South Korea’s fiber optic assembly market is expanding rapidly due to 5G and data center infrastructure growth, with projected long‑term value increases and competitive manufacturing innovation.
-
Optical connectivity trends include rising regional demand for fiber optic components, cables, and accessories to support smart cities, cloud services, and AI‑driven network deployments.
U.S. Fiber Optic Components Market Size Outlook
The U.S. Fiber Optic Components Market size is projected to grow from USD 9.77 Billion in 2025E to reach USD 23.70 Billion by 2035. This estimation assumes the United States maintains a historical share of approximately 31% of the global market, driven by its advanced telecommunications infrastructure and early adoption of data center technologies. Growth is driven by massive investments in 5G network densification, the expansion of hyperscale data centers for cloud computing, and the increasing deployment of fiber-to-the-home (FTTH) services. Rising bandwidth demand from AI workloads and high-speed connectivity requirements further accelerate market adoption, enabling faster, more reliable data transmission across telecom, enterprise, and industrial sectors.

Fiber Optic Components Market Drivers:
-
Growth of telecom infrastructure in developing economies.
The growth of the telecom infrastructure of developing economies seems to be a significant driving force. Emerging markets and developing countries are characterized by rapid urbanization and digitalization. The former transformation aspect contributes to an increased population density in urban areas. As a result, there is a growing need for advanced levels of communication in big cities. The latter aspect leads to the development of digital technologies and provides people with a wide display of educative signals. Fiber optic components play a critical role in the establishment of high-speed networks that ensure fast and scalable data transfer. Thus, the official administrations and private companies in developing countries are heavily funding the growing demand for fiber optic networks. They enable the use of high-speed internet, mobile communication, and other communicative modernities. Moreover, local governments in rural areas are also concerned about the expansion of fiber optic networks since they need to avoid the digital divide and involve people in both the social and economic development of the country.
-
Fiber optic components are becoming increasingly popular in the digital signage business.
The growing popularity of the use of fiber optic components in the digital signage industry is their superior performance characteristics. The specifics of digital signage, where the quality of its visual output plays a critical role for this equipment. The displays may be used for various purposes, from advertising to information dissemination, and, therefore, require high-quality visual characteristics from their functioning. The fiber optic technology ensures that cable connections transmit data intact and without loss. This high-quality transmission is based on fiber optics’ high bandwidth and data transmission speeds, which implies handling large amounts of data required to create detailed and, at times, even high-resolution images. The benefits of the transmission quality with fiber optics ensure that displays continue to show clear and vivid images without any issues that may arise over time, such as picture quality loss at long distances. Moreover, fiber optic cables are less susceptible to electromagnetic interference, which affects the denial of the integrity of transmitted information in both long and short distances, providing digital signage’s stable operations.
Fiber Optic Components Market Restraints:
-
The huge cost of installation and difficulty of installing in different terrains.
The operations regarding the deployment of fiber optic networks, especially those spanning large distances and/or relatively big urban areas, are complicated, and, therefore, the price is increased accordingly. Moreover, this includes the need for special equipment and correspondingly trained personnel, which contributes to the growing costs. The installation across various terrains is hard to do. First of all, toiling across rugged, mountainous, or densely populated city environments creates several challenges. Secondly, both from a time perspective and from a technology-related one, the process of installing fiber optic cables is expensive in case it is conducted in rural or remote regions. The absence of previous conduits requires substantial groundwork, or using the corresponding vehicles or machinery, which are expensive and time-consuming to use is necessary to secure the cables either in the ground or in water.
Fiber Optic Components Market Segment Analysis:
By Type
The transceivers segment held a major market share of over 35% in 2025 and it is also going to retain its growth rate during the forecast period 2026-2035. Transceivers are crucial tools in ensuring an effective, fast data transfer, which makes it necessary for high-speed data centers, as well as other clouding environments, which are expanding rapidly. More organizations and service providers search for larger bandwidths, to meet the needs of substantial data they have to process. The trend is also accelerated by the deployment of 5G networks, as their actively increasing speed presupposes dense fiber-optic grids to ensure a possibility of data being transferred. The increase in demand for transceivers has been boosted due to modern communication systems requiring ever-increasing data rates, such as 100G, 400G, and beyond. Moreover, transceivers are crucial for the general performance and scalability to meet modern digital communities’ demands. For these reasons, transceivers are not only the top revenue-generating destination in the Fiber Optic Components Market but the fastest-rising one, as well.
By Data Rate
The >100 Gbps segment led the market in 2025 with a market share of over 39%. Fiber optic components that support data rates exceeding 100 Gbps already dominate the market. Their high share is determined by the growing demand for high-bandwidth applications and the rapid development of data-intensive industries, such as telecommunications, data centers, and high-performance computing. With the need for faster data transfer that is also escalating, high-speed cloud computing, streaming services, and processing of massive data amounts cannot be done without such components.
The 10 Gbps to 40 Gbps segment is the fastest-growing segment during 2026-2035. The demand for 10-40 Gbps data transmission in enterprise and metro networks as well as in data centers reflects the effects of broader industry trends. The telecommunications industry is one of the sectors where traffic increase has been particularly rapid and directly observable. Data has become a more and more important part of modern-day telephone and radio communications, with voice transmissions transitioning from analog systems to digital data transmission.

By Application
The analytical and medical equipment segment held a market share of above 40%. The rise in fiber optic technology adoption is a key factor in driving this leadership position, as they outperform other options in analytical and diagnostic applications. Fiber optics provide precise diagnostic capabilities and fast data transfer, essential for accurate medical analysis and real-time diagnostics.
The distributed sensing segment is expected to have a faster growth rate during 2026-2035. The increasing use of distributed fiber optic sensors in sectors like civil engineering, environmental monitoring, and infrastructure management has led to this growth. Utilizing fiber optics, distributed sensing technologies collect data on temperature, strain, and pressure across vast areas, offering more detailed information than conventional sensors.
Fiber Optic Components Market Regional Analysis:
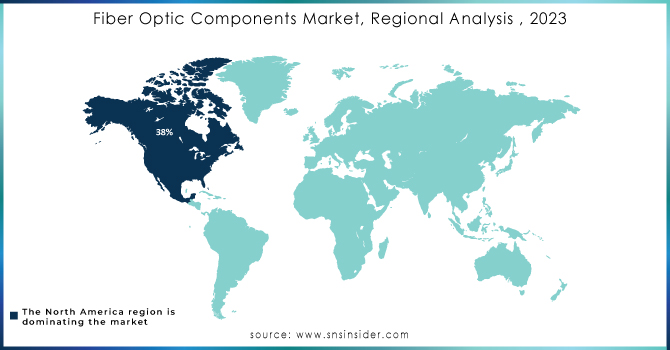
North America Fiber Optic Components Market Trends:
North America dominated the market with a market share of 38% in 2023, with the U.S. and Canada being at the forefront. This is due to the countries’ high technological infrastructure advanced use of fiber optic technology and the money invested in telecommunications and data centers. The demand for high-speed Internet in combination with the development of the cloud business and the construction of a large number of 5G networks are some of the pushers of the market. The presence of significant metropolitan areas and major tech clusters constantly investing in their fiber-optic networks supports the segment’s growth.

Get Customized Report as per your Business Requirement - Request For Customized Report
Asia-Pacific Fiber Optic Components Market Trends:
The Asia-Pacific is the fastest-growing region during 2026-2035, as the extensive urbanization and industrialization of the region is closely related to the development of the digital economy which, in turn, requires the presence of high-speed data transmission. Countries such as China, India, and Japan, in particular, continue to heavily invest in the expansion of their fiber optics for an ever-growing number of new technologies. The former has widespread national programs to expand its fiber network and the implementation of new programs within the new generation of technology.
Europe Fiber Optic Components Market Trends:
Europe is witnessing steady growth in fiber optic components due to strong government initiatives for broadband expansion and 5G rollout. Countries such as Germany, France, and the UK are upgrading legacy networks and investing in next-generation optical infrastructure to support smart city development, high-speed connectivity, and industrial automation.
Latin America Fiber Optic Components Market Trends:
The Latin American market is growing moderately, with Brazil, Mexico, and Chile leading fiber optic adoption. Investments in broadband infrastructure, rural connectivity projects, and 5G deployment are driving market expansion. Urbanization and rising demand for digital services in emerging economies are further supporting growth in the region.
Middle East & Africa Fiber Optic Components Market Trends:
The Middle East & Africa region is experiencing growth driven by large-scale investments in telecommunications infrastructure and smart city initiatives. Countries such as the UAE, Saudi Arabia, and South Africa are deploying fiber networks to support 5G, cloud computing, and digital transformation in government, business, and residential sectors.
Fiber Optic Components Market Competitive Landscape:
Broadcom Inc. is a global technology leader, founded in 1961, specializing in semiconductor and infrastructure software solutions. The company designs and supplies high-performance optical components, networking chips, broadband, and wireless solutions for data centers, enterprise, and AI infrastructure. Broadcom is recognized for innovation, scalability, and global market leadership.
-
In March 2025, Broadcom Inc. announced at OFC 2025 the expansion of its optical interconnect solutions for AI infrastructure, including co-packaged optics, 200G/lane DSP, 400G optics, PCIe Gen6 over optics, and 800G AEC retimers, enabling high-bandwidth, low-power, and scalable AI networks.
Corning Incorporated is a global technology company, founded in 1851, specializing in glass science, optical physics, and materials innovation. The company designs and manufactures optical fiber, cables, connectivity solutions, and specialty glass for data centers, telecommunications, consumer electronics, and life sciences, enabling high-performance networks and advanced technological applications worldwide.
-
In May 2025, Corning Incorporated announced a collaboration with Broadcom Inc. on co-packaged optics (CPO) infrastructure for AI data centers, supplying advanced optical components for Broadcom’s 51.2 Tbps Bailly Ethernet switch, enhancing bandwidth, density, and power efficiency for large-scale AI clusters.
Fiber Optic Components Companies are:
-
Sumitomo Electric Industries, Ltd.
-
II‑VI Incorporated
-
Broadcom Inc.
-
Accelink Technologies Co., Ltd.
-
Fujitsu Optical Components
-
Oclaro
-
EMCORE Corporation
-
Furukawa Electric Co., Ltd.
-
Corning Incorporated
-
Coherent Corp.
-
Hexatronic Group
-
O‑Net Technologies (Shenzhen) Group Co., Ltd.
-
Smiths Interconnect
-
Source Photonics
-
Amphenol Corporation
-
TE Connectivity Plc
-
Huber+Suhner
-
Clearfield Inc.
| Report Attributes | Details |
|---|---|
| Market Size in 2025 | USD 31.51 Billion |
| Market Size by 2035 | USD 76.46 Billion |
| CAGR | CAGR of 9.27% From 2026 to 2035 |
| Base Year | 2025 |
| Forecast Period | 2026-2035 |
| Historical Data | 2022-2024 |
| Report Scope & Coverage | Market Size, Segments Analysis, Competitive Landscape, Regional Analysis, DROC & SWOT Analysis, Forecast Outlook |
| Key Segments | • By Type (Cables, Active Optical Cables, Splitters, Circulators, Amplifiers, Connectors, Transceivers) • By Data Rate (<10Gbps, 10 Gbps to 40Gbps, 41 Gbps to 100Gbps) • By Application (Analytical and Medical Equipment, Distributed Sensing, Lighting, Communications) |
| Regional Analysis/Coverage | North America (US, Canada), Europe (Germany, UK, France, Italy, Spain, Russia, Poland, Rest of Europe), Asia Pacific (China, India, Japan, South Korea, Australia, ASEAN Countries, Rest of Asia Pacific), Middle East & Africa (UAE, Saudi Arabia, Qatar, South Africa, Rest of Middle East & Africa), Latin America (Brazil, Argentina, Mexico, Colombia, Rest of Latin America). |
| Company Profiles | Lumentum Holdings Inc., Sumitomo Electric Industries, II‑VI Incorporated, Broadcom Inc., Accelink Technologies Co., Ltd., Acacia Communications, Inc., Fujitsu Optical Components, Oclaro, EMCORE Corporation, Furukawa Electric Co., Ltd., Corning Incorporated, Coherent Corp., Hexatronic Group, O‑Net Technologies (Shenzhen) Group Co., Ltd., Smiths Interconnect, Source Photonics, Amphenol Corporation, TE Connectivity Plc, Huber+Suhner, Clearfield Inc. |
Get in Touch
