Fiber Reinforced Polymer Composites Market Report Scope & Overview:
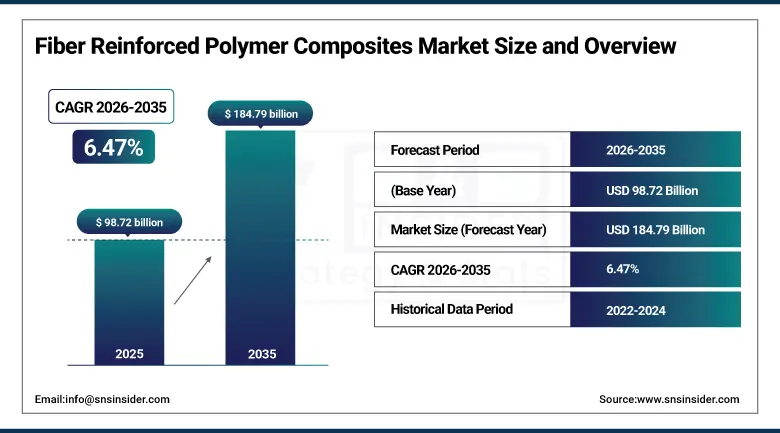
The Fiber Reinforced Polymer Composites Market was valued at USD 98.72 billion in 2025 and is expected to reach USD 184.79 billion by 2035, growing at a CAGR of 6.47% from 2026–2035.
The global Fiber Reinforced Polymer (FRP) Composites Market is undergoing sustained, broad-based expansion as the engineering materials industry accelerates its transition from conventional metals toward high-performance composite materials that deliver superior strength-to-weight ratios, corrosion immunity, design flexibility, and long-term durability that traditional steel, aluminium, and concrete cannot match across the demanding application environments of aerospace, automotive lightweighting, civil infrastructure, renewable energy, and marine engineering.
Market Size and Forecast
-
Market Size in 2025: USD 98.72 Billion
-
Market Size by 2035: USD 184.79 Billion
-
CAGR: 6.47% from 2026 to 2035
-
Base Year: 2025
-
Forecast Period: 2026–2035
-
Historical Data: 2022–2024
To Get more information on Fiber Reinforced Polymer Composites Market - Request Free Sample Report
Fiber Reinforced Polymer Composites Market Trends
-
Accelerating adoption of carbon fibre reinforced polymer in automotive body structural components, floor systems, and battery enclosures for electric vehicles, where each kilogram of weight reduction through CFRP substitution for steel recovers 5 to 8 kilometres of EV driving range, creating compelling economic cases for composite investment in premium and increasingly mid-range EV platforms.
-
Growing investment in thermoplastic composite materials for automotive and aerospace applications, where polypropylene, polyamide, and PEEK matrix composites enable injection moulding and stamp forming processing that dramatically reduces part cycle times relative to thermoset prepreg curing, enabling the production volumes required for automotive platforms.
-
Rising adoption of pultrusion manufacturing for infrastructure applications including composite rebar, bridge decking panels, utility poles, and cable trays where the continuous, high-speed pultrusion process enables cost-competitive production of corrosion-immune structural profiles at the volumes that civil infrastructure programmes require.
-
Expanding glass fibre reinforced polymer adoption in construction applications including composite cladding panels, structural insulated panels, and blast-resistant building systems as architects and engineers discover FRP's design freedom, thermal insulation capability, and indefinite service life without painting or maintenance.
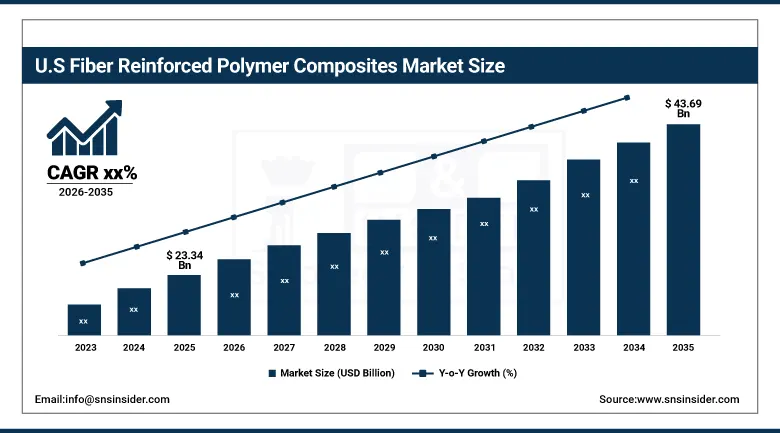
U.S. Fiber Reinforced Polymer Composites Market was valued at USD 23.34 billion in 2025 and is expected to reach USD 43.69 billion by 2035, supported by aerospace procurement, automotive lightweighting investment, and infrastructure renewal programmes.
The United States represents the world's most technically advanced FRP composites market, anchored by the extraordinary composite material demand of the U.S. aerospace and defence industry that has specified composite primary structure in the B-2, F-22, F-35, and Boeing 787 and 777X programmes, creating the world's most sophisticated composite manufacturing supply chain. The automotive composite market is expanding rapidly as General Motors, Ford, and Stellantis pursue lightweighting for EV range improvement, while Tesla and the new generation of EV startups specify composite body panels and structural components as standard architecture.
Fiber Reinforced Polymer Composites Market Segment Insights
-
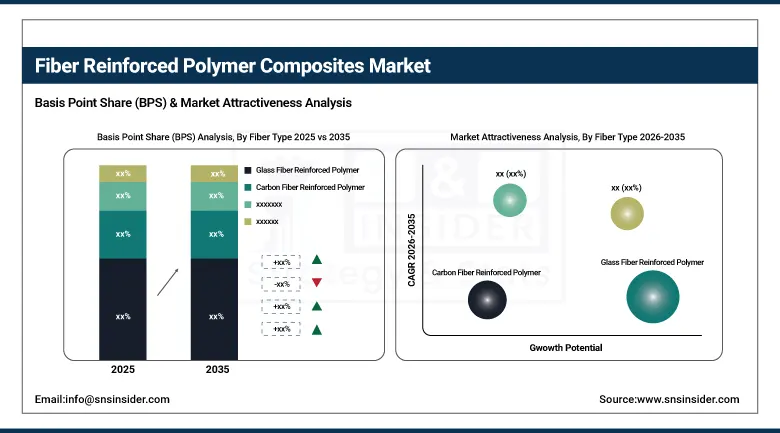
According to Fiber Type, Glass Fiber Reinforced Polymer dominated with the largest market share in 2025 due to its cost-effectiveness and broad application versatility across construction, automotive, wind energy, and marine sectors; Carbon Fiber Reinforced Polymer is the fastest-growing fiber type driven by aerospace, premium automotive EV, and high-performance structural applications.
-
In terms of Resin Type, Thermoset resins dominated with approximately 71% of revenues in 2025 due to superior mechanical properties and established manufacturing process validation; Thermoplastic is the fastest-growing resin type at approximately 6.15% CAGR driven by recyclability requirements and automotive high-volume processing needs.
-
By Application, Aerospace and Defense retained a large revenue share through its high-performance structural composite specification; Wind Energy and Automotive and Transportation are the fastest-growing applications driven by rotor blade length extension and EV lightweighting investment.
Fiber Reinforced Polymer Composites Market Segment Analysis
By Fiber Type: Glass Fiber Reinforced Polymer dominates, Carbon Fiber grows fastest
Glass Fiber Reinforced Polymer retained the dominant fiber type position in 2025, representing the largest volume and revenue share of the FRP composites market through its unique combination of adequate mechanical properties, excellent chemical resistance, low raw material cost, and manufacturing process compatibility that makes it the preferred composite material for cost-sensitive, high-volume applications in construction, automotive body panels, wind turbine blades, marine hulls, pipe and tank systems, and electrical enclosures.
Carbon Fiber Reinforced Polymer is the fastest-growing fiber type through 2035, driven by the aviation, aerospace, and premium automotive sectors' uncompromising demand for the highest possible stiffness-to-weight and strength-to-weight performance that only carbon fibre composite construction can deliver within the structural performance envelopes of Boeing 787, Airbus A350, F-35, and Tesla Roadster body structure applications. CFRP's specific modulus exceeding 180 GPa enables structural designs that reduce component weight by 20 to 30% relative to aluminium equivalents, while its fatigue resistance eliminates the inspection-intensive maintenance cycles that metal fatigue in aircraft structures imposes.
By Resin Type: Thermoset dominates, Thermoplastic grows fastest
Thermoset resins retained the dominant position with approximately 71% of FRP Composites Market revenues in 2025, encompassing epoxy, polyester, vinyl ester, and phenolic matrix systems that are fully cross-linked during the curing process, creating an irreversible three-dimensional polymer network that provides superior chemical resistance, elevated temperature performance, and precise fibre-to-matrix adhesion that the most demanding aerospace, industrial, and marine composite applications require.
Thermoplastic composites are the fastest-growing resin type at approximately 6.15% CAGR through 2035, driven by the automotive industry's circular economy mandates requiring end-of-life composite material recyclability and by the processing speed advantages of thermoplastic stamp forming and injection moulding relative to thermoset cure cycles that cannot meet automotive production volumes.
By Application: Aerospace and Defense leads, Wind Energy and Automotive grow fastest
Aerospace and Defense retained a major application position in the FRP Composites Market in 2025 through its specification of the highest-performance, highest-value composite materials in the most demanding structural applications, where the cost of composite manufacturing is outweighed by the operational fuel savings, payload increase, and mission performance improvement that structural weight reduction provides. Military aerospace programmes specify CFRP primary structure across fighter aircraft, unmanned aerial vehicles, missiles, and space launch vehicles where structural mass is a mission performance determinant rather than merely an economic optimisation parameter.
Wind Energy is among the fastest-growing FRP application segments, driven by the global wind power capacity expansion that requires an ever-increasing number of composite rotor blades at ever-increasing lengths, where the 80 to 100 metre blades now being deployed in offshore wind farms represent the most material-intensive single composite component manufactured in the world.
Market Regional Analysis
|
Region |
Major Country |
Share within Region (%) |
|---|---|---|
|
North America |
United States |
71% |
|
Europe |
Germany |
32% |
|
Asia Pacific |
China |
47% |
|
Middle East & Africa |
Saudi Arabia |
28% |
|
Latin America |
Brazil |
44% |
North America Fiber Reinforced Polymer Composites Market Insights
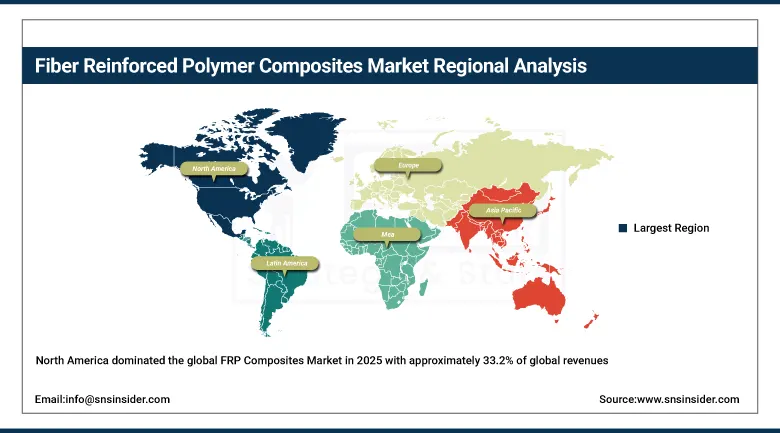
North America dominated the global FRP Composites Market in 2025 with approximately 33.2% of global revenues, anchored by the United States which accounted for approximately 71% of North American revenues at USD 23.34 billion. U.S. market leadership is driven by the world's most demanding aerospace and defence composite procurement, the largest automotive lightweighting investment programme, and the largest civil infrastructure replacement programme generating growing demand for corrosion-immune FRP structural profiles. Canada contributes through its aerospace supply chain participation and wind energy composite component manufacturing.
Get Customized Report as per Your Business Requirement - Enquiry Now
Asia Pacific Fiber Reinforced Polymer Composites Market Insights
Asia Pacific is the fastest-growing regional FRP composites market, driven by China's extraordinary wind energy deployment programme requiring the largest annual rotor blade composite volume consumption globally, India's rapidly expanding automotive manufacturing and construction sectors, Japan's advanced aerospace and automotive composite material development programmes, and South Korea's wind energy and shipbuilding composite adoption. China's domestic composite material manufacturer ecosystem, encompassing Zhongfu Shenying Carbon Fibre and SINOMA Science and Technology, is progressively displacing imported composite materials across wind energy and automotive applications, sustaining regional market development independent of import-dependent supply chains.
Europe Fiber Reinforced Polymer Composites Market Insights
Europe represents a technically sophisticated FRP composites market, anchored by Germany's automotive composite R&D leadership encompassing BMW's carbon fibre body structure programme and the national composites research network, combined with France's Airbus composite aircraft manufacturing operations that represent the world's most sophisticated civil aerospace composite production facility. EU sustainability directives driving thermoplastic composite recyclability development, the North Sea offshore wind programme requiring the world's longest composite rotor blades, and the European maritime industry's growing composite hull and superstructure adoption collectively sustain strong European FRP market development.
Latin America and MEA Fiber Reinforced Polymer Composites Market Insights
Latin America and MEA are growing FRP markets driven by wind energy infrastructure investment, construction sector adoption, and oil and gas pipe and tank applications. Brazil leads Latin American revenues at approximately 44% through its large wind energy programme requiring composite rotor blades and growing automotive composite adoption. MEA adoption is driven by Saudi Arabia's Vision 2030 renewable energy investment and the Gulf region's pipe and tank FRP composite demand for petrochemical and water infrastructure applications.
Market Growth Drivers:
Automotive EV lightweighting imperatives and wind energy rotor blade length extension creating structural demand for advanced composite materials replacing metals and concrete: The primary structural growth drivers for the FRP Composites Market are the simultaneous automotive industry electrification imperative that makes each kilogram of weight reduction through composite substitution directly recoverable as EV driving range, and the wind energy industry's rotor blade length extension requirement that makes glass and carbon hybrid composite the only practical construction material for the 80 to 100 metre blades of modern offshore wind turbines. These two structural forces create FRP demand at unprecedented production scales across two of the world's fastest-growing industrial sectors, sustaining the market's 6.47% CAGR across the 2026 to 2035 forecast period.
The U.S. generated USD 21.92 billion in FRP composites revenues in 2024 and is forecast to reach USD 35.85 billion by 2032, maintaining its 71% share of North American composites production, confirming that the world's most technically advanced FRP market continues to grow at attractive rates even from its already substantial base. This growth is fuelled by the material's unmatched strength-to-weight ratio, corrosion resistance, and adaptability for sustainable infrastructure and high-performance engineering applications that make FRP composites the default material evolution pathway across multiple major engineering application categories through the 2026 to 2035 forecast period.
Market Restraints
High raw material and manufacturing cost relative to conventional metals, complex quality control and non-destructive testing requirements, and limited recyclability of thermoset composite end-of-life waste: A significant restraint on the FRP Composites Market is the premium manufacturing cost of composite components relative to established steel and aluminium fabrication processes, particularly for carbon fibre composites where raw fibre costs, labour-intensive prepreg layup processes, and autoclave curing infrastructure create per-component costs that remain 3 to 5 times higher than equivalent metal parts in high-volume automotive applications. The end-of-life recyclability challenge of thermoset matrix composites, where the irreversible chemical cross-linking of cured epoxy and polyester matrices prevents conventional thermoplastic recycling, is creating regulatory and corporate sustainability pressure that limits thermoset composite adoption in applications where circular economy commitments require material recoverability.
Market Opportunities
Infrastructure corrosion-immune GFRP rebar adoption, offshore wind blade market expansion, and thermoplastic composite recycling solution development: The civil infrastructure renewal market represents one of the largest underpenetrated FRP composites opportunities, where the demonstrated 75-year maintenance-free service life of GFRP rebar relative to the 25 to 40-year deteriorating lifecycle of conventional steel rebar creates compelling whole-life cost cases for composite reinforcement in bridge decks, marine structures, and chemically aggressive industrial environments. The offshore wind industry's planned capacity expansion toward 300 GW by 2050 creates a rotor blade composite demand pipeline that will sustain exceptional FRP volume growth for the full forecast period. Thermoplastic composite recycling technology development, where chemical recycling, solvolysis, and mechanical reclamation processes progressively enable composite material recovery from end-of-life wind blades, aircraft structures, and automotive components, will progressively resolve the sustainability barrier limiting thermoset composite adoption in circular economy-committed applications.
Recent Developments:
-
2025: Hexcel Corporation launched its HexTow IM8 carbon fibre for next-generation aerospace applications, providing enhanced tensile strength and modulus properties targeting Boeing and Airbus composite primary structure programmes for future aircraft platforms.
-
2025: Toray Industries expanded its T800 and T1000 carbon fibre production capacity in Japan and the United States, responding to growing aerospace demand and supporting the Boeing 777X composite wing spar programme that represents the largest single aerospace composite component produced.
-
2025: Owens Corning launched a new range of glass fibre rovings optimised for wind energy blade infusion processes, providing improved fatigue resistance and faster wet-out rates that enable larger blade infusion in shorter cycle times for offshore wind rotor blade manufacturers.
Fiber Reinforced Polymer Composites Market Key Players
-
Toray Industries Inc.
-
Teijin Limited
-
Hexcel Corporation
-
SGL Carbon SE
-
Solvay SA
-
Owens Corning
-
Mitsubishi Chemical Group Corporation
-
Huntsman Corporation
-
Gurit Holding AG
-
Cytec Industries Inc. (Solvay)
-
Jushi Group Co. Ltd.
-
China Jushi Co. Ltd.
-
Saertex Group
-
Chomarat Groupe
-
Vectorply Corporation
-
Porcher Industries
-
Scott Bader Company Ltd.
-
DIAB Group
-
AOC LLC
-
Composites One LLC
Fiber Reinforced Polymer Composites Market Report Scope
| Report Attributes | Details |
|---|---|
| Market Size in 2025 | USD 98.72 Billion |
| Market Size by 2035 | USD 184.79 Billion |
| CAGR | CAGR of 6.47% From 2026 to 2035 |
| Base Year | 2025 |
| Forecast Period | 2026-2035 |
| Historical Data | 2022-2024 |
| Report Scope & Coverage | Market Size, Segments Analysis, Competitive Landscape, Regional Analysis, DROC & SWOT Analysis, Forecast Outlook |
| Key Segments | • By Fiber Type (Glass Fiber Reinforced Polymer, Carbon Fiber Reinforced Polymer, Aramid Fiber Reinforced Polymer, Basalt Fiber Reinforced Polymer, Others) • By Resin Type (Thermoset, Thermoplastic) • By Manufacturing Process (Pultrusion, Filament Winding, Resin Transfer Molding, Lay-Up, Injection Molding, Others) • By Application (Aerospace and Defense, Automotive and Transportation, Construction and Infrastructure, Wind Energy, Marine, Pipe and Tank, Electrical and Electronics, Others) |
| Regional Analysis/Coverage | North America (US, Canada), Europe (Germany, UK, France, Italy, Spain, Russia, Poland, Rest of Europe), Asia Pacific (China, India, Japan, South Korea, Australia, ASEAN Countries, Rest of Asia Pacific), Middle East & Africa (UAE, Saudi Arabia, Qatar, South Africa, Rest of Middle East & Africa), Latin America (Brazil, Argentina, Mexico, Colombia, Rest of Latin America). |
| Company Profiles | Toray Industries Inc.; Teijin Limited; Hexcel Corporation; SGL Carbon SE; Solvay SA; Owens Corning; Mitsubishi Chemical Group Corporation; Huntsman Corporation; Gurit Holding AG; Cytec Industries Inc. (Solvay); Jushi Group Co. Ltd.; China Jushi Co. Ltd.; Saertex Group; Chomarat Groupe; Vectorply Corporation; Porcher Industries; Scott Bader Company Ltd.; DIAB Group; AOC LLC; Composites One LLC |
Frequently Asked Questions
Ans: North America dominated with approximately 33.2% of global revenues in 2025.
Ans: Thermoplastic composites are the fastest-growing resin type at approximately 6.15% CAGR through 2035.
Ans: The automotive EV lightweighting imperative making each kilogram of composite weight reduction directly recoverable as driving range, combined with wind energy rotor blade length extension requiring glass and carbon hybrid composite as the only practical construction material for 80 to 100 metre blades, and civil infrastructure renewal investment driving corrosion-immune GFRP rebar and composite structural profile adoption.
Ans: The Fiber Reinforced Polymer Composites Market was valued at USD 98.72 billion in 2025.
Ans: The Fiber Reinforced Polymer Composites Market is expected to grow at a CAGR of 6.47% from 2026 to 2035.
Get in Touch
