Floating Power Plant Market Report Scope & Overview:
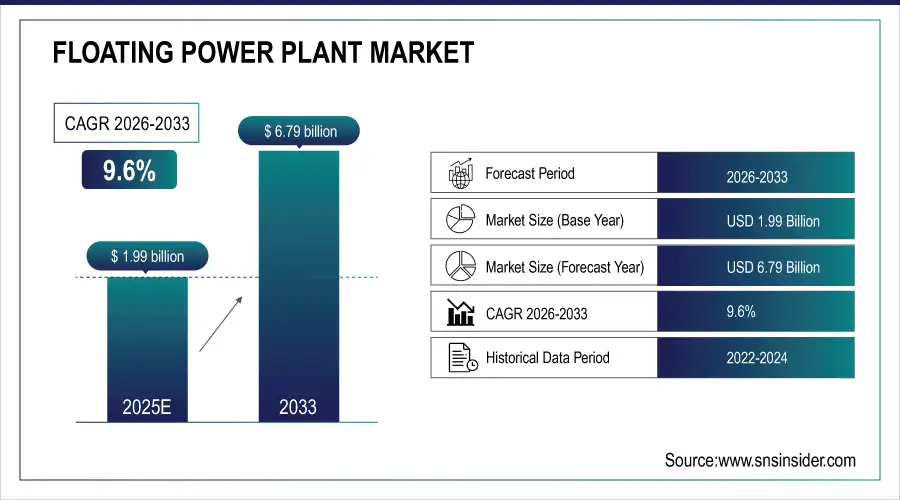
The Floating Power Plant Market was valued at USD 1.99 billion in 2025E and is expected to reach USD 6.79 billion by 2033, growing at a CAGR of 9.6% from 2026-2033. .
The Floating Power Plant Market is growing due to rising electricity demand in coastal and remote regions, increasing adoption of renewable offshore solutions, and supportive government policies promoting clean energy. Rapid deployment capabilities, scalability, and minimal land requirements further drive growth. Additionally, industrial and maritime applications, technological advancements in offshore generation, and global decarbonization initiatives are contributing to the strong expansion of floating power plants worldwide.
Floating Power Plant Market Size and Forecast
-
Market Size in 2025E: USD 1.99 Billion
-
Market Size by 2033: USD 6.79 Billion
-
CAGR: 9.6% from 2026 to 2033
-
Base Year: 2025E
-
Forecast Period: 2026–2033
-
Historical Data: 2022–2024
To Get More Information on Floating Power Plant Market - Request Sample Report
Floating Power Plant Market Trends
-
Rising demand for flexible and rapidly deployable power solutions is driving the floating power plant market.
-
Growing adoption of floating gas-fired and renewable power systems is boosting energy generation in remote and coastal regions.
-
Expansion of offshore wind and hybrid renewable-floating platforms is fueling technological innovation.
-
Advancements in mooring, anchoring, and marine engineering are improving plant stability, efficiency, and lifespan.
-
Increasing need for energy resilience in disaster-prone and infrastructure-limited areas is shaping market demand.
-
Focus on reducing carbon emissions is encouraging the shift toward floating solar-wind hybrid systems.
-
Partnerships among energy developers, shipyards, and technology providers are accelerating project deployment and commercialization.
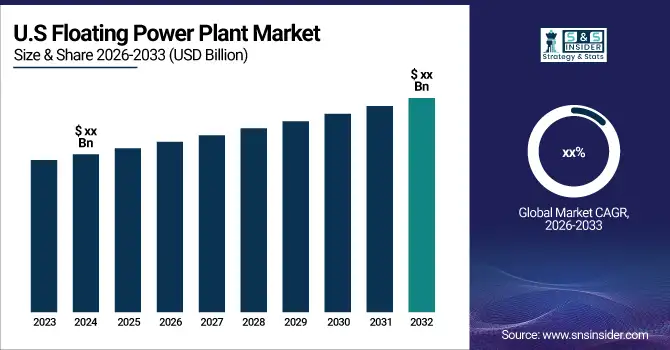
The U.S. Floating Power Plant market size was valued at an estimated USD 0.75 billion in 2025 and is projected to reach USD 2.55 billion by 2033, growing at a CAGR of 8.7% over the forecast period 2026–2033. Market growth is driven by increasing demand for flexible and rapid-deployment power generation solutions, particularly in coastal and remote regions. Rising investments in renewable and hybrid floating power plants, including floating solar and offshore wind-integrated systems, are further supporting market expansion. Additionally, growing focus on reducing carbon emissions, improving energy security, and leveraging water bodies for power generation, along with advancements in floating platform technologies, continue to strengthen the growth outlook of the U.S. floating power plant market during the forecast period.
Floating Power Plant Market Growth Drivers:
-
Growing demand for flexible, rapid-deployment power solutions to meet rising electricity needs in remote, coastal, and disaster-prone regions globally
Rising electricity demand in remote islands, coastal communities, and disaster-prone areas drives the need for flexible, fast-deployable generation solutions. Floating power plants provide mobile, scalable, and grid-ready power without requiring land acquisition, making them ideal for temporary and permanent energy needs. Their ability to bridge supply gaps, integrate into weak grids, and support emergency response enhances their value proposition. Governments increasingly prefer floating units to accelerate electrification where conventional infrastructure is difficult or slow to build. Their rapid installation and relocation capability significantly boosts adoption across developing regions and maritime-based economies, strengthening market growth.
Floating Power Plant Market Restraints:
-
High capital investment requirements and complex engineering needs limiting adoption across regions with constrained energy budgets and limited technical capabilities
Building floating power plants involves significant upfront capital due to specialized hulls, anchoring systems, offshore-grade turbines, and advanced energy storage integration. Engineering complexity in designing stable, corrosion-resistant, and wave-tolerant structures raises costs further. Many developing regions lack the technical expertise and financial capacity required for such projects, slowing adoption. Long project lead times, environmental assessments, and high marine logistics expenses increase overall investment burdens. Limited financing mechanisms, especially for renewable floating plants, restrict market expansion in low-income economies, making cost a critical barrier to wider deployment.
Floating Power Plant Market Opportunities:
-
Growing interest in hybrid renewable floating platforms integrating solar, wind, and storage to create high-yield, land-saving offshore power hubs
Hybrid renewable floating platforms combining floating wind, floating solar, and battery storage unlock new opportunities for continuous, high-efficiency power generation. These systems overcome intermittency challenges, reduce land use pressures, and maximize offshore productivity. Advances in modular designs and mooring technologies allow deployment in deeper waters, expanding feasible installation zones. Utilities increasingly explore hybrid models to diversify energy portfolios while meeting sustainability targets. Their ability to power industrial coastal clusters, ports, and green hydrogen facilities enhances long-term investments, positioning hybrid floating complexes as a transformative growth opportunity.
Floating Power Plant Market Segment Analysis
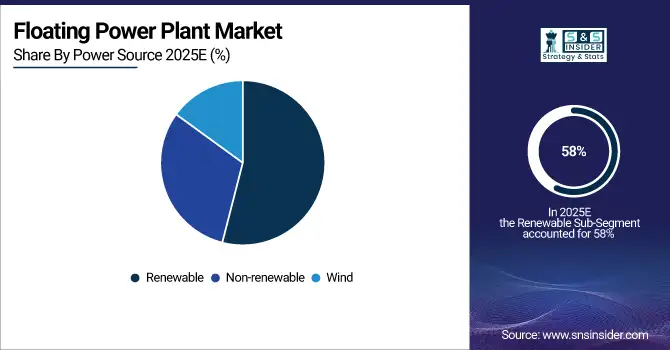
By Power Source, Renewable Floating Power Plants dominated the Floating Power Plant Market
Renewable floating power plants capture 58% of the Floating Power Plant Market in 2025, driven by strong offshore wind adoption, expanding floating solar projects, and growing government support for clean-energy marine infrastructure. Their ability to operate in deep waters, deliver higher capacity factors, and avoid land-use conflicts strengthens long-term deployment. Increasing investments in hybrid floating wind-solar platforms and deep-sea turbines further reinforce the leadership of renewable installations over non-renewable floating units.
By Capacity, 20.1 MW to 100 MW segment led the Floating Power Plant Market
The 20.1 MW to 100 MW capacity category holds 43% of the Floating Power Plant Market in 2025, making it the strongest segment. It dominates because it offers an optimal balance between installation complexity, mobility, and generation output. These mid-range units are widely preferred for island grids, coastal regions, maritime industries, and ports. Their scalable size, lower project risk, and strong operational reliability make them the most commercially viable option compared to smaller emergency-scale units or large-scale systems requiring advanced offshore grid infrastructure.
Floating Power Plant Market Regional Analysis
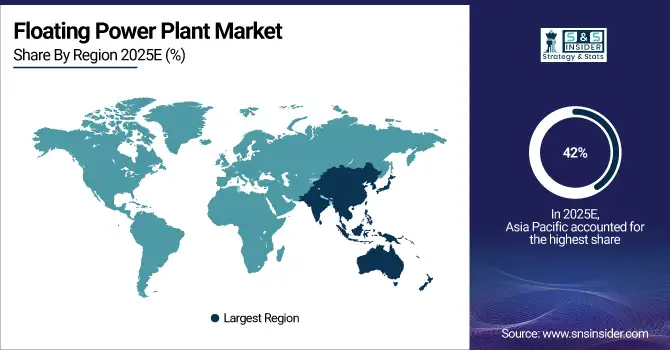
Asia Pacific Floating Power Plant Market Insights
Asia Pacific dominates the Floating Power Plant Market in 2025 with around 42% share, driven by strong offshore renewable investments, rapid coastal electrification, and expanding deployment of floating wind and hybrid renewable systems. Countries such as Japan, South Korea, China, and Indonesia are leading large-scale floating wind farms, floating solar parks, and marine-based power initiatives. High energy demand, limited available land, and government-backed decarbonization policies further accelerate adoption.
Get Customized Report as per Your Business Requirement - Enquiry Now
North America Floating Power Plant Market Insights
North America holds a significant position in the Floating Power Plant Market, driven by increasing offshore energy projects, government incentives for clean energy, and rising adoption of floating wind and solar technologies. The U.S. and Canada are investing in deep-water renewable platforms to meet growing electricity demand in coastal and remote areas. Technological advancements, favorable regulatory frameworks, and industrial applications further support market growth in the region.
Europe Floating Power Plant Market Insights
Europe is a key market for Floating Power Plants, driven by strong government policies supporting offshore renewable energy, especially floating wind and solar projects. Countries like the U.K., Germany, and France are investing heavily in deep-water offshore platforms to meet growing energy demand and decarbonization targets. Advanced maritime infrastructure, technological innovation, and increasing industrial and coastal applications further boost the adoption of floating power solutions across the region.
Middle East & Africa and Latin America Floating Power Plant Market Insights
The Middle East & Africa and Latin America markets for Floating Power Plants are growing due to rising energy demand in coastal regions, limited land availability, and increasing investments in offshore renewable energy. Government initiatives, industrial and maritime applications, and technological advancements in floating wind and solar platforms further support adoption. Countries across both regions are leveraging floating solutions to provide reliable, scalable, and sustainable power, driving overall market expansion and regional growth.
Floating Power Plant Market Competitive Landscape:
Floating Power Plant
Floating Power Plant (FPP) is a Danish renewable-energy technology developer focused on hybrid floating platforms that combine wind, wave, and hydrogen production. Its integrated systems aim to maximize offshore energy capture while reducing overall levelized cost of energy (LCOE). FPP collaborates with global energy and engineering partners to commercialize multi-MW platforms suited for deep-water regions where fixed-bottom turbines are not feasible. The company continues advancing demonstrator projects to validate hybrid offshore performance.
-
FPP acquired a 4.3 MW Siemens Gamesa wind-turbine generator for its Gran Canaria demonstrator, advancing its wind-wave-hydrogen hybrid platform.
Equinor ASA
Equinor ASA is a global energy company headquartered in Norway, recognized as one of the leading developers of floating offshore wind. The company leverages decades of offshore engineering expertise from oil and gas to scale deep-water renewables worldwide. Equinor’s approach centers on industrializing floating-wind technology, reducing costs, and integrating renewable power into offshore and onshore energy systems. Its projects, including Hywind Scotland and Hywind Tampen, position Equinor as a pioneer in commercial floating wind deployment.
-
Awarded a seabed lease in the UK’s Celtic Sea for a floating-wind project (up to 1.5 GW) as part of the UK’s first floating-wind leasing round.
-
Official opening of Hywind Tampen (88 MW, 11 turbines), the world’s first floating wind farm powering offshore oil & gas platforms.
ABB Ltd.
ABB Ltd. is a global leader in electrification, automation, and power-grid technologies, playing a crucial role in enabling large-scale renewable-energy projects. The company provides advanced grid-integration, subsea power systems, digital monitoring, and HVDC solutions that support offshore-wind reliability and efficiency. ABB collaborates with developers and EPC partners to accelerate complex floating and fixed-bottom offshore projects, focusing on system optimization, lower emissions, and enhanced energy delivery from remote offshore locations.
-
ABB and Aker Solutions secured the FEED contract for Green Volt, the UK’s 560 MW floating offshore-wind project — Europe’s first large-scale floating wind farm.
Key Players
Some of the Floating Power Plant Market Companies
-
Wärtsilä Corporation
-
Karadeniz Energy Group (Karpowership)
-
Siemens Energy
-
General Electric (GE Power)
-
MAN Energy Solutions
-
ABB Ltd.
-
Mitsubishi Heavy Industries (MHI)
-
Doosan Heavy Industries & Construction
-
Bureau Veritas
-
Ideol (BW Ideol)
-
Floating Power Plant A/S
-
Equinor ASA
-
Hitachi Energy
-
Kyocera Corporation
-
Principle Power
-
SeaTwirl AB
-
Rosetti Marino Group
-
Vestas Wind Systems A/S
-
Ocean Sun AS
-
Copenhagen Offshore Partners
| Report Attributes | Details |
| Market Size in 2025E | US$ 1.99 Bn |
| Market Size by 2033 | US$ 6.79 Bn |
| CAGR | CAGR of 9.6 % From 2026 to 2033 |
| Base Year | 2025 |
| Forecast Period | 2026-2033 |
| Historical Data | 2022-2024 |
| Report Scope & Coverage | Market Size, Segments Analysis, Competitive Landscape, Regional Analysis, DROC & SWOT Analysis, Forecast Outlook |
| Key Segments | • By Power Source (Non-renewable, Renewable, Wind) • By Capacity (1MW-5 MW, 5.1 MW-20 MW, 20.1 MW-100 MW, 100.1 MW-250 MW, above 250 MW) |
| Regional Analysis/Coverage | North America (US, Canada, Mexico), Europe (Eastern Europe [Poland, Romania, Hungary, Turkey, Rest of Eastern Europe] Western Europe] Germany, France, UK, Italy, Spain, Netherlands, Switzerland, Austria, Rest of Western Europe]). Asia Pacific (China, India, Japan, South Korea, Vietnam, Singapore, Australia, Rest of Asia Pacific), Middle East & Africa (Middle East [UAE, Egypt, Saudi Arabia, Qatar, Rest of Middle East], Africa [Nigeria, South Africa, Rest of Africa], Latin America (Brazil, Argentina, Colombia Rest of Latin America) |
| Company Profiles |
Wärtsilä Corporation, Karadeniz Energy Group (Karpowership), Siemens Energy, General Electric (GE Power), MAN Energy Solutions, ABB Ltd., Mitsubishi Heavy Industries (MHI), Doosan Heavy Industries & Construction, Bureau Veritas, Ideol (BW Ideol), Floating Power Plant A/S, Equinor ASA, Hitachi Energy, Kyocera Corporation, Principle Power, SeaTwirl AB, Rosetti Marino Group, Vestas Wind Systems A/S, Ocean Sun AS, Copenhagen Offshore Partners. |
Frequently Asked Questions
Ans: Asia Pacific dominated in 2025 with approximately 42% market share, led by Japan, China, South Korea, and Indonesia’s offshore renewable investments.
Ans: The renewable power source and 20.1 MW to 100 MW capacity segments dominated, offering optimal scalability, efficiency, and cost-effectiveness for floating power deployment.
Ans: Rising electricity demand in remote and coastal areas, increasing adoption of offshore renewables, and supportive government policies are major factors driving market growth.
Ans: In 2025, the Floating Power Plant Market was valued at USD 1.99 billion, supported by rising electricity demand and offshore renewable deployment.
Ans: The Floating Power Plant Market is projected to grow at a CAGR of 9.6% from 2026 to 2033, driven by offshore renewable adoption.
Get in Touch
