Fluid Loss Additives Market Report Scope & Overview:
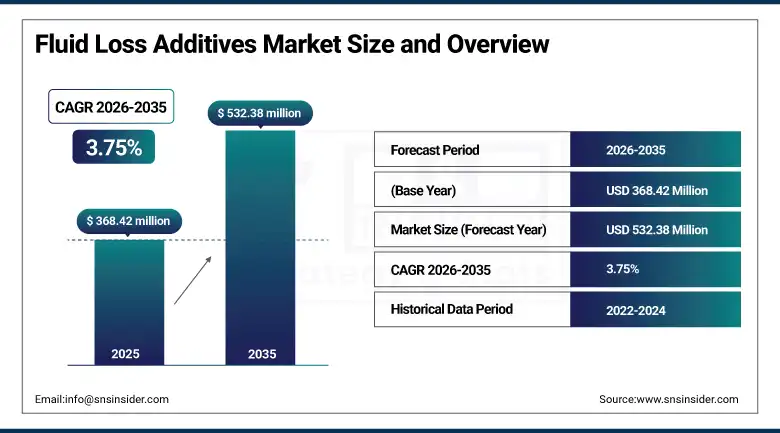
The Fluid Loss Additives Market was valued at USD 368.42 million in 2025 and is expected to reach USD 532.38 million by 2035, growing at a CAGR of 3.75% from 2026-2035.
The growth of the fluid loss additives market is due to the growing activities related to the exploration of oil and gas reserves both onshore and offshore regions throughout the world. Increasing requirement of effective drilling, wellbore stability, and minimization of fluid invasion to the formation is leading to the higher utilization of fluid loss control products. Growing interest in deep water and unconventional drilling activities is also playing a key role in the growth of this industry. Moreover, technological advancements in drilling fluids and their usage have become an important factor in its development.
According to the U.S. Energy Information Administration (EIA), U.S. crude oil production reached a record 13.6 million barrels per day in 2025, increasing by 3% year-over-year, with major growth from the Permian Basin and new Gulf offshore projects.
Market Size and Forecast
-
Market Size 2026E: USD 382.23 Million
-
Market Size 2035: USD 532.38 Million
-
CAGR (2026-2035): 3.75%
-
Fastest Growing Market: Asia Pacific
-
Largest Market: North America
To Get more information On Fluid Loss Additives Market - Request Free Sample Report
Fluid Loss Additives Market Trends
-
Rising drilling activities in oil and gas exploration are driving the fluid loss additives market.
-
Growing demand for efficient wellbore stability and drilling fluid performance is boosting market growth.
-
Expansion of shale gas exploration and deepwater drilling projects is fueling additive consumption.
-
Increasing focus on reducing formation damage and improving drilling efficiency is shaping adoption trends.
-
Advancements in polymer-based additives, nanomaterials, and eco-friendly formulations are enhancing performance and environmental compliance.
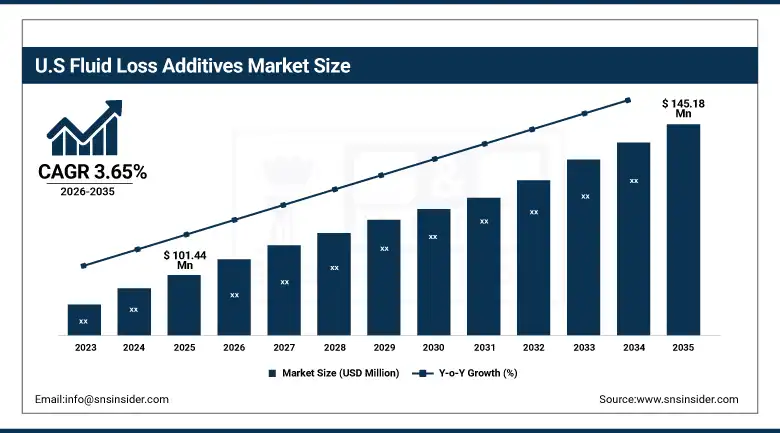
U.S. Fluid Loss Additives Market Size Outlook
The U.S. Fluid Loss Additives Market was valued at USD 101.44 million in 2025 and is expected to reach USD 145.18 million by 2035, growing at a CAGR of 3.65% from 2026-2035.
The U.S. fluid loss additives market is growing because of the exploration of shale oil and gas, drilling operations, and investments made in new well technologies. There is an increased need for high-performing drilling fluids in unconventional and deep wells, and this has been encouraging more adoption of products in the upstream processes. There are other factors such as the availability of big oilfield service companies that have contributed to market growth.
The EIA stated that five new Gulf offshore projects, including Whale and Shenandoah, commenced production in 2025, supporting higher demand for drilling and cementing additives. Continuous technological advancements in drilling efficiency and fluid systems are also accelerating adoption.
Fluid Loss Additives Market Segment Analysis
-
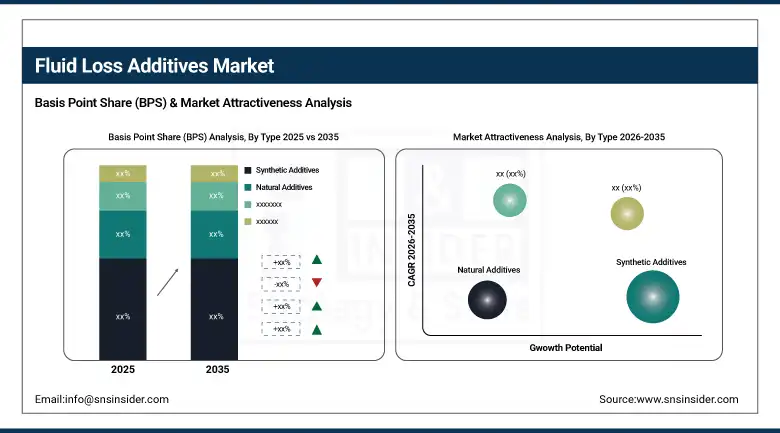
By Type, synthetic additives segment dominated the fluid loss additives market in 2025 with 62% share; natural additives segment is the fastest growing segment.
-
By Fluid Base Type, water-based fluids segment dominated the market in 2025 with 54% share; synthetic-based fluids segment is the fastest growing segment.
-
By Well Type, onshore wells segment dominated the market in 2025 with 68% share; offshore wells segment is the fastest growing segment.
-
By Application, drilling fluids segment dominated the market in 2025 with 78% share; cement slurries segment is the fastest growing segment.
By Type, synthetic additives dominate the fluid loss additives market, natural additives are the fastest growing
Synthetic additives dominate the market because of their superior features, which include improved thermal stability, precise rheology control, and better filtration reduction at severe drilling sites. Synthetics are reliable because of their consistency and tailorability to meet various drilling requirements. They also demonstrate excellent performance when used with sophisticated drilling fluids and at high pressures and temperatures. Oilfield companies prefer to work with synthetics because they provide them with an efficient and predictable option.
Natural additives are growing rapidly due to the increased focus on environmentally safe drilling practices and tighter regulations in this field. These substances boast a low level of toxicity and do not affect the environment in any harmful ways. Increasing consumer demand for effective natural oil field products and their affordable price will contribute to higher market share of natural additives in the future. Improvements in terms of their technical capabilities will enhance their applications.
By Fluid Base Type, water-based fluids dominate the fluid loss additives market, synthetic-based fluids are the fastest growing
Water-based fluids dominate the market because of its cost-effectiveness and environmental-friendly nature, among other reasons. It also exhibits sufficient performance in most drilling activities. In addition to that, it is not harmful and easy to dispose of when required. This type of drilling fluid is compatible with fluid loss additives; hence, it provides optimal drilling performance with minimal formation damage during normal onshore activities.
Synthetic-based fluids are growing rapidly due to their high performance in hard-to-drill conditions, for instance, high-pressure and high-temperature wells. Compared to other types of drilling fluids, they can provide better lubrication and thermal stability. Besides, they can reduce formation damage significantly. The rising popularity of deepwater drilling and reservoir development requires such types of drilling fluids. Even though they are more expensive than other types, they increase drilling efficiency and speeds.
By Well Type, onshore wells dominate the fluid loss additives market, offshore wells are the fastest growing
Onshore wells dominate the market due to the prevalence of land drilling activities globally and low costs associated with their operations. It is easy to explore and exploit resources using onshore wells, as the process is not complicated from a logistical perspective and requires minimal technology. Such wells require constant addition of fluid loss agents to sustain drilling processes. Also, due to the availability of large numbers of mature onshore wells that require redevelopment activities, the segment will continue to dominate the market.
Offshore wells are the fastest growing segment due to increasing investment in deepwater and ultra-deepwater drilling. The need to tap into unexploited oil and gas resources is increasing owing to rising global energy consumption trends. Offshore wells require sophisticated technology and efficient fluid loss agents to facilitate drilling activities under high pressure and temperature conditions. Increased technological advances in offshore equipment and safety systems will drive expansion efforts.
By Application, drilling fluids dominate the fluid loss additives market, cement slurries segment is the fastest growing
Drilling fluids dominate the market because they are vital for all stages of the drilling operation for wellbore stabilization, transportation of cuttings, and pressure regulation. Fluid loss additives are largely used in drilling fluids for minimizing fluid loss from formations during drilling. The consistent usage of drilling fluids in various applications keeps this segment dominant in the market. Drilling fluids' importance in risk mitigation and enhanced performance is a key factor contributing to their sustained dominance.
Cement slurries are the fastest growing segment, owing to the growing importance of well integrity, zonal isolation, and long-term stability of the well. Fluid loss additives are required in well cementing to regulate filtration and achieve effective positioning of the cement slurry. The increasing complexity of well construction such as horizontal and deep wells is a factor responsible for the growing demand. Increasing safety concerns and regulatory demands for the safe abandonment and production integrity of the wells are other factors driving demand.
Regional Analysis
|
Region |
Major Country |
Share within Region (%) |
|---|---|---|
|
North America |
United States |
88.2% |
|
Europe |
United Kingdom |
21.5% |
|
Asia Pacific |
China |
59.7% |
|
Middle East & Africa |
UAE |
15.3% |
|
Latin America |
Brazil |
47.6% |
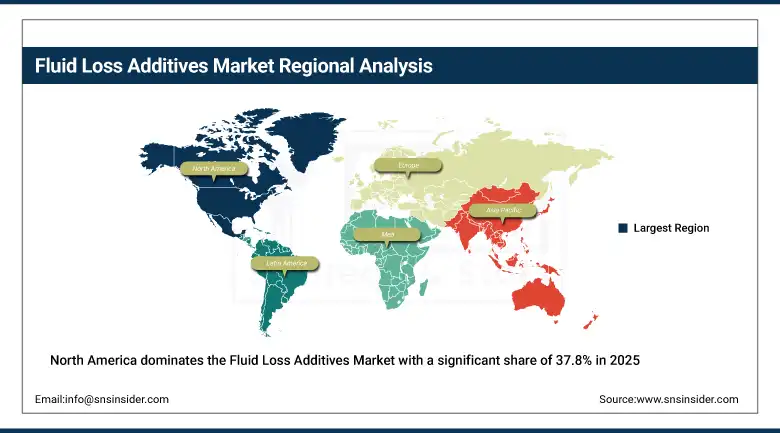
North America Fluid Loss Additives Market Insights
North America dominates the Fluid Loss Additives Market with a significant share of 37.8% in 2025, owing to robust drilling operations along with increased investment in the production of unconventional sources of energy. High shale exploration in both the U.S. and Canada is contributing to the increasing consumption of high-quality drilling fluids along with fluid loss additives. This region has several oilfield service companies along with drilling facilities, and there is consistent development of technology in drilling operations. Offshore and deep water explorations have been on the rise which contributes to the demand for the product.
Get Customized Report as per Your Business Requirement - Enquiry Now
Europe Fluid Loss Additives Market Insights
Europe’s fluid loss additives market is witnessing steady growth owing to factors such as efficient drilling techniques, environmental considerations, and sophisticated oilfield technology. The European countries are increasingly adopting sustainable drilling techniques and promoting the use of fluid additives with low toxicity and biodegradability. Offshore exploration in the North Sea remains an important factor boosting demand for high-quality drilling and cementing fluids. Energy security measures as well as oilfield redevelopment activities are some other factors that will drive market growth.
Asia Pacific Fluid Loss Additives Market Insights
The Asia-Pacific region is expected to witness the highest growth rate, having a CAGR of 4.65% over the forecast period. The rapid increase in oil and gas exploration activities in emerging economies like China, India, Indonesia, and Australia is anticipated to boost the demand for advanced drilling techniques. Rising energy consumption, increasing investment in offshore and unconventional drilling operations, and the rise in industrialization are expected to drive the market in the near future. Apart from this, supportive government policies for the production of domestic energy, along with the adoption of advanced drilling fluids, will aid market growth in this region.
Middle East & Africa and Latin America Fluid Loss Additives Market Insights
The Middle East & Africa and Latin America fluid loss additives market are witnessing substantial growth owing to increased exploration and production activities in energy-rich countries. The growing number of offshore and onshore drilling operations are escalating the requirement for effective fluid management systems that enhance well stability. Growing offshore exploration and development activities are boosting the market for fluid loss additives in Latin America, whereas increasing upstream investments and the presence of extensive hydrocarbons deposits in the Middle East are driving the demand for FLAs in the region.
Market Dynamics
Growth Drivers: Rising drilling activities across complex reservoirs increasing demand for advanced fluid loss control additives
The increase in global exploration efforts for oil and gas, especially from unconventional and HPHT reservoirs, leads to an increased demand for premium drilling fluids. Fluid loss additives contribute significantly to wellbore integrity, fluid filtration control, and enhanced drilling performance. Increased energy demand and sustained investment in upstream exploration projects drive up the demand for this technology. More drilling activities involve optimization of drilling performance and minimization of nonproductive time, driving up demand for more efficient polymer-based and synthetic fluid loss additives. The trend towards deep wells also contributes to demand for more efficient fluid systems that can operate efficiently in harsh environments.
Restraints: Volatility in crude oil prices affecting exploration budgets and drilling activity levels globally
Variations in crude oil prices have an effect on upstream activities and create an imbalance in drilling operation levels worldwide. Lower oil prices negatively affect the level of capital expenditure by exploration and production firms, which directly affects drilling fluids and chemical additives requirements. The price variations result in uncertainties, which lead to postponement of large-scale drilling operations. In addition, financial problems force these firms to focus on basic operations, and therefore, the market for advanced chemical additives will not expand much. The cyclical characteristics of the oil and gas sector create more variability in demand, thus making it difficult for companies manufacturing fluid loss additive chemicals to have sustained sales performance.
Opportunities: Growing shift toward eco-friendly and bio-based drilling chemicals opening new product development avenues
Growing environmental consciousness and stringent regulation are creating a surge in demand for drilling solutions that are environmentally friendly, which in turn creates excellent opportunities for the development of bio-based fluid loss additives. Businesses are now investing their time in the creation of biodegradable polymers and environmentally friendly chemical alternatives to traditional chemical additives used for drilling purposes. This move opens up many new avenues in the field of chemistry and oilfield sustainability. Many operators are moving towards using drilling fluids that have low environmental impacts and are more environmentally friendly to help meet strict environmental requirements. The growing need for less toxic and more efficient formulations will drive the research and development process in the sector.
Recent Developments:
-
2025: SLB expanded its global drilling fluids portfolio, enhancing fluid-loss control systems integrated with ECOTROL and POLYPAC product lines to reduce filtrate invasion and improve wellbore integrity in high-temperature reservoirs. These solutions were deployed across multiple international drilling operations to improve efficiency and reduce formation damage.
-
2025: Baker Hughes advanced its drilling fluids and cementing chemicals segment through expanded operational support systems in offshore energy markets, strengthening fluid handling and cement bulk systems that improve lost circulation management and drilling efficiency in complex wells.
-
2025: BASF expanded production capacity of its oilfield chemical additives (Basoflux range), improving availability of paraffin inhibitors and complementary flow-assurance chemistries used alongside fluid loss control systems in drilling and production environments.
-
2024: Halliburton launched the SentinelCem Pro cement system, a next-generation lost circulation solution designed to cure severe fluid losses while drilling. The system improves pumping efficiency and rapidly gels in loss zones, significantly reducing non-productive time in drilling operations.
-
2023; Halliburton introduced BaraFLC Nano-1 wellbore stability sealant, a nanocomposite additive designed to significantly reduce fluid loss into formations. The technology enhances shale stability by minimizing filtrate invasion and strengthening wellbore integrity during drilling operations.
-
2023: SLB introduced its EcoShield geopolymer cement-free system, a breakthrough well construction solution that reduces CO₂ emissions while also improving zonal isolation performance, indirectly supporting improved fluid-loss control and formation sealing efficiency in well construction processes.
Fluid Loss Additives Market Key Players are:
-
Halliburton Company
-
Schlumberger Limited (SLB)
-
Baker Hughes Company
-
BASF SE
-
Clariant AG
-
Solvay S.A.
-
Newpark Resources Inc.
-
Kemira Oyj
-
Nouryon
-
Chevron Phillips Chemical Company LLC
-
Global Drilling Fluids & Chemicals Limited
-
SNF Group
-
Tetra Technologies Inc.
-
Innospec Inc.
-
Croda International Plc
-
Ashland Global Holdings Inc.
-
Dow Inc.
-
Evonik Industries AG
-
Lanxess AG
-
Huntsman Corporation
Fluid Loss Additives Market Report Scope:
| Report Attributes | Details |
|---|---|
| Market Size in 2025 | USD 368.42 Million |
| Market Size by 2035 | USD 532.38 Billion |
| CAGR | CAGR of 3.75% From 2026 to 2035 |
| Base Year | 2025 |
| Forecast Period | 2026-2035 |
| Historical Data | 2022-2024 |
| Report Scope & Coverage | Market Size, Segments Analysis, Competitive Landscape, Regional Analysis, DROC & SWOT Analysis, Forecast Outlook |
| Key Segments | •By Type (Synthetic Additives, Natural Additives) •By Fluid Base Type (Water-Based Fluids, Oil-Based Fluids, Synthetic-Based Fluids) •By Well Type (Onshore Wells, Offshore Wells) •By Application (Drilling Fluids, Cement Slurries) |
| Regional Analysis/Coverage | North America (US, Canada), Europe (Germany, UK, France, Italy, Spain, Russia, Poland, Rest of Europe), Asia Pacific (China, India, Japan, South Korea, Australia, ASEAN Countries, Rest of Asia Pacific), Middle East & Africa (UAE, Saudi Arabia, Qatar, South Africa, Rest of Middle East & Africa), Latin America (Brazil, Argentina, Mexico, Colombia, Rest of Latin America). |
| Company Profiles | Halliburton Company, Schlumberger Limited (SLB), Baker Hughes Company, BASF SE, Clariant AG, Solvay S.A., Newpark Resources Inc., Kemira Oyj, Nouryon, Chevron Phillips Chemical Company LLC, Global Drilling Fluids & Chemicals Limited, SNF Group, Tetra Technologies Inc., Innospec Inc., Croda International Plc, Ashland Global Holdings Inc., Dow Inc., Evonik Industries AG, Lanxess AG, Huntsman Corporation |
Frequently Asked Questions
North America dominated the Fluid Loss Additives Market in 2025.
The Synthetic Additives segment dominated the Fluid Loss Additives Market in 2025.
Get in Touch
