Fracking Water Treatment Market Report Scope & Overview:
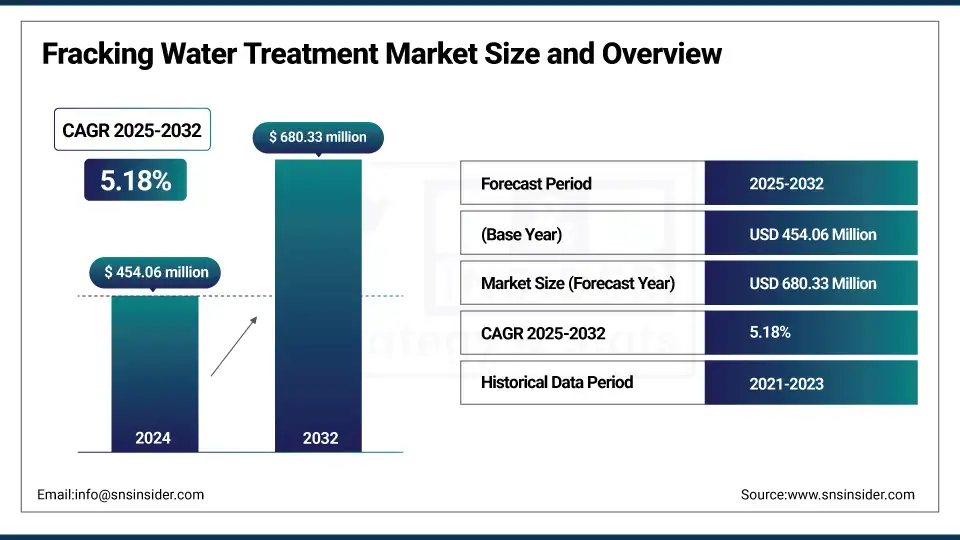
The Fracking Water Treatment Market Size was valued at USD 454.06 million in 2024 and is expected to reach USD 680.33 million by 2032, growing at a CAGR of 5.18% over the forecast period of 2025-2032.
The fracking water treatment market analysis that the surge in the exploration and production (E&P) of shale gas is one of the significant factors that will contribute to the growth of this market. Due to increasing global energy demand and the need to develop alternative energy resources, the exploration of shale gas has intensified globally, especially in countries including North America and some areas of the Asia Pacific. Hydraulic fracturing, also known as fracking, uses abundant water, resulting in the contamination of flowback and produced water. This has resulted in an increasing demand for personal and economically efficient water treatment technology for environmental risk control and regulation compliance. The market is projected to witness upward trends since the expansion and establishment of new shale basins is estimated to create lucrative opportunities for advanced water treatment solutions, in response to which, drive the fracking water treatment market growth.
To Get more information On Fracking Water Treatment Market Market - Request Free Sample Report
For instance, even as energy prices fluctuated during the past year, from YoY average through September 2024, dry gas production from shale has declined marginally (~1%) to reach 81.2Bcf/d, reflecting 79% of total U.S. dry gas production and a clear indication of the magnitude of the gas resources achieved through hydraulic fracturing.
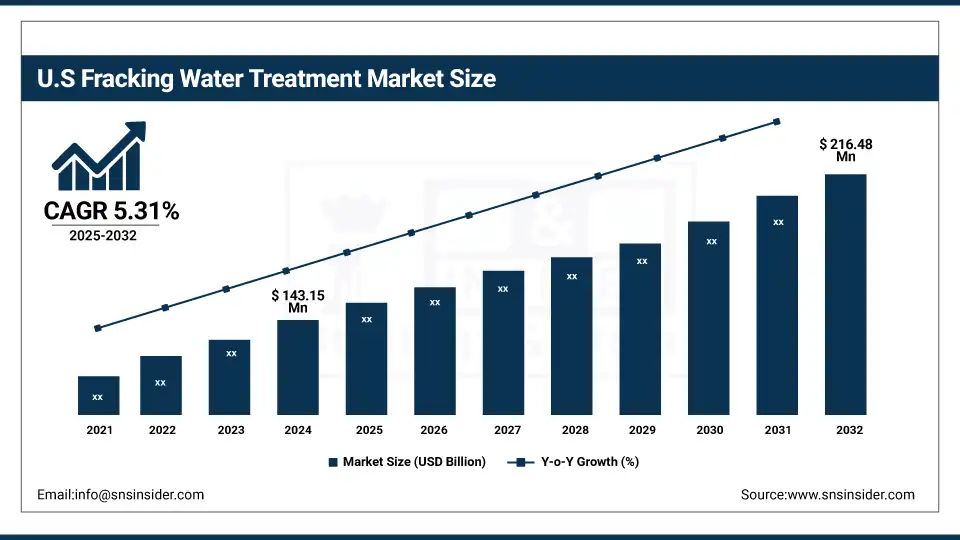
The U.S. fracking Water Treatment market size was USD 143.15 million in 2024 and is expected to reach USD 216.48 million by 2032 and grow at a CAGR of 5.31% over the forecast period of 2025-2032. The growth is propelling as the U.S. shale basins producing huge quantities of produced and flowback water, and thus, there is increasing demand for effective water treatment technology. State and federal environmental laws have forced operators to treat on-site, use less freshwater, and safely dispose of the waste. One recent milestone was ExxonMobil’s expansion in 2025 in the Permian Basin, where the company added ship-sized, mobile desalination systems that could treat up to 1 million barrels of water a day. This initiative represents a significant step in moving away from water-related east missions and dependence on fresh groundwater sources.
Market Dynamics
Key Drivers:
-
Rising Water Scarcity and Need for Reuse Solutions Drive the Market Growth
Water-dependent businesses, such as shale gas development are under growing pressure to stop using so darn much freshwater, especially in regions including Texas, New Mexico, and a bunch of the Middle East. Hydraulic fracturing of a well can use between 2 to 8 million gallons of water, which is a source of stress on local water supplies, particularly in drought conditions. With water withdrawals from aquifers and rivers becoming increasingly regulated and locally contentious, energy producers have started using closed-loop systems to treat abundant and often problematic produced water onsite. Reuse reduces not only the water taken from the ground, but also transportation, disposal costs, and environmental risk.
Restraints:
-
High Operational Costs and Complex Infrastructure Requirements May Hamper Market Growth
Installation and operation of the more sophisticated water treatment systems for fracking come at a high cost. Membrane treatments, thermal treatments, and advanced oxidation treatments are labour-intensive, energy-consuming, and difficult to maintain. However, this becomes a cost-prohibitive and logistically unattainable option for smaller oil & gas operators or in remote basins. Also, irregular status of water quality may decrease the effectiveness and life of the treatment units.
Opportunities:
-
Technological Advancements in On-site and Mobile Water Treatment Solutions Create an Opportunity for the Market Expansion
The development of mobile and containerized water treatment systems has revolutionized fracking operations. Centralized off-site treatment options tend to be capital and logistical-intensive intensive with high energy and environmental costs associated with the transportation of large quantities of wastewater. Modern, mobile treatment systems, on the other hand, are self-contained units that can be quickly and easily transported to drilling or production locations. These advanced units come with directly measurable real-time water quality sensors, hybrid membrane-biological treatment, and automatic dosing controls for the adaptive and accurate treatment of the water. This versatility enables operators to size capacity to a site and minimize lost time between fracking jobs, which drives the fracking water treatment market trends.
For instance, in March 2024, XRI Holdings added its mobile water treatment fleet in the Permian Basin in the US to offer onsite treatment and recycling of over 120 million barrels of water per year. The project demonstrates that mobile water treatment can be a significant enabler for the industry’s move towards circular water use models, which support both operational sustainability and cost savings.
Segmentation Analysis:
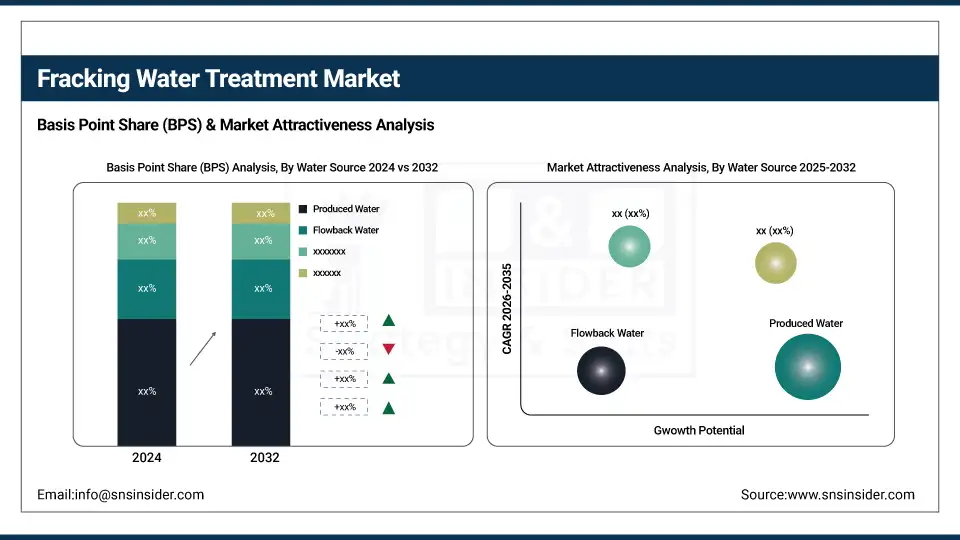
By Water Source
Produced water is the largest application of the produced water treatment systems market and held over 62% in 2024 of the processing line. This growth is increasing as produced water at all stages of the well’s lifetime, unlike flowback water, which is predominantly recouped just after fracking. Due to the continuous flow of produced water with high salt, hydrocarbon, and heavy metals concentration, treatment has to be continued.
On the other hand, flowback water is growing most rapidly as more and more operators concentrate on recycling it right after it is fractured. Under mounting pressure to minimize freshwater use, treating flowback water for reuse has proven effective and cost-efficient, particularly in water-stressed shale regions, such as Texas and New Mexico.
By Treatment Technology
Physical separations and media filtration tend to be most common because of their lower cost and relatively simple operation at high volume. Usually, these technologies also serve as a preliminary stage to eliminate solids and oil slug prior to the fracking wastewater treatment.
But the quickest growth is occurring in membrane-based technologies, such as reverse osmosis and nanofiltration. Stricter regulations on water discharge and increased need for high-purity water for reuse are among the factors responsible for their implementation, along with new zero-liquid discharge (ZLD) rules in certain states. Oil & gas companies are looking to break into sustainable water management through these advanced but pricier systems.
By Application
Water treatment (and recycling) is the dominant application in this market as it addresses two key challenges including the scarcity of water and the high costs of operation. Recycling also helps companies reduce their dependence on freshwater resources and the costs associated with transporting and disposing of wastewater. The approach is being embraced in places including the Permian Basin, where the volume of water needed for hydraulic fracturing is staggering.
By End-Use Industry
Oil and gas companies are the largest user of fracking water treatment systems as they are liable for the environmental burden their actions impose. They also spend millions on on-site treatment facilities, mobile treatment units, and recycling systems in order to ensure they are in compliance and can operate efficiently. But there are more and more environmental services companies and industrial treatment providers moving into the space. The third-party vendors provide specialty services for treating water issues that are more difficult or working on joint infrastructure projects. Their role is growing as more operators look to outsource water treatment to reduce capital costs and to comply with stricter environmental sustainability targets.
Regional Analysis:
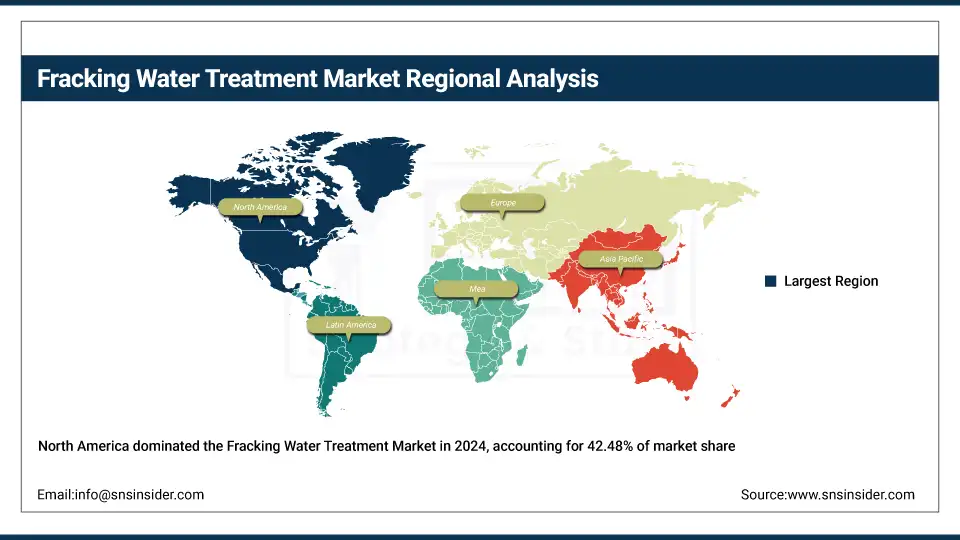
North America held the Fracking Water Treatment market share largest market 2024, around 42.48% in 2024 due to the shale gas production being large in volume, and also due to areas, such as the Permian, Eagle Ford, and Marcellus. U.S. operators have maturing water-handling capabilities developed under the pressure of strong regulation of water-use-disposal-reuse. The oilfield infrastructure in the region is well developed, which allows rapid uptake of advanced treatment solutions, such as mobile filtration units and zero-liquid discharge systems. In 2025, the Texas legislature made a significant move after it passed House Bill 49, permitting energy companies to clean and sell as gray water fracking wastewater for use in agriculture or replenishment of streams which drive the North America fracking water treatment market growth.
Get Customized Report as per Your Business Requirement - Enquiry Now
The Asia Pacific region is the fastest-growing market. It is fueled by increasing shale exploration in China, India, and Australia. In these countries, water constraints are forcing oil and gas companies to spend on water recycling and desalination techniques to satisfy operational and ecological requirements. Countries, including China, are also imposing stricter standards for the discharge of water and providing subsidies for systems that reuse wastewater. Though the region is still building up its shale infrastructure, it is seeking to follow treatment strategies that have worked well in North America. In an early sign of the region’s shift to sustainable fracking, Australian companies in early 2025 were in trial phases on shale sites of systems that combined membrane and other processes to purify water on a hybrid basis from flowback, a byproduct of fracking.
Europe maintains a significant share of the Fracking Water Treatment market, due to of stringent regulations and public protest against the hydraulic fracturing process. Some countries, including Germany, France, and the Netherlands, have banned or placed a moratorium on fracking, which has restricted the mass development of shale gas. In England, some limited research has taken place, but most conventionally generated water (almost 99.9%) is re-injected into the ground rather than treated and recycled. This lowers the demand for the requisite high-end water treatment systems. Yet with the European Union taking a stricter stance on water reuse through legislation as EU2020/741, the emphasis on technologies for safely recycling industrial wastewater, including flowback and produced water, has also been gaining traction.
Key Players:
Major Fracking Water Treatments companies are 3M, MSA Safety, Honeywell, WernerCo, Guardian Fall Protection, FallTech, Kee Safety, Tractel, XSPlatforms, Capital Safety, Super Anchor Safety, Reliance Fall Protection, Malta Dynamics, Safe Approach, DBI-SALA, Big Rock Supply, FrenchCreek Production, SafeWaze, FLS (Flexible Lifeline Systems), and RidgeGear.
Recent Development:
-
In July 2024, Wells completed the acquisition of GATE Precast, broadening its U.S. presence and architectural and structural precast panel capabilities. The merger expanded Wells’ manufacturing profile to 14 operations in more than 30 states.
-
In 2024, Carlisle acquired MTL Holdings and added to its building envelope in order “to enable Carlisle to offer customers a combination of metal edge systems with Carlisle’s industry-leading prefabricated roofing and panel solutions, improving integrated offsite solutions for the commercial construction industry.
| Report Attributes | Details |
| Market Size in 2024 | USD 454.06 Million |
| Market Size by 2032 | USD 680.33 Million |
| CAGR | CAGR of5.18% From 2025 to 2032 |
| Base Year | 2024 |
| Forecast Period | 2025-2032 |
| Historical Data | 2021-2023 |
| Report Scope & Coverage | Market Size, Segments Analysis, Competitive Landscape, Regional Analysis, DROC & SWOT Analysis, Forecast Outlook |
| Key Segments | • By Water Source (Produced Water, Flowback Water, Mine-Influenced Water, and Others) • By Treatment Technology (Media Filtration & Physical Separation, Chemical Treatment, Membrane Filtration, Thermal Treatment, Biological Treatment, Advanced / Emerging Technologies, and Others) • By Application (Treatment & Recycle, Deep-Well Injection, Evaporation & Crystallization, Solidification & Landfill Disposal, and Others) • By End-Use Industry (Oil & Gas Operators, Municipal / Industrial Co-treatment, Shale Gas Infrastructure Developers, Environmental Services Firms, and Others) |
| Regional Analysis/Coverage | North America (US, Canada), Europe (Germany, France, UK, Italy, Spain, Poland, Russsia, Rest of Europe), Asia Pacific (China, India, Japan, South Korea, Australia,ASEAN Countries, Rest of Asia Pacific), Middle East & Africa (UAE, Saudi Arabia, Qatar, Egypt, South Africa, Rest of Middle East & Africa), Latin America (Brazil, Argentina, Mexico, Colombia Rest of Latin America) |
| Company Profiles | Schlumberger, Halliburton, Veolia, Baker Hughes, Siemens Energy, Ovivo, DuPont Water Solutions, Xylem, Aquatech, SUEZ Water Technologies, Ecolab, AECOM, OriginClear, GE Water & Process Technologies, Ecologix Environmental Systems, Filtra-Systems, Hydration Technology Innovations, TETRA Technologies, GreenHunter Resources, FTS International |
Frequently Asked Questions
Recent innovations include modular mobile anchors, lightweight composite anchors, and smart monitoring-enabled anchor systems.
They are primarily used in residential, commercial, and industrial roofing projects for fall protection.
Key players include 3M, Honeywell, MSA Safety, WernerCo, Guardian Fall Protection, and Reliance Industries.
Permanent anchors and fixed anchors are the most widely used due to their durability and compliance standards.
North America and Europe are leading due to stringent safety regulations and high construction activity.
Get in Touch
