Functional Apparel Market Report Scope & Overview:
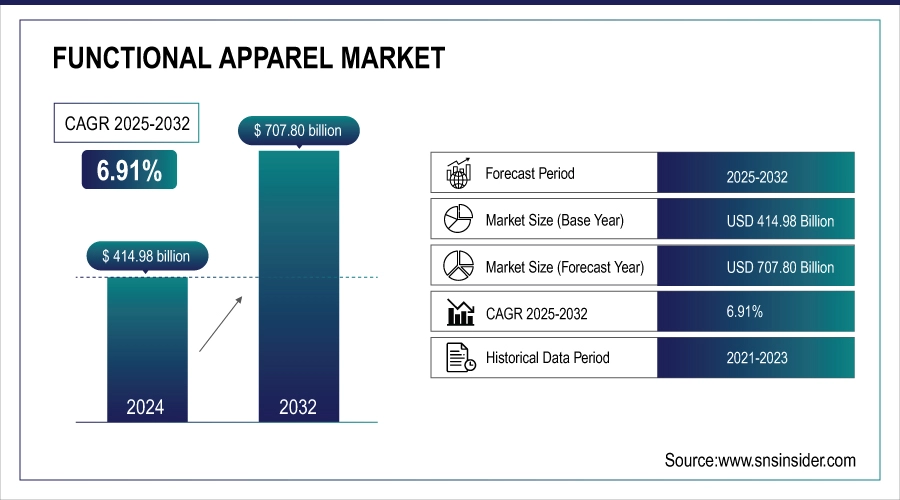
The Functional Apparel market size was valued at USD 414.98 billion in 2024 and is expected to reach USD 707.80 billion by 2032, growing at a CAGR of 6.91% over the forecast period of 2025-2032.
The functional apparel market is growing rapidly, driven by increased health awareness and sustainability trends. Leading functional apparel companies like Nike and Lululemon invest in moisture-wicking and anti-microbial technologies while using eco-friendly materials. Government initiatives promoting active lifestyles contribute to this functional apparel market growth. The U.S. Physical Activity Council reports rising fitness participation, boosting demand for high-performance functional apparel. Innovation in biodegradable fabrics and smart textiles is also shaping the functional apparel market trends.
To Get more information On Functional Apparel Market - Request Free Sample Report
The functional apparel market size benefits from expanding digital retail, especially in North America and the Asia Pacific. The U.S. Department of Commerce highlights significant online sales growth in performance wear, reflecting changing consumer habits. Industry associations emphasize sustainable production and ethical practices, influencing the functional apparel market share. This functional apparel market analysis shows companies prioritizing technology and sustainability, capturing increased market presence and consumer loyalty worldwide.
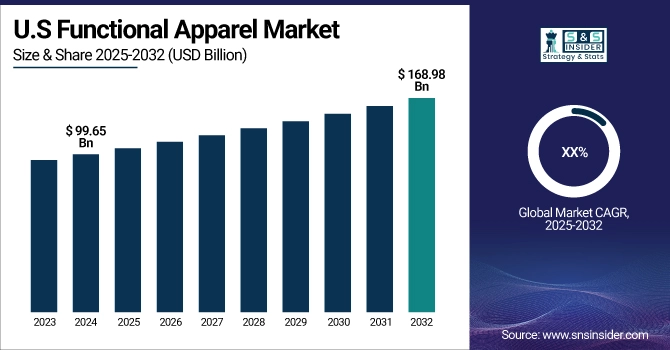
The U.S. leads, holding a market share of about 69.4% with a market size of USD 99.65 billion in 2024 and is projected to reach a market size of USD 168.98 billion by 2032, with widespread adoption of health monitoring apparel, supported by government initiatives like the CDC’s physical activity campaigns. The growing sportswear market in Canada also contributes to demand, with increased investments in smart fabrics and compression garments, enhancing comfort and performance. This region’s technological innovation and high disposable income reinforce its dominance.
Market Dynamics:
Drivers:
-
Rising consumer preference for personalized and smart functional textiles fuels market innovation
The growing demand for personalized and smart functional textiles is accelerating innovation in the functional apparel market. Advanced sensor-integrated fabrics enable real-time health monitoring and enhanced athletic performance, attracting tech-savvy consumers. According to the National Institute of Standards and Technology, smart textiles have seen a 15% annual adoption rate in activewear by 2024. This trend strengthens the performance wear market, driving investment in R&D to meet increasing consumer expectations for multifunctional and data-driven apparel solutions.
-
Increased government health initiatives boost activewear industry adoption worldwide
Government programs promoting physical fitness and wellness are significantly driving the activewear industry. The U.S. Department of Health and Human Services reported a 12% increase in national participation in exercise activities between 2022 and 2024. These initiatives encourage consumers to invest in performance-oriented apparel that supports comfort and endurance, thus expanding the functional apparel market size. Enhanced public awareness about health benefits strengthens demand for functional textiles optimized for moisture management and UV protection.
Restraints:
-
Limited consumer awareness about advanced functional apparel restricts market penetration
Limited consumer knowledge about the benefits of advanced functional apparel continues to restrict market penetration. A survey by the U.S. Physical Activity Council showed that nearly 30% of fitness enthusiasts remain unaware of innovations such as moisture-wicking and anti-microbial fabrics. This gap impacts demand for performance wear market products and slows wider functional textiles adoption. Companies need to invest in educational marketing and demonstrations to improve awareness and drive sustained growth.
Segmentation Analysis:
By Product
Sportswear held a dominant functional apparel market share of 41.20% in 2024 due to rising fitness awareness and government health programs like the U.S. Physical Activity Guidelines. Running and training apparel, as subsegments, lead this demand. The Sports & Fitness Industry Association reports increased participation rates, supporting sportswear’s dominance. This growth is fueled by consumers prioritizing performance and comfort, with major brands innovating designs to cater to active lifestyles and wellness trends globally.
Activewear is the fastest-growing segment with the highest CAGR of 7.34% during the forecast period from 2025 to 2032, driven by the popularity of yoga and athleisure wear. Post-pandemic home workouts and flexible work styles have increased demand. The Centers for Disease Control highlight rising physical activity levels, while companies like Lululemon expand versatile product lines. Consumer preference for functional yet stylish apparel accelerates growth in this segment.
By Fabric
Conventional fabric held a dominant functional apparel market share of 63.50% in 2024 due to its durability and moisture management properties, with polyester blends leading. The U.S. Department of Energy supports energy-efficient manufacturing methods, making conventional fabrics cost-effective. The American Fiber Manufacturers Association promotes innovation in these textiles, enhancing their appeal in sports and workwear. Demand remains high for reliable fabrics that combine performance and affordability, underpinning their market leadership in functional apparel.
Specialty fabric is the fastest-growing with the highest CAGR of 7.06% during the forecast period from 2025 to 2032, driven by rising interest in biodegradable and recycled fibers. Environmental regulations from the Environmental Protection Agency encourage sustainable fabric adoption. Patagonia’s commitment to eco-friendly materials reflects consumer demand for green textiles. This focus on reducing environmental impact strengthens specialty fabrics’ growth and relevance in the functional apparel market.
By Technology
Moisture-wicking held a dominant functional apparel market share of 34.90% in 2024, with microfiber technology as the leading subsegment. It enhances wearer comfort by rapidly evaporating sweat, vital for athletes. The National Institute of Standards and Technology supports innovations improving breathability. Brands like Under Armour use moisture-wicking fabrics to boost consumer trust and expand their market share, meeting increasing demand for high-performance apparel in both professional and casual athletic segments worldwide.
Anti-microbial is the fastest growing with the highest CAGR of 7.63% during the forecast period from 2025 to 2032, driven by heightened hygiene concerns after the pandemic. The Centers for Disease Control promote antimicrobial textiles in the health and fitness sectors. Silver-ion infused fabrics dominate this segment. Companies like Heiq increase r&d investments to offer odor control and infection prevention, meeting consumer demand for safer, functional apparel with antimicrobial protection.
By Consumer Group
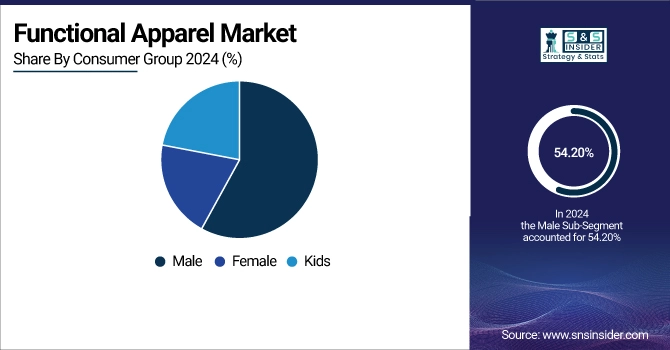
Male consumers held a dominant functional apparel market share of 54.20% in 2024, led by the athletic male subsegment due to higher sports participation. The National Federation of state high school associations notes greater male engagement in sports, driving demand for performance wear tailored to male physiology. This demographic focus shapes product innovation and marketing by leading brands, sustaining a strong market presence by aligning with the active male consumer’s preferences and lifestyle requirements.
Female consumers are the fastest-growing segment with the highest CAGR of 7.02% during the forecast period from 2025 to 2032, driven by increasing female workforce participation and fitness culture. The women’s sports foundation reports rising female athletic involvement. Women’s activewear dominates this segment, with brands like Athleta expanding product offerings to meet demand for comfortable, stylish, and performance-enhancing apparel catering to the evolving needs of female consumers.
By Application
Professional athletic held a dominant functional apparel market share of 38.80% in 2024, with elite team sportswear as the leading subsegment. The National Collegiate Athletic Association supports athlete development programs, boosting demand for specialized high-performance apparel. Major sports events and sponsorships enhance visibility and investment in this segment. Brands develop advanced fabrics and technologies catering to professional athletes’ needs, driving growth and innovation in professional athletic functional apparel globally.
Outdoor activities are the fastest growing with the highest CAGR of 7.28% during the forecast period from 2025 to 2032, driven by increasing interest in hiking and adventure sports. The U.S. Forest Service reports rising trail usage, supporting growth in outdoor apparel. Columbia Sportswear leads product innovation with durable, weather-resistant fabrics. Consumers seek functional apparel combining protection and comfort, fueling rapid expansion in the outdoor activities segment of functional apparel.
By Distribution Channel
Supermarkets/hypermarkets held a dominant functional apparel market share of 38.50% in 2024 due to easy accessibility and value pricing, especially in urban areas. Retailers like Walmart report growth in functional apparel sales, collaborating with sports brands to attract budget-conscious consumers. These channels provide convenience and wide product availability, boosting volume and market penetration, particularly in developing markets where price sensitivity remains a key factor influencing purchasing decisions in functional apparel.
Online retail is the fastest-growing segment with the highest CAGR of 7.28% during the forecast period from 2025 to 2032, driven by expanding e-commerce adoption and direct-to-consumer sales. The U.S. Census Bureau notes continuous growth in online apparel transactions post-pandemic. Nike and other major brands leverage digital platforms for personalized shopping experiences. This channel offers convenience and customization, capturing younger demographics and accelerating market growth in functional apparel.
Regional Analysis:
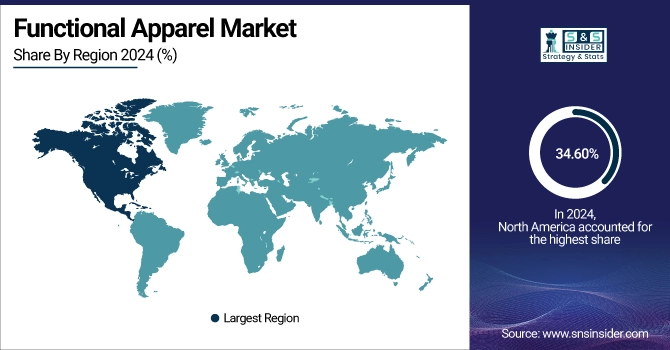
North America is dominating the functional apparel market with a significant market share of 34.60%, driven by strong consumer focus on health and fitness and advanced textile technologies. The U.S. leads, holding a market share of about 69.4% with a market size of USD 99.65 billion in 2024 and is projected to reach a market size of USD 168.98 billion by 2032, with widespread adoption of health monitoring apparel, supported by government initiatives like the CDC’s physical activity campaigns. The growing sportswear market in Canada also contributes to demand, with increased investments in smart fabrics and compression garments, enhancing comfort and performance. This region’s technological innovation and high disposable income reinforce its dominance.
Get Customized Report as per Your Business Requirement - Enquiry Now
Asia Pacific is the second-dominating and fastest-growing region in the functional apparel market, fueled by rising urbanization and increased awareness of health monitoring apparel. China and Japan are key contributors, with extensive government support for sports infrastructure and smart textiles development. India’s expanding middle class drives demand for affordable compression garments. The region’s young population and technological adoption accelerate functional textiles market growth, positioning Asia Pacific as a crucial growth hub for the industry over the forecast period.
Europe holds the third dominating position with a significant market share of 25.10%, supported by robust functional textiles manufacturing and eco-conscious consumer trends. Germany and the UK lead due to stringent environmental policies promoting sustainable apparel production. The European Commission’s funding for smart textile research boosts the compression garments market. France’s active lifestyle culture also drives sportswear market growth. This combination of sustainability focus and innovation sustains Europe’s steady position in the global functional apparel market.
Key Players:
The major functional apparel market competitors include 361° (361Aprt), Adidas AG, Amer Sports, Arc'teryx, ASICS Corporation, Columbia Sportswear Company, Decathlon S.A., Helly Hansen, Lululemon Athletica Inc., Mizuno Corporation, New Balance Athletics, Inc., Nike, Inc., Oakley, Inc., Patagonia, Puma SE, Salomon, The North Face, Under Armour, Inc., VF Corporation, and Fila.
Recent Developments:
-
In March 2024, ANTA Sports announced record-high 2023 audited results and reinforced its multi-brand growth plans, focusing on expanding its footprint in the global functional apparel market.
-
In February 2024, ASICS announced its GEL-LYTE III CM 1.95 received recognition for low CO₂ emissions, demonstrating the brand’s commitment to reducing environmental impact in functional footwear and apparel.
| Report Attributes | Details |
|---|---|
| Market Size in 2024 | USD 414.98 billion |
| Market Size by 2032 | USD 707.80 billion |
| CAGR | CAGR of 6.91% From 2025 to 2032 |
| Base Year | 2024 |
| Forecast Period | 2025-2032 |
| Historical Data | 2021-2023 |
| Report Scope & Coverage | Market Size, Segments Analysis, Competitive Landscape, Regional Analysis, DROC & SWOT Analysis, Forecast Outlook |
| Key Segments | •By Product (Sportswear, Activewear, Protective Clothing, Casual Wear, and Others) •By Fabric (Conventional Fabric [Polypropylene, Nylon, Polyester, and Others], Specialty Fabric [Neoprene, Spandex, and Others], and Others) •By Technology (Water-resistant, Anti-microbial, Moisture Wicking, Stain-resistant, UV-Protection, and Others) •By Consumer Group (Male, Female, and Kids), •By Application (Professional Athletic, Amateur Athletic, Outdoor Activities, Workwear / Industrial Use, and Others), •By Distribution Channel (Supermarkets/Hypermarkets, Convenience store, Specialty Stores, Online Retail, Others) |
| Regional Analysis/Coverage | North America (US, Canada, Mexico), Europe (Germany, France, UK, Italy, Spain, Poland, Turkey, Rest of Europe), Asia Pacific (China, India, Japan, South Korea, Singapore, Australia, Rest of Asia Pacific), Middle East & Africa (UAE, Saudi Arabia, Qatar, South Africa, Rest of Middle East & Africa), Latin America (Brazil, Argentina, Rest of Latin America) |
| Company Profiles | 361° (361Aprt), Adidas AG, Amer Sports, Arc'teryx, ASICS Corporation, Columbia Sportswear Company, Decathlon S.A., Helly Hansen, Lululemon Athletica Inc., Mizuno Corporation, New Balance Athletics, Inc., Nike, Inc., Oakley, Inc., Patagonia, Puma SE, Salomon, The North Face, Under Armour, Inc., VF Corporation, and Fila |
Frequently Asked Questions
Innovations include biodegradable fabrics, antimicrobial and moisture-wicking technologies, and sensor-integrated textiles providing comfort, hygiene, and data-driven performance insights.
Wearable technology boosts the market by integrating sensors into textiles, enabling real-time health monitoring and enhancing athletic performance for tech-savvy consumers.
Growth is driven by increasing health consciousness, government fitness initiatives, technological advancements in smart fabrics, and consumer demand for sustainable, high-performance apparel.
The functional apparel market involves performance-driven clothing using smart textiles and eco-friendly materials, evolving with rising health awareness and sustainability trends globally.
The functional apparel market is projected to reach USD 707.80 billion by 2032, growing at a CAGR of 6.91% from 2025 to 2032.
Get in Touch
