Flexible Graphite Market Size Analysis:
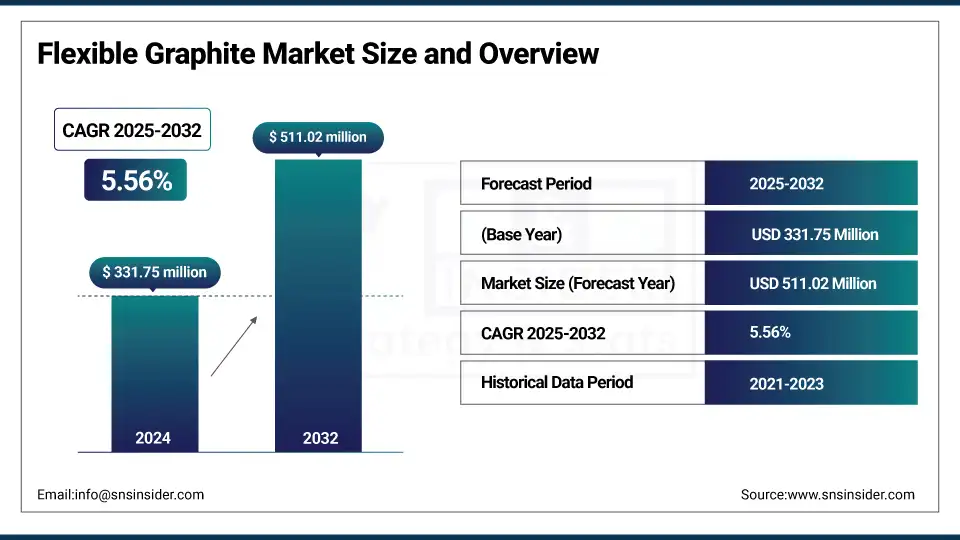
The Flexible Graphite market size was valued at USD 331.75 million in 2024 and is expected to reach USD 511.02 million by 2032, growing at a CAGR of 5.56% over the forecast period of 2025-2032.
The flexible graphite sector is growing quickly as the demand from automotive electrification and renewable energy segments for high-performance thermal management systems continues to rise. Flexible graphite companies are developing ultrathin tapes for EMI shielding in electronics and high-performance sheets as gaskets and seals in harsh environments. Sustainability trends underpinned by U.S. DOE incentives pertaining to low-carbon synthetic graphite and recyclability has driven the flexible graphite market. Analysis of on flexible graphite market indicates that the development of novel applications such as nanocoated foils for heat spreaders will contribute to the expansion of product portfolios, which will also impel flexible graphite market size.
To Get more information On Flexible Graphite Market - Request Free Sample Report
According to the authoritative statistics, the U.S. imported roughly 60,000 tons of natural graphite that year, with consumption near 52,000 tons. Mersen’s new Tennessee facility, in addition, makes 2,000 tons of synthetic graphite a year with a target of 4,000 tons by the end of the year, which, together with stable and flexible graphite market size with growth ahead, provide optimism for the segment’s future growth.
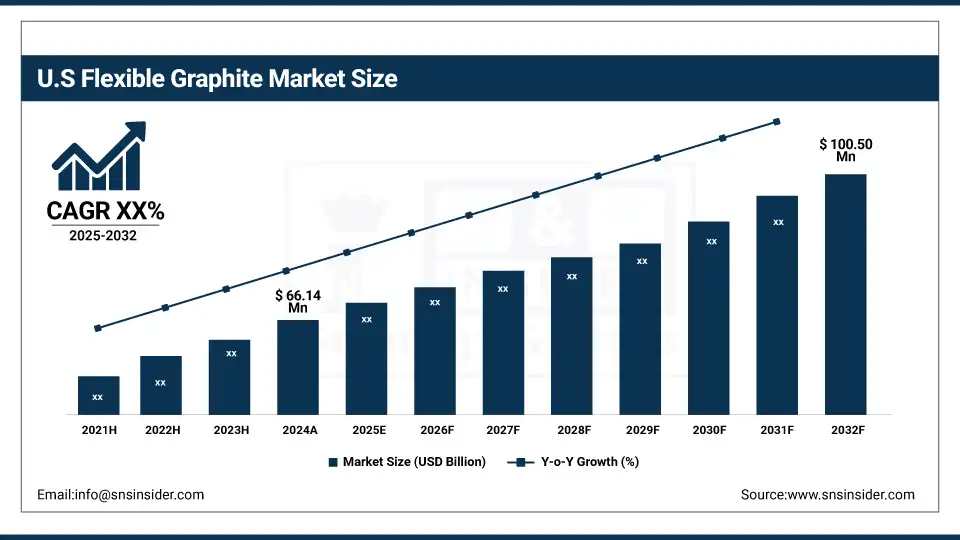
The United States dominates regional growth with a market size of USD 66.14 million and is projected to reach a value of USD 100.50 million by 2032 with a market share of about 73%. The growth is driven by widespread use of flexible graphite in electric vehicle battery systems and refinery sealing applications. Canada is the growth leader with accelerating investment in clean energy and renewable infrastructure. Such trends are contributing to the flexible graphite market expansion and are indicative of shifting flexible graphite market dynamics in high-tech sectors.
Flexible Graphite Market Dynamics:
Drivers:
-
Expansion of electric vehicle battery thermal management drives flexible graphite demand
The growing production of electric vehicles, which is expected to surpass more than 10 million units worldwide by 2023, is contributing to the demand for flexible graphite in battery thermal management. Elastic graphite sheets/foils are used for ideal thermal release to ensure the battery will not be overheated, and extend battery life by 20%. Flexible graphite majors are scaling up capacity to cater to this demand. The U.S. Department of Energy sponsors innovation in this sector, underscoring the importance of flexible graphite when it comes to maintaining energy-efficient systems and growing and expanding market share in the flexible graphite market.
-
Growth in renewable energy infrastructure fuels the need for advanced heat storage solutions
Growing number of renewable energy installs, thermal storage systems required, and flexible graphite foils provide 30% better heat transfer in phase change materials. The U.S. DOE’s SunShot Initiative points to a 25% decline in the cost of solar thermal storage from 2010 to present, that is where graphite comes in. Over 1bn dollars invested in states and countries like California are propelling growth in its flexible graphite market and increasing its share of the sustainable energy solutions market.
Restraints:
-
Infrastructure investment lag slows the development of recycling and sustainable graphite practices
Approximately 5% of waste flexible graphite is recycled globally, owing to an absence of collection and recycling networks. What is more, relying on virgin graphite means costs in terms of economy and environment. Although some companies operate pilot recycling programs, the absence of widespread infrastructure builds a limit to further expansion and market share repositioning of sustainable graphite users. The gap is evident in the U.S. EPA’s 2023 Waste Characterization to Report.
Flexible Graphite Market Segmentation Analysis:
By Type
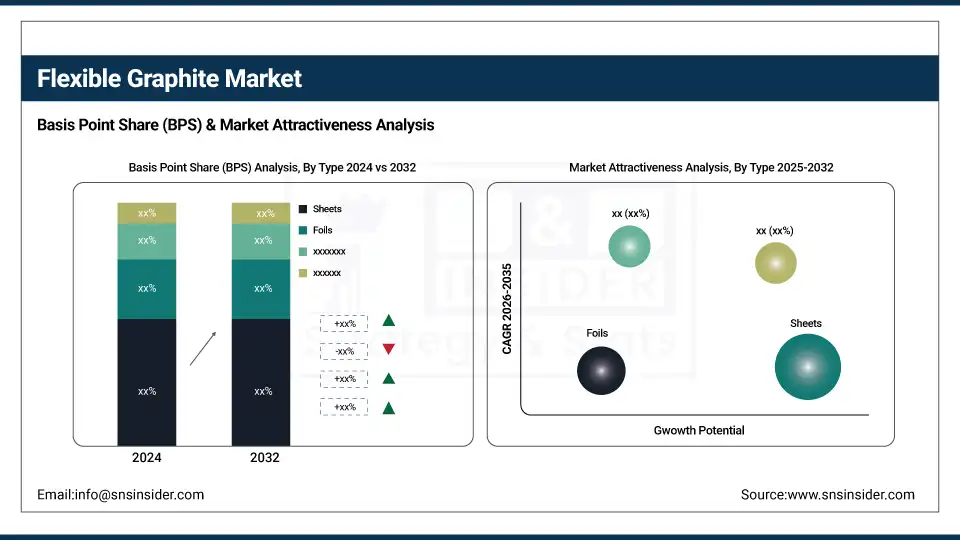
In 2024, sheets dominated the flexible graphite market with a 42.5% share due to their widespread use in sealing, gasketing, and thermal insulation applications. The compressibility and thermal capability of such are needed for the archaic mill applications. First the use of Mersen’s expanded graphite sheets in chemical plants, which comply with U.S. EPA emission control, an interesting fact that enhances their relevance. This characteristic is supportive of the leadership position in the sheets segment and are responsible for driving the growth of flexible graphite market in the general trend.
On the other hand, flexible graphite foils are the fastest-growing type, projected to expand at a 6.2% CAGR through 2032. Their thin, flexible and heat-conducting properties are perfect for electronics, for heat spreaders, for renewable energy storage. The U.S. Department of Energy's SunShot program promotes the use of high-conductivity in concentrated solar systems, driving demand for graphite foils. This momentum is responsible for the expansion of the flexible graphite market and foils have taken centerstage in newfangled flexible graphite market trends.
By Application
In 2024, the gaskets and seals segment dominated the largest flexible graphite market with 49.5% market share, driven by the performance of spiral-wound gaskets in harsh environments. Flexible graphite withstands temperatures above 500 °C and high-pressure conditions, making it ideal for industrial use. The U.S. EPA’s industrial emissions rule requiring a 15% reduction in fugitive emissions by 2027 has accelerated upgrades in sealing systems, reinforcing the segment’s leadership and shaping current flexible graphite market trends.
However, the gaskets and seals segment is projected to be the fastest-growing application from 2025 to 2032, with a 5.77% CAGR. This growth is supported by compliance with American Petroleum Institute standards, particularly in LNG and refinery operations. Flexible graphite’s extended lifecycle and resistance to harsh environments position it as the preferred material for sealing. Retrofit projects and infrastructure upgrades across heavy industries further strengthen its contribution to flexible graphite market growth and application-level expansion.
By End-use Industry
In 2024, the automotive industry dominated the flexible graphite market with a 30.2% share, largely due to the widespread use of graphite sheets in electric vehicle battery thermal management. These sheets regulate temperature between 20 °C to 40 °C, improving safety and lifespan by up to 15%. Companies like Tesla and General Motors integrate flexible graphite into their battery packs, supported by U.S. Department of Energy programs, reinforcing the automotive industry’s dominant position in the flexible graphite market share and growth.
Moreover, the electronics segment is expected to grow at the highest rate of 6.22% CAGR through 2032, fueled by demand for EMI shielding and thermal control in compact devices. Ultra-thin graphite tapes are widely used in smartphones, wearables, and aerospace applications. NASA testing demonstrated a 40 dB reduction in satellite signal interference using graphite shielding, showcasing its advanced capabilities. These innovations underscore electronics’ expanding role in flexible graphite market trends and future market share.
Flexible Graphite Market Regional Analysis:
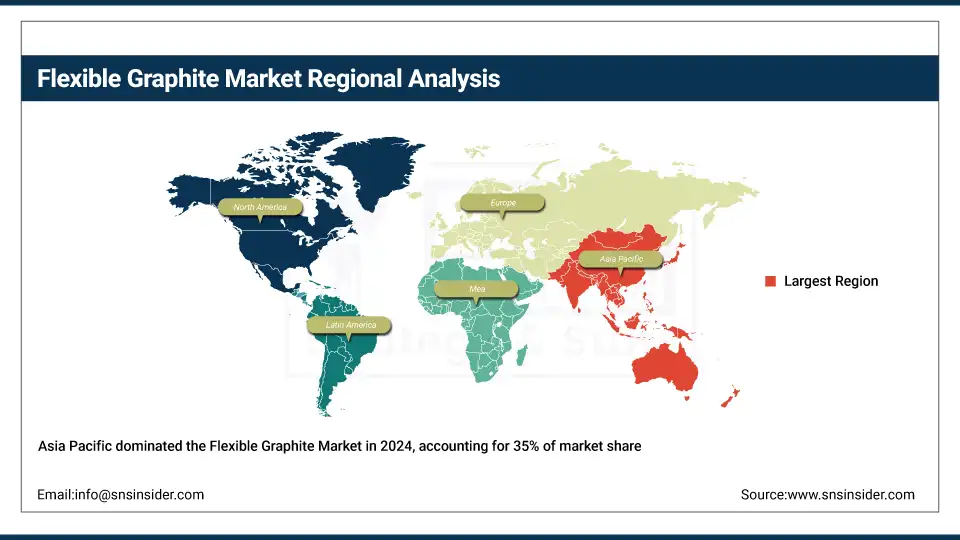
Asia Pacific dominated the flexible graphite market in 2024, capturing a leading market share of 35%, fueled by strong manufacturing ecosystems in China, India, and Japan. China is the major contributor because it occupies a dominant position in lithium ion battery manufacturing and the use of flexible graphite in industrial sealing systems. India is emerging in electronics and EV manufacturing which will further boost the demand in the region. The region has significant production capacity and increasing industrialization which further guide the trends for the flexible graphite market in Asia Pacific and make the region a leader in the growth of the global flexible graphite market.
Get Customized Report as per Your Business Requirement - Enquiry Now
North America held the second-largest share in the flexible graphite market with a 27% market share in 2024, driven by strong demand from the automotive, aerospace, and industrial sectors. The United States dominates regional growth with a market size of USD 66.14 million and is projected to reach a value of USD 100.50 million by 2032 with a market share of about 73%. The growth is driven by widespread use of flexible graphite in electric vehicle battery systems and refinery sealing applications. Canada is the growth leader with accelerating investment in clean energy and renewable infrastructure. Such trends are contributing to the flexible graphite market expansion and are indicative of shifting flexible graphite market dynamics in high-tech sectors.
Europe ranked third in the flexible graphite market in 2024 with an 18% market share and is projected to grow at the fastest CAGR of 6.5% from 2025 to 2032. Germany is the largest market led by robust end use applications in the automotive and emission compliant systems where flexible graphite parts are used. France and the U.K. are also driving energy storage and industrial manufacturing adoption. These are the trends in which are increasing the market share of the flexible graphite in Europe leading toward the up rise in the flexible graphite market growth in the global platform.
Latin America is an emerging region in the flexible graphite market, driven by the expanding oil and gas sector and growth in automotive component manufacturing across Brazil. The region is also witnessing increased adoption of flexible graphite in thermal management and sealing applications. Mexico is showing consistent development supported by its growing electric vehicle supply chain and industrial modernization initiatives. These factors reflect dynamic shifts in flexible graphite market trends and indicate increasing potential for flexible graphite market growth across Latin America in the coming years.
The Middle East and Africa region is gaining momentum in the flexible graphite market, supported by rising infrastructure investments and the expansion of the petrochemical and energy sectors. Saudi Arabia is leading regional adoption due to high investments aligned with its Vision 2030 industrial goals, where flexible graphite is increasingly used in high-temperature sealing systems. South Africa contributes to demand in the mining and manufacturing sectors, highlighting the region’s evolving role in the flexible graphite market size and supporting long-term market development.
Flexible Graphite Market Key Players:
The major flexible graphite market competitors include SGL Carbon, Toyo Tanso Co., Ltd., Mersen, NeoGraf, Nippon Carbon Co., Ltd., EGC Enterprises Inc., Curtiss-Wright Corporation, Garlock, Jiangxi Dasen Technology Co., Ltd., and Klinger AG Egliswil.
Recent Developments in the Flexible Graphite Market:
-
In March 2025, CarbonScape was granted U.S. Patent No. US12187615B2 for biochar‑derived battery‑grade graphite, establishing a sustainable domestic supply alternative
-
In February 2023, Northern Graphite secured a 50.1% stake in NeoGraf Solutions, enabling vertical integration into specialty natural graphite products for EVs, thermal management, and nanotech
| Report Attributes | Details |
|---|---|
| Market Size in 2024 | USD 331.75 million |
| Market Size by 2032 | USD 511.02 million |
| CAGR | CAGR of 5.56% From 2025 to 2032 |
| Base Year | 2024 |
| Forecast Period | 2025-2032 |
| Historical Data | 2021-2023 |
| Report Scope & Coverage | Market Size, Segments Analysis, Competitive Landscape, Regional Analysis, DROC & SWOT Analysis, Forecast Outlook |
| Key Segments | •By Type (Sheets, Foils, Tapes, and Others) •By Application (Gaskets & Seals, Thermal Management, Emi Shielding, and Others) •By End-Use Industry (Aerospace, Automotive, Electronics, Industrial Manufacturing, Oil & Gas, Energy & Power, and Others) |
| Regional Analysis/Coverage | North America (US, Canada, Mexico), Europe (Germany, France, UK, Italy, Spain, Poland, Turkey, Rest of Europe), Asia Pacific (China, India, Japan, South Korea, Singapore, Australia, Rest of Asia Pacific), Middle East & Africa (UAE, Saudi Arabia, Qatar, South Africa, Rest of Middle East & Africa), Latin America (Brazil, Argentina, Rest of Latin America) |
| Company Profiles | SGL Carbon, Toyo Tanso Co., Ltd., Mersen, NeoGraf, Nippon Carbon Co., Ltd., EGC Enterprises Inc., Curtiss-Wright Corporation, Garlock, Jiangxi Dasen Technology Co., Ltd., and Klinger AG Egliswil |
Frequently Asked Questions
Flexible graphite market trends in electronics are driven by EMI shielding needs in wearables and aerospace devices.
The aerospace sector boosts growth with qualified SLS-printed PEEK parts for UAVs and aircraft interiors.
The flexible graphite market is expected to grow at a CAGR of 5.56% from 2025 to 2032.
The flexible graphite market is expected to reach USD 511.02 million by 2032, supported by growth in electric vehicles and renewable energy.
The flexible graphite market size was valued at USD 331.75 million in 2024 due to robust demand in sealing and thermal management applications.
Get in Touch
