Generative AI in Logistics Market Size & Overview:
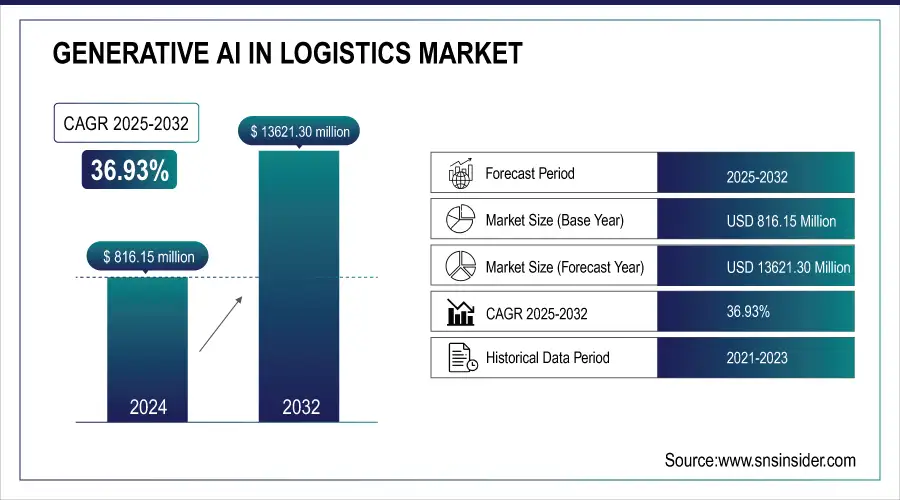
The Generative AI in Logistics Market size was valued at USD 816.15 million in 2024 and is expected to reach USD 13621.30 million by 2032, growing at a CAGR of 36.93% from 2025-2032.
Generative AI in Logistics growth is influenced by soaring demand for automating operations, optimizing routes, making decisions in real time, and predictive modeling. Better efficiency of supply chain, lowered operation cost, and better customer satisfaction also catalyze the push to adoption. Its integration with IoT and big data also causes accelerated market growth in every sector.
C.H. Robinson uses generative AI to automate 10,000+ daily email-based logistics tasks, including quotes, load tenders, and appointments, while piloting AI for in-transit visibility, significantly reducing response times and enhancing efficiency across 26,000+ shipment locations.
Generative AI in Logistics Market Size and Forecast
-
Market Size in 2024: USD 816.15 Million
-
Market Size by 2032: USD 13621.30 Million
-
CAGR: 36.93% from 2025 to 2032
-
Base Year: 2024
-
Forecast Period: 2025–2032
-
Historical Data: 2021–2023
To Get more information on Generative AI in Logistics Market - Request Free Sample Report
Generative AI in Logistics Market Trends
-
Rising need for automation and efficiency in supply chain operations is driving the generative AI in logistics market.
-
Growing adoption for route optimization, demand forecasting, and warehouse automation is boosting efficiency.
-
Integration with IoT, digital twins, and robotics is enhancing real-time decision-making and predictive insights.
-
Expansion of e-commerce and global trade is fueling demand for AI-driven logistics solutions.
-
Advancements in natural language processing and generative models are improving customer communication and documentation.
-
Focus on reducing costs, delays, and carbon footprint is shaping adoption trends.
-
Collaborations between logistics providers, AI developers, and technology firms are accelerating innovation and deployment.
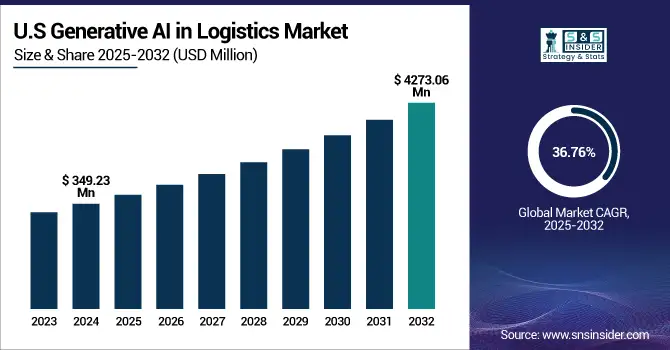
U.S. Generative AI in Logistics Market size was valued at USD 349.23 million in 2024 and is expected to reach USD 4273.06 million by 2032, growing at a CAGR of 36.76% from 2025-2032.
The U.S. Generative AI in logistics market is expanding with heightened demand for automation, route optimization, and data-driven decision-making. Developments in AI, IoT integration, and predictive analytics are increasing supply chain efficiency, lowering costs, and enhancing customer satisfaction.
According to EY, 30% increase in workforce productivity has been achieved by a major U.S. logistics company using GenAI for warehouse route optimization, and 40% of supply chain organizations are investing in GenAI, primarily for knowledge management applications.
Generative AI in Logistics Market Growth Drivers:
-
Automation reduces manual workload and increases operational efficiency across routing, warehousing, and transportation logistics processes significantly
Generative AI streamlines logistics by automating processes like route optimization, inventory handling, and shipping scheduling, saving labor costs and human mistakes. AI models are trained on historic data, adjust dynamically, and provide real-time optimized choices. For example, AI predicts delayed deliveries and provides alternative routes due to traffic and weather conditions. This automation lessens disruptions, improves the dependability of the supply chain, and allows for scalability. As logistics processes get more and more complicated, AI can deal with complex variables without getting tired, resulting in better productivity, customer satisfaction, and cost-effectiveness in the long term, placing logistics providers ahead in the digital economy.
According to EY, 62% of organizations have adopted AI for sustainability tracking and measurement, while 65% of vendors prefer negotiating with GenAI bots over human representatives due to efficiency and structure. Furthermore, a 37% to 39% expected productivity increase in customer interactions and 34% to 36% in production and assembly is anticipated through GenAI.
Generative AI in Logistics Market Restraints:
-
High implementation costs and infrastructure needs delay adoption of AI solutions by small and mid-sized logistics companies globally
Implementing generative AI in logistics is a high-cost affair in terms of hardware, software, and trained resources. Small and mid-size firms lack the financial resources to bear these costs, including IT system updates, cloud computing, cybersecurity, and training. These expenses deter AI deployment, particularly in low-margin businesses, with gains only accruing to well-funded organizations. Economical, scalable solutions are not available, preventing mass adoption, and a digital divide exists that prevents innovation across the logistics sector.
Custom Generative AI development ranges from USD 500,000 to USD 5 million based on project complexity. Upfront costs of a dedicated AI team can amount to as much as USD 320,000 per annum. On-premise infrastructure setup for Generative AI generally involves a one-time setup cost of about USD 21,000.
Generative AI in Logistics Market Opportunities:
-
Growing e-commerce volumes drive demand for AI-enabled optimization of last-mile delivery and personalized customer logistics experiences
The growth of cross-border e-commerce has increased the pressure on logistics infrastructure to deliver accuracy and speed. Best last mile delivery solution with AI It leverages the generative AI prediction for traffic, weather, and customer trends to create the most efficient routes possible. Aside from that, it allows dynamic pricing, parcel tracking and ETA notifications, which contribute to higher customer satisfaction. In addition, AI generates delivery recommendations based on previously analyzed data. In addition, AI creates personalized delivery recommendations based on previous behaviour.
In 2024, Blue Yonder said 91% of worldwide organizations reported that generative AI was effective in streamlining supply chain processes and decision-making. The company also makes 10 billion predictions every day, demonstrating the scope of its AI integration.
Generative AI in Logistics Market Challenges:
-
Complexity of integrating generative AI into legacy logistics systems delays transformation and impacts operational consistency
The majority of logistics firms continue to operate outdated IT infrastructures that hinder advanced integration of AI due to the fact that they incur compatibility issues, delays in data transfer, and incompatibility with modularity. Retrofitting AI means having siloed processes, data silos, and downtime. Upgrade involves not only technical improvements but also cultural and organizational adjustments, for which most companies are not ready. Without a clear digital roadmap, AI adoption projects stall, replicating efforts and costs. To overcome such challenges, money needs to be spent on change management, training, and infrastructure, which is a hindrance to digital transformation in traditional logistics businesses.
Approximately 59% of teams struggle with extracting data from legacy systems due to format mismatches, and 64% face challenges moving data from mainframes. Additionally, 31% of organizations encounter system limitations with outdated hardware.
Approximately 74% are not ready for AI integration, and 30% of logistics firms identify data privacy and security as major challenges to AI adoption. These are the factors that prevent the smooth implementation and scaling of AI technologies in logistics.
Generative AI in Logistics Market Segment Analysis
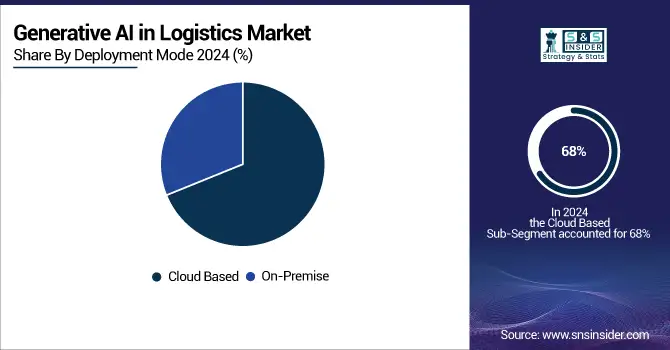
By Deployment Mode, Cloud deployment dominates the Market, Cloud deployment is also expected to grow fastest
The cloud segment dominated the Generative AI in Logistics Market with a revenue share of 68% in 2024 and is poised to progress at the highest CAGR of 37.70% between 2025 and 2032. This is due to the scalability, cost-effectiveness, and rapidity of deployment of cloud infrastructure that allow logistics companies to deploy and grow AI solutions without significant capital investment. With the logistics sector increasingly reliant on real-time data processing, predictive analytics, and automation, cloud platforms enable seamless updates of AI models, geographically hassle-free integration, and rapid responses to dynamic supply chain demands.
By Type, Variational Autoencoders (VAEs) dominate the Market, Generative Adversarial Networks (GANs) are expected to grow fastest
Variational Autoencoders (VAEs) commanded the highest revenue of approximately 30% in the Generative AI in Logistics Market in 2024 owing largely to their efficiency and stability of handling high-dimensional logistics data. Their capacity for producing realistic synthetic data to serve demand forecasting, route optimization, and anomaly detection purposes rendered VAEs appealing to early innovators. Moreover, VAEs easily embed into legacy platforms, guaranteeing wider adoption to existing logistics setups.
Generative Adversarial Networks (GANs) are expected to register the fastest CAGR of about 39.62% during the period between 2025 and 2032, fueled by their better performance in mimicking intricate logistics situations and creating realistic data to train autonomous systems. With supply chains embracing AI in making real-time decisions, GANs' ability to improve simulation environments, warehouse layout optimization, and predictability helps them become critical tools in future-proof logistics solutions.
By End User, Road Transportation dominates the Market, Shipping and Ports are expected to grow fastest
The road transportation segment led the Generative AI in Logistics Market share in 2024, generating approximately 34%, due to its enormous size and operational complexity. Generative AI technologies were adopted at a very fast pace in this segment for routing optimization, predictive maintenance, and fuel optimization. Due to its direct consumer influence and vast network, road transport emerged as the most tangible and fertile terrain for AI-powered performance and cost optimization.
The shipping and ports segment is forecasted to expand at the highest CAGR of approximately 39.94% during the period from 2025 to 2032 driven by rising automation and digitalization in maritime logistics. Increased need for real-time vessel tracking, port congestion control, and predictive maintenance has created a necessity for generative AI. Port operators and shipping lines are scrambling to invest in AI as global trade picks up and mounting sustainability regulations mean environment compliance becomes a priority.
Generative AI in Logistics Market Regional Outlook
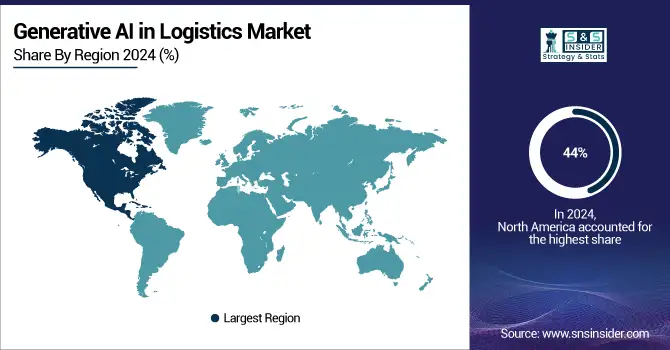
North America Generative AI in Logistics Market Insights
North America led the Generative AI in Logistics Market in 2024 with the largest revenue share of around 44%. This leadership was due to the strong establishment of key technology giants, early adoption of AI-based solutions, and extensive logistics infrastructure. The region is also supported by huge investments in AI R&D and a high-tech customer base, which fast-tracks the adoption of generative AI in multiple logistics and supply chain activities.
Get Customized Report as per Your Business Requirement - Enquiry Now
In 2024, the US led the Generative AI in Logistics Market due to world-class infrastructure, early adoption of AI, high tech presence, and extensive automation investment.
Asia Pacific Generative AI in Logistics Market Insights
Asia Pacific is expected to advance at the highest CAGR of approximately 39.18% during 2025-2032 based on swift digitalization, growing e-commerce market, and rising investments in AI technologies in emerging economies such as China and India. The increasing demand for effective logistics in the region, coupled with government incentives for smart infrastructure and AI development, is driving the demand for generative AI solutions that optimize routes, improve demand forecasting, and automate supply chains.
China is dominating the Generative AI in Logistics Market within Asia Pacific due to its massive e-commerce ecosystem, strong government support for AI, and rapid digital infrastructure development.
Europe Generative AI in Logistics Market Insights
Europe has a strong presence in the Generative AI in Logistics Market due to robust logistics networks, supportive AI regulations, widespread digital transformation, and significant investments aimed at boosting supply chain efficiency and sustainability.
Germany is dominating the Generative AI in Logistics Market in Europe due to its advanced industrial base, strong logistics infrastructure, and early adoption of AI technologies.
Middle East & Africa and Latin America Generative AI in Logistics Market Insights
Middle East & Africa and Latin America have a growing presence in the Generative AI in Logistics Market, driven by increasing investments in smart infrastructure, rising e-commerce activities, and efforts to modernize supply chains through AI-powered automation and predictive technologies.
Generative AI in Logistics Market Competitive Landscape:
Salesforce
Salesforce, founded in 1999 and headquartered in San Francisco, is a global leader in customer relationship management (CRM) software. The company integrates AI, analytics, and automation into its cloud-based platforms to support sales, marketing, service, and commerce functions. With its Einstein AI platform, Salesforce empowers enterprises to personalize engagement, streamline workflows, and improve customer satisfaction while advancing its vision of intelligent, connected, and data-driven business operations worldwide.
-
September 2024: Salesforce advanced its AI capabilities with agentic AI in Einstein GPT, automating complex customer service tasks such as processing returns and refunds. It also introduced an AI benchmark to help businesses evaluate large language models for efficiency.
Google, a subsidiary of Alphabet Inc., is a global technology leader known for its search engine, cloud services, and AI-driven innovations. The company invests heavily in artificial intelligence, cloud computing, and custom hardware to strengthen its ecosystem. By integrating advanced processors, data analytics, and scalable AI platforms, Google enables enterprises and developers to enhance performance, reduce costs, and expand innovation across industries, maintaining a strong foothold in the competitive cloud and AI markets.
-
April 2024: Google expanded its in-house chip efforts with the Axion CPU, designed to improve performance and energy efficiency in AI workloads. The move aims to reduce reliance on external vendors and strengthen its cloud infrastructure.
Microsoft Corporation
Microsoft Corporation, founded in 1975 and headquartered in Redmond, Washington, is a global technology giant providing software, hardware, cloud computing, and AI solutions. Its offerings include Windows, Azure cloud services, and AI-driven platforms that support enterprises in digital transformation. Microsoft emphasizes responsible AI development, data security, and innovation to drive business efficiency across industries, while maintaining leadership in productivity, enterprise solutions, and next-generation technologies like quantum computing and AI research.
-
July 2023: Microsoft researchers developed OptiGuide, a framework leveraging large language models to interpret supply chain optimization outcomes. The framework allows stakeholders to understand and trust AI-driven decisions without compromising proprietary data.
Key Players
Some of the Generative AI in Logistics Market Companies
- Deutsche Post AG
- UPS (United Parcel Services)
- Schneider Electric
- C.H. Robinson
- XPO Logistics
- FedEx Corp
- A.P. Moller - Maersk AS
- Blue Yonder
- Google Cloud
- International Business Machines (IBM)
- Microsoft
- PackageX
- Salesforce
- NVIDIA
- SAP
- Oracle
- Celonis
- Flexport
- PostNL
- Inoru
| Report Attributes | Details |
|---|---|
| Market Size in 2024 | USD 816.15 Million |
| Market Size by 2032 | USD 13621.30 Million |
| CAGR | CAGR of 36.93% From 2025 to 2032 |
| Base Year | 2024 |
| Forecast Period | 2025-2032 |
| Historical Data | 2021-2023 |
| Report Scope & Coverage | Market Size, Segments Analysis, Competitive Landscape, Regional Analysis, DROC & SWOT Analysis, Forecast Outlook |
| Key Segments | • By Type (Variational Autoencoder (VAE), Generative Adversarial Networks (GANs), Recurrent Neural Networks (RNNs), Long Short-Term Memory (LSTM) networks, Others) • By Deployment Mode (Cloud Based, On-premise) • By End User (Road Transportation, Railway Transportation, Aviation, Shipping and Ports) |
| Regional Analysis/Coverage | North America (US, Canada, Mexico), Europe (Germany, France, UK, Italy, Spain, Poland, Turkey, Rest of Europe), Asia Pacific (China, India, Japan, South Korea, Singapore, Australia, Rest of Asia Pacific), Middle East & Africa (UAE, Saudi Arabia, Qatar, South Africa, Rest of Middle East & Africa), Latin America (Brazil, Argentina, Rest of Latin America) |
| Company Profiles |
Deutsche Post AG, UPS (United Parcel Services), Schneider Electric, C.H. Robinson, XPO Logistics, FedEx Corp, A.P. Moller – Maersk AS, Blue Yonder, Google Cloud, International Business Machines (IBM), Microsoft, PackageX, Salesforce, NVIDIA, SAP, Oracle, Celonis, Flexport, PostNL, Inoru |
Frequently Asked Questions
Ans: Asia Pacific will grow fastest at a 39.18% CAGR, fueled by e-commerce expansion, AI investment, and digital transformation.
Ans: Road transportation held 34% market share due to large-scale operations and early adoption of AI for routing and fuel optimization.
Ans: The U.S. market was USD 349.23 million in 2024 and will likely reach USD 4,273.06 million by 2032.
Ans: Key drivers include automation demand, route optimization, predictive analytics, and real-time decision-making across logistics operations.
Ans: Generative AI in Logistics Market was valued at USD 816.15 million in 2024 and is expected to reach USD 13621.30 million by 2032, growing at a CAGR of 36.93% from 2025-2032.
Get in Touch
